Analytical framework and data
Non-rural commodities are divided into bulk commodities (i.e., iron ore, metallurgical coal and thermal coal) discussed above and non-bulk commodities (i.e., metals, minerals, ores and fuels, excluding the bulk commodities). Following Treasury’s short-term forecasting framework, each of the 16 non-bulk commodity prices and volumes are forecast using a bottom-up approach. Prices and volumes for each of these commodities rely heavily on publicly available forecasts from credible public and private forecasters who have expertise in forecasting the specific commodities. Where forecasts are not available a conservative assumption is applied.
Non-rural non-bulk exports volumes forecasts to 2017-18 are drawn from the Bureau of Resources and Energy Economics (BREE) outlook (BREE, 2013). There is no externally sourced forecast available for non-rural non-bulk commodities volumes beyond 2017-18. With the exception of liquefied natural gas (LNG), volumes are forecast to grow at their 10 year historical average annual growth rate (see Table 8 for a summary of the export volume forecast assumptions and sources). LNG volumes forecasts are based on BREE (2012).
With the exception of LNG, non-rural non-bulk export prices forecasts to 2022-23 are drawn from the mean forecasts reported in the most recent Consensus Economics (2013). Prices beyond 2022-23 are assumed to grow consistent with Treasury’s projection period expenditure price inflation assumption of 2.5 per cent (see Table 9 for a summary of the export price forecast assumptions and sources). Given the aggregate import price forecast assumption, this implies constant relative non-rural non-bulk export prices from 2022-23. LNG price forecasts are based on IEA (2012, Table 1.4).
Table 8: Non-rural commodities export volume forecast summary
| Commodity | 2014-15 to 2017-18 | 2018-19 to 2029-30 | Long-run growth rate (per cent) |
|---|---|---|---|
| Alumina | BREE (2013) | 10 year average | 2.2 |
| Bauxite | BREE (2013) | 10 year average | 5.8 |
| Copper ores and concentrates | BREE (2013) | 10 year average | 3.1 |
| Iron ore and concentrates | See Section 4 | ||
| Lead ores and concentrates | BREE (2013) | 10 year average | 1.8 |
| Nickel ores and concentrates | BREE (2013) | 10 year average | 7.7 |
| Uranium ores and concentrates | BREE (2013) | 10 year average | -3.3 |
| Zinc ores and concentrates | BREE (2013) | 10 year average | 2.2 |
| Metallurgical coal | See Section 4 | ||
| Thermal coal | See Section 5 | ||
| Crude oil | BREE (2013) | 10 year average | -0.8 |
| Liquefied natural gas (LNG) | BREE (2013) | BREE (2012)-low | 2.8 |
| Liquefied petroleum gas (LPG) | BREE (2013) | 5 year average | -3.8 |
| Aluminium | BREE (2013) | 10 year average | 0.8 |
| Copper | BREE (2013) | 10 year average | -2.3 |
| Lead | 10 year average | 10 year average | -1.1 |
| Nickel | BREE (2013) | 10 year average | -11.4 |
| Zinc | BREE (2013) | 10 year average | -1.6 |
| Iron and steel | BREE (2013) | 10 year average | -8.6 |
| Gold | BREE (2013) | 10 year average | 0.8 |
Finally, individual forecasts of bulk and non-bulk commodities are combined to generate volume and price forecasts for the five ABS non-rural commodity export categories: metal ores and minerals; coal, coke and briquettes; other mineral fuels; metals excluding non-monetary gold; and non-monetary gold (Table 10). Forecasts of these export categories are further aggregated to yield total non-rural commodity export volume and price forecasts.
Table 9: Non-rural commodities export price forecast summary
| Commodity | 2015-16 to 2022-23 | 2023-24 to 2029-2030 |
|---|---|---|
| Alumina | Consensus | 2.5 per cent |
| Bauxite | Alumina growth rate | Alumina growth rate |
| Copper ores and concentrates | Copper growth rate | Copper growth rate |
| Iron ore and concentrates | See Section 4 | |
| Lead ores and concentrates | Lead growth rate | Lead growth rate |
| Nickel ores and concentrates | Nickel growth rate | Nickel growth rate |
| Uranium ores and concentrates | Consensus | 2.5 per cent |
| Zinc ores and concentrates | Zinc growth rate | Zinc growth rate |
| Metallurgical coal | See Section 4 | |
| Thermal coal | See Section 5 | |
| Crude oil | Consensus | 2.5 per cent |
| Liquefied natural gas (LNG) | IEA (2012) | IEA (2012) |
| Liquefied petroleum gas (LPG) | Crude oil growth rate | Crude oil growth rate |
| Aluminium | Consensus | 2.5 per cent |
| Copper | Consensus | 2.5 per cent |
| Lead | Consensus | 2.5 per cent |
| Nickel | Consensus | 2.5 per cent |
| Zinc | Consensus | 2.5 per cent |
| Iron and steel | Consensus | Zinc growth rate |
| Gold | Consensus | 2.5 per cent |
Table 10: ABS non-rural commodity export categories (ABS cat. 5302.0)
| ABS Category | Commodity |
|---|---|
| Metal ores and minerals | Alumina Bauxite Copper ores and concentrates Iron ore and concentrates Lead ores and concentrates Zinc ores and concentrates Nickel ores and concentrates Uranium ores and concentrates |
| Coal, coke and briquettes | Metallurgical coal Thermal coal |
| Other mineral fuels | Crude oil and condensate Liquefied natural gas (LNG) Liquefied petroleum gas (LPG) |
| Metals (excl. non-monetary gold) | Aluminium Copper Iron and Steel Lead Zinc |
| Non-monetary gold | Gold |
Forecasts
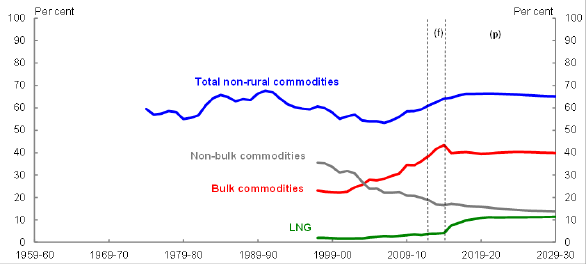
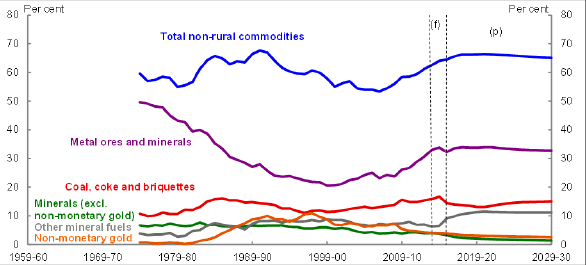
The volume of non-rural commodities as a share of total exports is expected to rise until 2017-18 and then remain roughly constant (Charts 25 and 26). Underlying this rising share are rapidly increasing volumes of LNG exports, increasing iron ore and metallurgical coal volumes and relatively flat thermal coal volumes. LNG’s share of the total exports volume is expected to more than double from 5 per cent in 2014-15 to around 12 per cent in 2020-21.
Chart 25: Export shares — non-rural bulk and non-bulk commodities

Source: Authors’ calculations.
Chart 26: Export shares — ABS non-rural commodity categories

Source: Authors’ calculations.
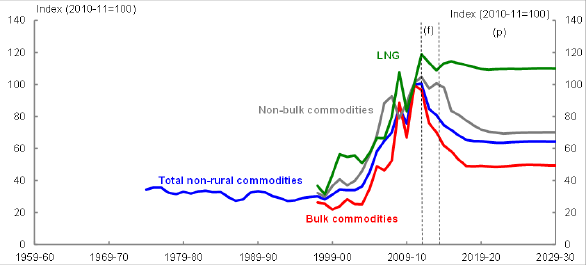
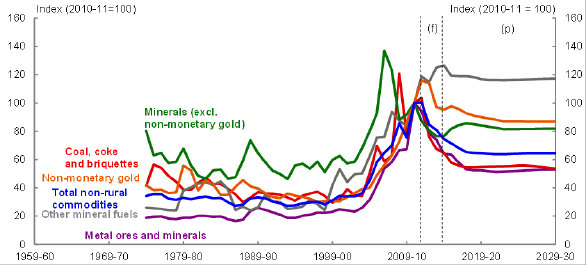
Charts 27 and 28 suggest that the decline in non-rural commodities export prices is primarily driven by the projected decline in bulk commodity prices until 2017-18. These relative prices are expected to settle at levels somewhat above the historical levels before the start of the resources boom (pre 2003-04). This change largely reflects rising real production costs for bulk commodities.
Chart 27: Relative export prices — non-rural bulk and non-bulk commodities

Source: Authors’ calculations.
Chart 28: Relative export prices — ABS non-rural commodity categories

Source: Authors’ calculations.