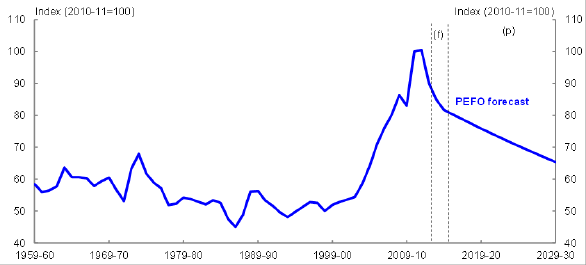
Australia’s terms of trade rose significantly over the 8 years to 2011-12 following a period of relative constancy over the preceding 40 years (Chart 1). Australian Government fiscal projections from the 2010-11 Budget to the 2013-14 Budget, assumed that beyond the near-term forecast period, the terms of trade would fall by 20 per cent over the subsequent 15 years.3 This approach was silent on when the expected decline would end and the level at which the terms of trade would eventually settle. This paper details the projection methodology underlying the terms-of-trade projection assumption in the 2013-14 MYEFO. In contrast to the earlier approach it provides guidance on the timing of the end of the current decline and the associated long-run level of the terms of trade.
Chart 1: Terms of trade history, forecasts and projections

Source: Authors’ calculations.
Note: In the 2013 PEFO, beyond the forecast period, the terms of trade were projected to fall by 20 per cent over the subsequent 15 years. This projection assumption had been used in Budget and MYEFO documents since the 2010-11 Budget.
Treasury divides its forecasting horizon into two distinct periods: the forecast period (f) which covers the first two years beyond the current fiscal year; and the projection period (p) which includes the last two years of the forward estimates and up to 36 years for intergenerational analysis. As documented in the recent review of Treasury’s macroeconomic and revenue forecasting (Australian Treasury, 2012), forecasts over the forecast period are based on detailed short-run forecasting models, while forecasts over the projection period are based on long-run rules developed in large part through the intergenerational reporting process (see, Australian Government, 2010, for details). These rules, including the rule that governs medium- to long-run projection of the terms of trade, are refined in light of new information or improved modelling techniques.
Treasury’s earlier terms of trade forecasting framework recognised two distinct phases of the mining boom: the initial demand phase over which there was a rapid rise in prices and a modest increase in supply; and the current supply phase during which the capital built over the demand phase is employed thereby rapidly increasing supply and lowering prices. In light of this, the earlier methodology assumed a two stage decline of the terms of trade over the supply phase, with an initial fall over the forecast period consistent with short-run models and market indicators, and a subsequent fall over the projection period based on a long-run rule-of-thumb of a 20 per cent decline over the following 15 years (Chart 1). This paper adds to this framework by allowing for a third phase of the mining boom, labelled the balanced growth phase (or long-run path), during which demand and supply move together, and the terms of trade display no secular trend.
The framework developed in this paper recognises that the terms of trade can be thought of as a weighted average of the prices of export categories relative to the aggregate import price level, with the weights equal to the volume of the export categories as a share of the total export volume. Following Treasury’s short-run forecasting methodology, exports are divided into the following broad categories: rural goods; non-rural commodities, which are further divided into bulk and non-bulk commodities; non-commodity goods; and services. The approach for each export category uses detailed price and volume modules. These modules include extensions of existing short-run econometric forecasting models, expert advice or credible publicly available information, and new modelling designed to capture important aspects of the data not explained by the earlier framework.
The centrepiece of the framework is global demand and supply modelling of the three major bulk commodities (iron ore, metallurgical coal and thermal coal) which provides long-run export volume and price forecasts of the bulk commodities that extend beyond the forecast horizons of other publicly available forecasts. Considerable attention has been paid to non-rural bulk commodities because historical data suggest they are a fundamental determinant of Australia’s long-run terms of trade. Each bulk commodity model uses detailed mine cost data from commercial providers to generate a supply curve, which is then intersected with a demand curve (based on a structural econometric model in the cases of iron ore and metallurgical coal, and International Energy Agency modelling in the case of thermal coal) to produce Australian export volume and unit export price forecasts over time.
The remainder of the paper is organised as follows: Section 2 outlines the projection methodology for aggregate import prices; Section 3 outlines the projection methodology for non-commodity goods and services export volumes and prices; Section 4 discusses the projection methodology for iron ore and metallurgical coal export volumes and prices; Section 5 discusses the projection methodology for thermal coal export volumes and prices; Section 6 outlines the projection methodology for rural export volumes and prices; Section 7 outlines the projection methodology for non-rural non-bulk commodity goods exports; Section 8 combines the forecasts of the various export volume and price modules to generate a medium- to long-run profile of the terms of trade; Appendix A reports the findings of various sensitivity analyses; and data sources are catalogued in Appendix B.
3 This assumption was maintained in the 2010 and 2013 Pre-Election and Fiscal Outlook (PEFO) reported by the Treasury and Department of Finance and Deregulation.