Analytical framework and data
Following Treasury’s short-run forecasting framework, rural goods are forecast using bottom-up volume and price analysis for each of the commodities within the four major ABS rural goods export categories: meat and meat preparations; cereal grains and cereal preparations; wool and sheepskins and other rural. For rural goods this involves forecasting 14 individual commodities, which are then aggregated using a weighted average of the growth in the individual commodities to forecast the relevant major ABS rural goods exports category (Table 6).
Prices and volumes for each of the 14 commodities rely heavily on published forecasts from the Australian Bureau of Agricultural and Resource Economics and Sciences (ABARES). Similar to Treasury’s short-term rural goods exports forecasts, long-run projections of rural goods exports rely on the latest medium-run forecasts generated by ABARES. Rural goods exports volumes forecasts from 2015-16 to 2017-18 are drawn from ABARES (2013). Beyond this, forecasts are based on long-term modelling reported in ABARES (2011), with exceptions and assumed long-run growth rates reported in Table 7. Export price forecasts for the period from 2015-16 to 2016-17 are also sourced from ABARES (2013). Beyond 2017-18 rural export prices forecasts are not available, so prices are assumed to grow consistent with Treasury’s projection period inflation assumption of 2.5 per cent. Given the aggregate import price forecast assumption, this implies constant relative rural export prices from 2017-18.
Table 6: ABS rural goods export categories (ABS cat. 5302.0)
| Category | Commodity |
|---|---|
| Meat and meat preparations | Beef and veal Live cattle Lamb Live sheep Mutton |
| Cereal grains and cereal preparations | Wheat Coarse grains Oilseeds |
| Wool and sheepskins | Wool |
| Other rural | Cotton Butter Cheese Skim milk powder Whole milk powder |
Table 7: Rural goods export volume forecast summary
| Commodity | 2015-16 to 2017-18 | 2018-19 to 2029-30 | Long-run growth rate (per cent) |
|---|---|---|---|
| Beef and veal | ABARES (2013) | ABARES (2011) | 1.5 |
| Lamb and mutton | ABARES (2013) | ABARES (2011) | 1.2 |
| Pig meat | ABARES (2013) | ABARES (2011) | 1.2 |
| Poultry | ABARES (2013) | ABARES (2011) | 1.0 |
| Coarse Grains | ABARES (2013) | ABARES (2011) | 0.8 |
| Canola | ABARES (2013) | ABARES (2011)-Oil seed | 0.7 |
| Wheat | ABARES (2013) | ABARES (2011) | 0.8 |
| Wool | ABARES (2013) | ABARES (2011) | 0.8 |
| Cotton | ABARES (2013) | ABARES (2011)-Other crops | 1.7 |
| Sugar | ABARES (2013) | ABARES (2011)-Other crops | 1.7 |
| Wine | ABARES (2011)-Other crops | ABARES (2011)-Other crops | 1.7 |
| Butter | ABARES (2013) | 20 year farm income growth rate | 3.3 |
| Cheese | ABARES (2013) | 20 year farm income growth rate | 3.3 |
| Casein | 20 year farm income growth rate | 20 year farm income growth rate | 3.3 |
Forecast
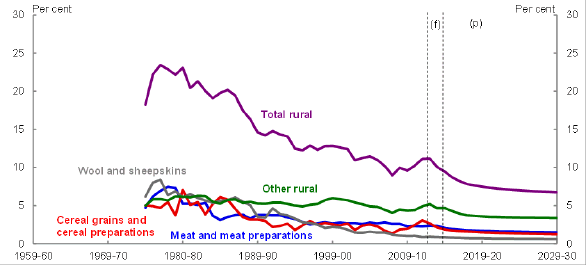
Expressed as a share of the total volume of exports, rural exports are expected to decline over the projection period from around 10 per cent to 7 per cent of total exports (Chart 23). This suggests rural goods prices will have a smaller influence on the overall terms of trade over the projection period. Turning to the major rural goods export categories, the framework suggests the composition of the rural export basket will remain roughly constant over the projection period, with exports of all major rural goods categories declining as a share of total exports.
Chart 23: Export shares — rural goods

Source: Authors’ calculations.
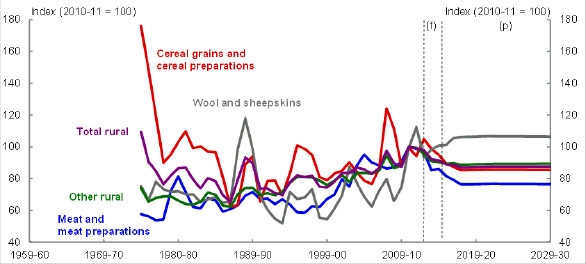
The relative price of total rural goods exports is expected to fall until 2017-18, when it is expected to settle above its historical average (Chart 24). This reflects a fall in the relative prices of meat, cereal and other rural exports and a less than offsetting rise in the relative export price of wool.
Chart 24: Relative export prices — rural goods

Source: Authors’ calculations.