This section outlines the projection methodology for thermal coal export volumes and prices.
Analytical framework
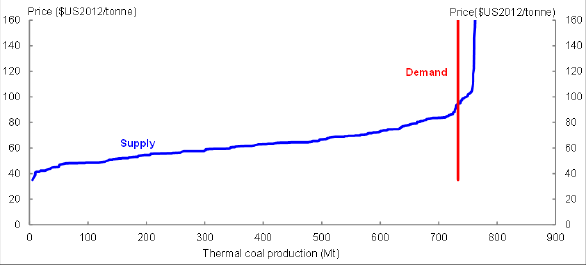
Thermal coal volumes and prices are estimated using a global supply and demand approach similar to that used for iron ore and metallurgical coal. In the case of thermal coal it is assumed that the demand curve is perfectly inelastic with the level of demand based on seaborne trade forecasts reported by the International Energy Agency (IEA) (2012). Annual (calendar year) global trade forecasts are derived by the intersection of the vertical demand curve and an externally sourced empirical global trade cost curve (Chart 18). The Australian export volume forecast for thermal coal for a given year is the sum of Australian mine output with lower seaborne production costs than the forecast market clearing price. This process is repeated each year which yields an export price and volume path for thermal coal for all years of available cost curve data.
Chart 18: Thermal coal demand and supply (2013)
Source: Authors’ calculations based on data from Wood Mackenzie and International Energy Agency.
Data
Thermal coal supply
Thermal coal cost curves are sourced from Wood Mackenzie. The thermal coal cost curves are on an energy adjusted basis to simulate the costs of producing a standard Australian Newcastle type export thermal coal with a specific energy of 6322 kcal/kg. The total cash cost is a combination of a mine’s operating cash costs plus royalties and levies. For seaborne exports, the total cash costs are estimated on a free-on-board (FOB) basis. Capital costs (either expansionary or sustaining) are not included in the cash cost estimate. To account for take-or-pay contracts, a declining percentage (linearly declining from 100 per cent to 0 over an eight year period starting from 2012) of existing Australian thermal coal producers are assumed to continue exporting thermal coal at negative cash cost if the market price is greater than their cash cost less transport costs.
Thermal coal demand
Historical levels of global demand are calibrated to ensure they are consistent with actual price and export volume data and the global supply curve. These values are grown over the forecast period using forecasts of global seaborne thermal coal volumes reported in IEA (2012, Table 5.5). These data contain forecasts of international trade in thermal coal in 2010, 2020 and 2030 under three policy scenarios, with the New Policy Scenario assumed for the current analysis. Under this scenario, the volume of global thermal coal trade is expected to grow at an average annual rate of 3.7 per cent to 2020 and then decline slightly from 2020 to 2030 as recently introduced and planned policies to curb use take effect. Estimates of the implied thermal coal demand for years in between these published dates are constructed by growing demand for each of the intermediate years by the average annual growth rate over the interval.
Forecast
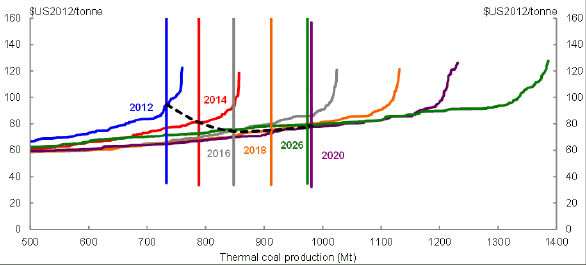
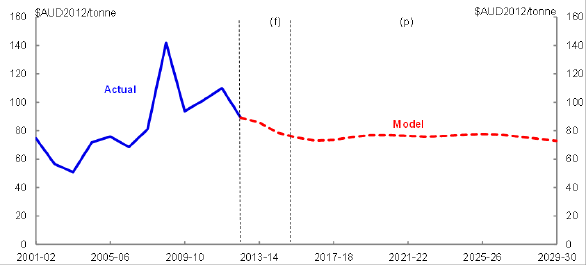
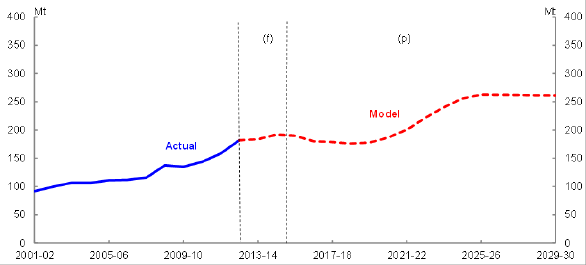
Chart 19 plots the thermal coal market demand and supply curves over the recent history (2012) and forecast and projection periods (2013 to 2026). The intersection of these curves provides global trade volume and price (expressed as a real price in 2012 US dollars) forecasts for thermal coal, which are then converted to Australian dollar unit export values (Charts 20 and 21). Note that the forecasts reported in the forecast period are generated by the global thermal coal model and are not necessarily the short-run forecasts underlying the 2013 PEFO.
Chart 19: Thermal coal demand and supply curves (forecast)
Source: Authors’ calculations based on data from Wood Mackenzie and International Energy Agency
Chart 20: Australian thermal coal real unit export price forecast
Source: Authors’ calculations.
Chart 21: Australian thermal coal export volume forecast
Source: Authors’ calculations.
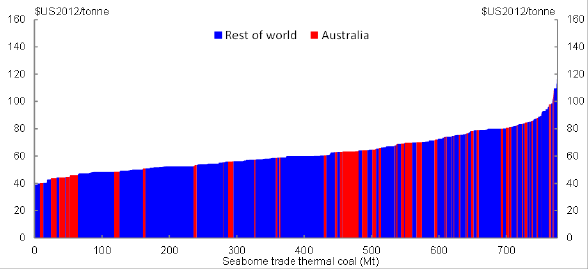
Chart 22: Thermal coal cost curve (2013)
Source: Wood Mackenzie.
In a similar vein to the steel analysis, the thermal coal framework suggests supply will increase at a much faster rate than demand over the projection period. As with iron ore, demand is expected to intersect the interior of the supply curve by 2014 ending the recent period over which demand intersected the near-vertical section of the supply curve. The shift of production to the flatter section of the supply curve is expected to cause the real price of thermal coal to fall to around 2016-17, with real prices remaining roughly constant for the balance of the projection period. In contrast to iron ore and metallurgical coal, the thermal coal model forecasts relatively weak Australian exports volumes over the medium-run from 2015-16 to 2020-21. This reflects the non-trivial share of Australian production situated in the right tail of the thermal coal cost curve (Chart 22). Since global thermal coal demand is expected to grow at a slower rate than supply over the projection period, this suggests that Australian thermal coal export volumes may decrease at a time when Australian production capacity is increasing.