This section outlines the projection methodology for iron ore and metallurgical coal export volumes and prices.
Analytical framework
Iron ore and metallurgical coal are, to a large extent, fully consumed as intermediate inputs in the global production of steel. Iron ore and metallurgical coal exports have therefore been modelled based on estimated demand and supply curves for intermediate inputs to global steel production. The intersection of these curves generates a forecast of the quantity of global steel production and the marginal input costs associated with that level of production. This in turn implies the global level of iron ore and metallurgical coal production and their associated global prices.
Demand for intermediate inputs to steel production
The demand for steel is a by-product of an underlying production function which is assumed to have a nested structure. The first level takes the form of a constant elasticity of substitution, constant returns to scale, production function in value-added (i.e., labour and capital inputs) and intermediate inputs (i.e., iron ore and metallurgical coal). At the next level intermediate inputs are used in fixed proportions with one tonne of crude steel (based on the blast furnace and basic oxygen furnace) requiring the input of 1.4 tonnes of iron ore and 0.77 tonnes of metallurgical coal (see World Steel Association, 2011, for details).4
Assuming the costs of other factors of production (i.e., value-added) grow at a similar rate to US consumer prices, country i’s demand for steel is as follows:
![]() (6 )
(6 )
![]() (7 )
(7 )
 ( 8)
( 8)
where at time t: CSit is country i’s steel consumption; CFEit is country i’s iron ore consumption, CMCit is country i’s metallurgical coal consumption; β0i is the country specific constant reflecting efficiency; β1 is the common price elasticity of steel demand with respect to steel input costs; PCSt is the US dollar global steel intermediate input cost; PFEt is the US dollar global iron ore price; PMCt is the US dollar global metallurgical coal price; PCPIUSt is the US consumer price index and IPit is the country i’s volume of industrial production.
The annual global steel demand curve is simply the sum of the individual country demand curves for a given intermediate input cost.5 The resulting demand model is similar to that used by the International Monetary Fund (2006) in their closely related analysis of the possible duration of the commodity price boom.6
Supply of intermediate inputs to steel production
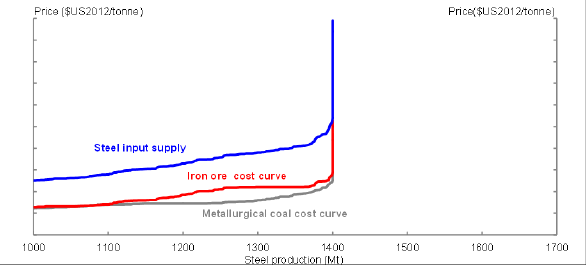
Estimates of the annual supply curves of steel intermediate inputs, iron ore and metallurgical coal, are based on private sector data. These data report the average variable cost of and maximum level of production for a large number of individual iron ore and metallurgical coal mines from around the world by calendar year. Mine-specific average variable cost and maximum production bundles are sorted by average cost to form global cost curves (global supply curves) for iron ore and metallurgical coal. The resulting supply curves can then be scaled according to their respective steel input requirements (i.e. multiply the average cost and divide maximum quantity of each mine by the input requirement) and summed vertically for a given steel production level to form a steel cost curve or supply curve (see Chart 9 for the indicative 2010 supply curves).
Chart 9: Indicative steel intermediate input supply (2010)
Source: Authors’ calculations based in part on data from Wood Mackenzie and Analyst-B.
Market for intermediate inputs to steel production
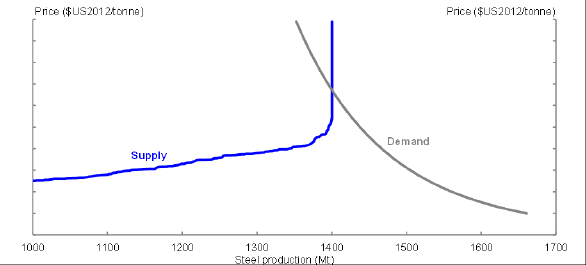
Armed with the empirical global demand curves implied by equations 6 to 8 and the empirical supply curves sourced externally, global steel intermediate input prices and quantities are determined by the intersection of these curves (i.e. the steel intermediate input market equilibrium) for a given year (Chart 10). The equilibrium global steel volume for a given year corresponds to required volumes of both iron ore and metallurgical coal, which in turn imply global iron ore and metallurgical coal prices via the input specific cost curves for that year.
Australian production volume forecasts for iron ore and metallurgical coal for a given year are the sum of Australian mine output with lower production costs than the market clearing price.7,8 This process is repeated each year which yields a price and volume path for the two commodities for all years of available cost curve data. Financial year forecasts are estimated as the average of the adjacent calendar year forecasts.
Chart 10: Indicative steel intermediate input demand and supply (2010)
Source: Authors’ calculations based in part on data from Wood Mackenzie and Analyst-B.
Data
Steel consumption
Historical steel consumption data (i.e., apparent steel use) are sourced from the World Steel Association (2013) for 19 countries, covering approximately 77 per cent of world steel consumption in 2012, and total world consumption from 1990 to 2012. To ensure the broadest coverage of data, a residual rest of the world is calculated using the sum of the individual countries and the world total.
Industrial production
Historical industrial production data are sourced from the World Bank (2012) for the 19 countries with steel consumption data and the world total. Forecasts of industrial production over the projection years are generated by Treasury’s version of ABARES Global
Trade and Environment Model (GTEM), conditional on the long-run international GDP projections generated by the methodology proposed by Au-Yeung, Kouparitsas, Luu and Sharma (2013). Industrial production for the residual rest of the world is assumed to grow at the same rate as the 19 country aggregate over the forecast period.
Metallurgical coal and iron ore cost curves
Metallurgical coal cost curves are sourced from Wood Mackenzie, while iron ore cost curves are sourced from another confidential commercial provider (hereafter referred to as Analyst-B).
Wood Mackenzie’s data provide detailed cash cost of production estimates that cover approximately 70 per cent of global metallurgical coal supply (444 mines). Analyst-B’s data provide detailed analysis of direct cash production costs for a broad range of iron ore mines globally. Analyst-B estimates that its database captures over 90 per cent of global iron ore supply (437 mines). No data sourced directly from Analyst-B are reported in this paper due to commercial-in-confidence.
Production costs are estimated on a real US dollar per tonne basis. The total cash cost is a combination of a mine’s operating cash costs plus royalties and levies. Capital costs (either expansionary or sustaining) are not included in the cash cost estimate. Examples of the cost components taken into account include the cost of mining, processing, maintenance, royalties, transportation and loading, but not shipping costs, with total costs estimated as Free on Board (FOB).
There are three main categories of metallurgical coal: (i) hard coking coal that forms high-strength coke; (ii) semi-soft coking coal that produces coke of lesser quality; and (iii) PCI (pulverized coal injection) coal. Wood Mackenzie uses the price of premium hard coking coal exported from Australia as the benchmark for its metallurgical coal cost curves. Prices for other metallurgical coals are assessed in relation to the hard coking coal base reference price and then assigned as a percentage discount or premium on that basis.
Parameter estimation and calibration
Steel intermediate input demand
The individual country steel demand equations (i.e., equation 6) are estimated jointly using ordinarily least squares. This approach yields a statistically significant estimate of the price elasticity of steel demand with respect to steel input costs of 0.09, which suggests the demand for steel and its intermediate inputs is relatively price inelastic.
Steel intermediate input supply
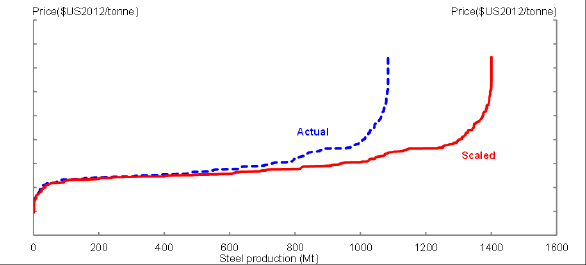
Historical metallurgical coal cost curve data from Wood Mackenzie and iron ore cost curve data from Analyst-B are scaled to ensure the historical intermediate input supply curves are consistent with actual levels of steel production (see indicative metallurgical coal supply in Chart 11) and observed market prices for metallurgical coal and iron ore. The scaling factors are the inverse of the coverage percentage of their respective datasets (i.e., around 1.1 for iron ore and 1.4 for metallurgical coal).
Chart 11: Indicative metallurgical coal steel input cost curve (2010)
Source: Authors’ calculations based on data from Wood Mackenzie.
Steel intermediate input market
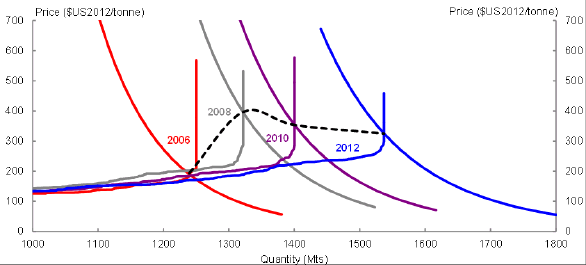
When combined, the estimated demand and calibrated supply curves provide an estimate of the goodness-of-fit of the overall framework. With the exception of 2009, the framework produces price and volume estimates that are close to their historical values. In 2009, the framework produces iron-ore price forecasts that are higher than the actual values, which reflects the fact that this is a medium- to long-run framework which is unlikely to capture large cyclical fluctuations such as those experienced during the GFC. The paths of the available historical demand and supply curves are plotted in Chart 12. This chart demonstrates that for most of the historical period, demand was sufficiently high to force supply to move along the vertical portion of the curve (i.e., prices have been above the marginal cost of production for even the highest cost producer).
Chart 12: Steel intermediate input demand and supply (history)
Source: Authors’ calculations based in part on data from Wood Mackenzie and Analyst-B.
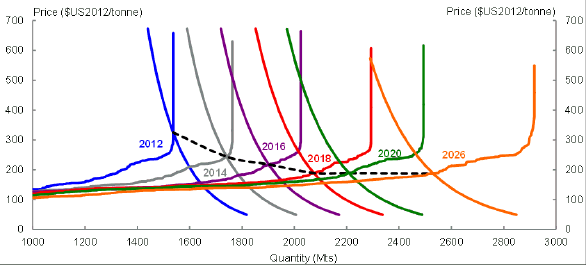
Chart 13: Steel intermediate input demand and supply (forecasts)
Source: Authors’ calculations based in part on data from Wood Mackenzie and Analyst-B.
Forecasts
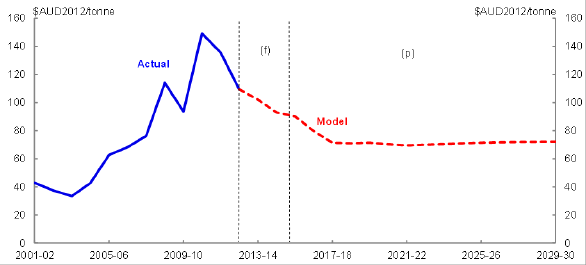
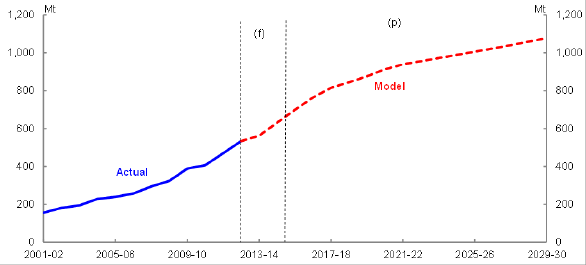
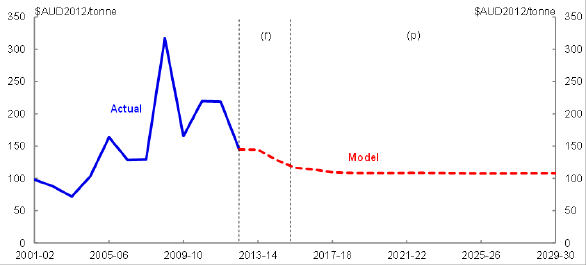
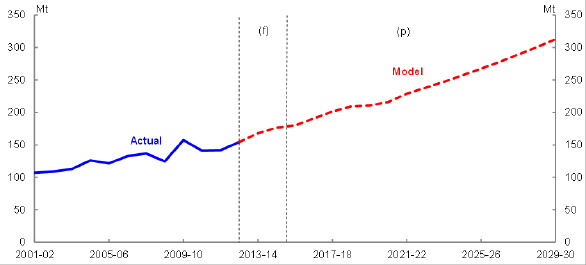
Chart 13 plots the steel intermediate input demand and supply curves over the end of the historical period (2012) and the forecast and projection period (2013 to 2026). The intersection of these curves provides global volume and price (expressed as a real price in 2012 US dollars) forecasts, which are then used to estimate Australian export volumes (i.e., equal to the sum of seaborne Australian production with cost below the global price) and Australian dollar unit export values for iron ore (Charts 14 and 15) and metallurgical coal (Charts 16 and 17). Note that the forecasts reported in the forecast period are generated by the global steel model and are not necessarily the same as the short-run forecasts underlying the 2013 PEFO.
These forecasts suggest supply will increase at a much faster rate than demand over the projection period. In particular, demand is expected to intersect the interior of the supply curve in the current calendar year, ending the recent period over which demand intersected the vertical section of the supply curve. The shift of production to the flatter section of the supply curve is expected to cause a rapid fall in the real price of both iron ore and metallurgical coal. This pattern is expected to end around 2017-18, with real prices remaining roughly constant for the balance of the projection period. At the same time the increased Australian potential supply and on-going increases in demand are expected to double the volume of Australian exports of iron ore and metallurgical coal over the projection period.
Chart 14: Australian iron ore real unit export price forecast
Source: Authors’ calculations.
Chart 15: Australian iron ore export volume forecast
Source: Authors’ calculations.
Chart 16: Australian metallurgical coal real unit export price forecast
Source: Authors’ calculations.
Chart 17: Australian metallurgical coal export volume forecast
Source: Authors’ calculations.
4 Increasing trends in usage of other competing technologies/substitutes such as electric arc furnaces and scrap metal may affect the quantities of iron ore and metallurgical coal required in the overall production of crude steel in the future.
5 For simplicity, the analysis is conducted on the basis of global steel and iron ore values. Given the nature of indigenous supply of raw materials in the sector, there are certain geographies (e.g. Brazil, Russia) that would not be expected to form ‘contestable’ demand for Australian iron ore exports.
6 The demand for steel equation (6) is a simplified function. The equation fails to take into account the importance of the real estate and construction sector — another big user of steel. This may result in a negative bias in the forecast for steel demand, especially so for developing countries with rapid urbanisation and infrastructure development.
7 While the analysis has been conducted on a global basis, the location of steel production facilities and the location of supply will matter to the clearing price and hence Australia’s production volumes.
8 Australia’s foreign exchange rate is an important factor that will determine the location of Australian production along the cost curves. While the market clearing price and volume remains unaffected, this may have a significant impact on the volumes of Australian exports.