Key facts
The number of Australians aged 65 and over is projected to more than double by 2054–55, with 1 in 1,000 people projected to be aged over 100. In 1975, this was 1 in 10,000.
Australians will live longer and continue to have one of the longest life expectancies in the world. In 2054–55, life expectancy at birth is projected to be 95.1 years for men and 96.6 years for women, compared with 91.5 and 93.6 years today.
The average annual rate of growth in the population is projected to be 1.3 per cent, compared with 1.4 per cent over the past 40 years.
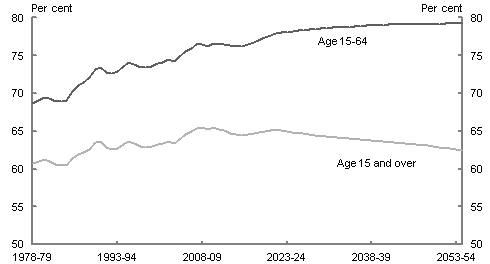
By 2054–55, the participation rate for people aged over 15 years is projected to fall to 62.4 per cent, compared to 64.6 per cent in 2014–15.
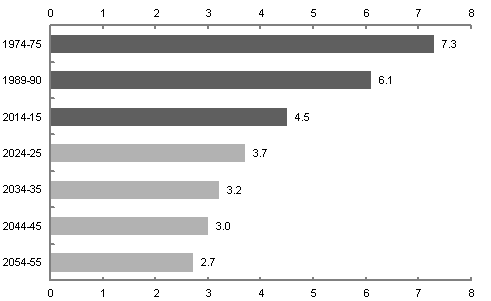
The number of people aged 15 to 64 for every person aged 65 and over has fallen from 7.3 people in 1975 to an estimated 4.5 people today. By 2054–55, this is projected to nearly halve again to 2.7 people.
Female employment is projected to continue to increase, following on from strong growth over the past 40 years. In 1974–75, only 46 per cent of women aged 15 to 64 had a job. Today around 66 per cent of women aged 15 to 64 are employed. By 2054–55, this is projected to increase to around 70 per cent.
During the 1990s, Australia's productivity grew at an estimated average rate of 2.2 per cent per year. Today, Australians produce twice as many goods and services for each hour worked as they did in the early 1970s.
The economy and incomes are projected to continue to grow, but at a slightly slower rate than over the past 40 years.
This chapter explains the long–term demographic projections underpinning the analysis in this report. It also outlines the long–term projections for key drivers of the economy: population, participation and productivity, and illustrates how projected changes would impact on our economy.
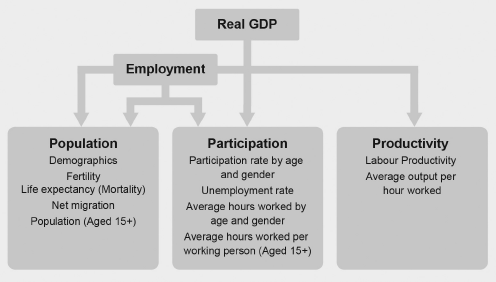
Economic growth is the increase in the quantity of goods and services a country produces (often referred to as Gross Domestic Product or GDP). Three main factors determine the quantity of goods and services that a country produces: population, participation and productivity.
While other variables, including natural disasters such as cyclones, can influence a country's GDP in the short term, intergenerational reports have used changes to population, participation and productivity to help explain the impact of government policies on GDP over 40 year timeframes. Chart 1.1 provides a framework for this analysis.
In the context of economic growth, the key component of population is considered to be the number of people over the age of 15 who may be available to work.
Participation is made up of three elements: how many people choose to seek work (the workforce participation rate), how many of them can get jobs when they do seek work (the unemployment rate) and the average number of hours worked by individuals who have jobs. Improvements in participation happen as more people choose to look for work, and more of them are able to find work.
Productivity is a measure of how much is produced, on average, for every hour that is worked. Over the long–term, technological developments are a key contributor to improvements in efficiency, as people and businesses find better ways to do their work. For example, the adoption of information and communications technologies in the 1990s helped workers undertake existing tasks more quickly and cheaply by enabling more efficient products, processes and organisational structures.
When combined, projections for population and participation give the number of hours worked in the economy. Combining this figure with productivity gives the total quantity of goods and services produced in the economy.
The future size and structure of the Australian economy are key determinants of the living standards of all Australians. These factors will have a strong influence over governments' ability to continue to afford to provide services and deliver community support into the future.
Chart 1.1 Population, participation and productivity
Source: Treasury.
1.1 Demography
1.1.1 Population projections
Australia's population over the next 40 years is, to a large extent, determined by the current population. Most of the likely future population is already living in Australia today. But the actual course that the Australian population takes will also depend on the particular interplay of future patterns and trends in fertility, mortality and migration. Each of these factors will have implications for both the size and the age structure of the population. Births clearly add to the younger cohorts of the population, deaths are concentrated in the older cohorts, and migrants tend to be concentrated in younger to middle age ranges.
Australia's population is projected to grow and change over the next 40 years. A growing population means greater demand for goods and services from businesses, and also more people available to work in businesses to produce those goods and services. The changing population means that the types of goods and services being consumed will be different, on average, from what they are today.
Under the central projection covered in this report, the average annual rate of growth in the population is 1.3 per cent, slightly slower than the annual average population growth rate of 1.4 per cent over the past 40 years. This growth rate would see Australia's population rise to 39.7 million by 2054–55. However, population projections are particularly sensitive to assumptions about the rate of net overseas migration. Australia's permanent migration intake is determined by government policy and is subject to review each year as part of the Budget process to reflect evolving economic and social circumstances, as discussed further below.
1.1.2 Factors that influence population projections
Fertility
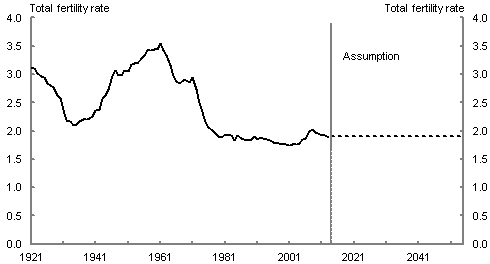
In 2013 the total fertility rate was 1.9 births per woman. This report assumes that the total fertility rate remains at 1.9 over the next 40 years, which is consistent with the observed trend in fertility over the past 35 years.
While the total fertility rate has remained steady since the late 1970s (Chart 1.2), a larger proportion of women are having their first child in their late 20s and early 30s, which is later than previous generations. This trend has been evident since the 1990s, and influences the structure of the population. This led to a lower total fertility rate in the 1990s, followed by a temporary period of higher fertility in the mid–2000s.
Over a period in the 2000s there was a short–term increase in fertility rates, with a particularly high number of births to women aged 30 to 39 years. The causes of this upswing in fertility are widely debated. A range of reasons has been put forward in this debate including favourable economic conditions, more flexible working arrangements, and increased levels of government support, including the baby bonus and Family Tax Benefit. Changing social expectations around parenting, particularly supporting the role of fathers may also have been influential. Finally, delayed fertility in a large cohort of women may have led to higher fertility rates in the short term.
Chart 1.2 Australia's historical and projected total fertility rate
Note: The total fertility rate is the number of children a woman would bear during her lifetime if she experienced the current age–specific fertility rates at each age of her reproductive life.
Source: ABS cat. no. 3105.0.65.001, 3301.0 and Treasury projections.
Mortality and life expectancy
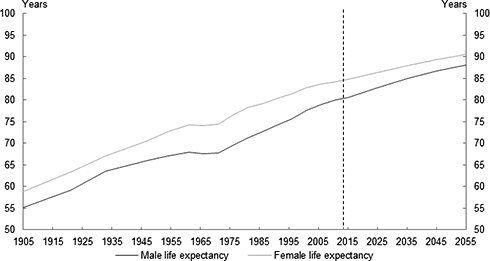
This report assumes continuing overall decline in mortality rates and improvement in life expectancies. Life expectancy at birth is projected to increase from 91.5 years in 2015 to 95.1 years in 2055 for males, and from 93.6 years in 2015 to 96.6 years for females (Table 1.1).
| 2014-15 | 2024-25 | 2034-35 | 2044-45 | 2054-55 | |
|---|---|---|---|---|---|
| Life expectancy at birth | |||||
| Men | 91.5 | 92.6 | 93.6 | 94.4 | 95.1 |
| Women | 93.6 | 94.5 | 95.3 | 96.0 | 96.6 |
| Further life expectancy at age 60 | |||||
| Men | 26.4 | 27.9 | 29.3 | 30.5 | 31.5 |
| Women | 29.1 | 30.3 | 31.5 | 32.4 | 33.3 |
| Further life expectancy at age 70 | |||||
| Men | 16.9 | 18.2 | 19.3 | 20.4 | 21.3 |
| Women | 19.3 | 20.4 | 21.4 | 22.3 | 23.1 |
Note: Cohort life expectancy at a given age takes into account known or projected changes in mortality over the remainder of the person's lifetime.
Source: Treasury projections.
There are two methods of measuring life expectancy: the ‘period' method and the ‘cohort' method.
The period life expectancy method measures life expectancy as the average age to which a person is likely to live given the mortality rates prevailing in that year. This method of measuring life expectancy does not take into account the advances in life expectancy that could reasonably be assumed during a person's lifetime.
Previous reports have used the period method to report life expectancy. In this report, life expectancy is reported using the cohort method unless otherwise indicated. The cohort life expectancy method takes into account assumptions of improvements in mortality rates over people's lifetimes, and therefore takes a better account of increasing life expectancy trends over time. These projections assume ongoing changes in lifestyles and advances in medicine and technology will continue to improve life expectancy in the future. By capturing these effects, the cohort life expectancy measure provides a more realistic estimate. Further discussion of this method is at Appendix C.
Australian life expectancies have risen over the past few decades (Chart 1.3) as a result of improvements in health, education, and public safety. For example, improvements in road safety such as seat belt laws and random breath testing during the 1970s contributed to increased life expectancy following their introduction. Significant health developments have also been influential, for example, widespread availability of heart by–pass surgery and reduction in smoking prevalence. These influences are further discussed in Box 1.1.
There is a notable difference between life expectancies at birth for Indigenous Australians and the Australian community more broadly. Based on data from 2010 to 2012, Indigenous life expectancy was estimated to be 69.1 years for males and 73.7 years for females (period method). A major policy objective for the Council of Australian Governments is to close the gap between Indigenous and non–Indigenous life expectancy within a generation, that is, by 2031.
Chart 1.3 Male and female life expectancy, 1905 to 2055
Note: These figures are period life expectancies.
Source: ABS cat. no. 3105.0.65.001 and Treasury projections.
Life expectancies at birth in Australia for both males and females remain among the highest in the world. According to UN data for the period 2010–15, Australia ranks equal first with Iceland in male life expectancy. For females, Australia ranks only behind Japan, Spain, France and Italy.
Box 1.1: Life expectancy improvements
This report assumes that life expectancy continues to improve over the projection period, reflecting recent trends.
The projections, however, cannot take into account all of the improvements in life expectancy that might happen over the next 40 years.
A projection of life expectancy for 2015 made in 1975 would not necessarily have fully taken into account the significant changes that have contributed to the life expectancy improvement of the past 40 years. For instance, since the 1970s we have seen dramatic improvements in health care for older people. In 1975, a 65 year old could expect to live another 13 years on average, while in 2015 this has improved to 19 years, thanks to better cardiac care and many other improvements in health care.
Similar breakthroughs could well be possible in the next 40 years. Medical research underway today in areas such as stem cell therapy, new medicines and other biotechnology has the potential to provide further dramatic improvements in life expectancy. It is for this reason that some experts have suggested that life expectancy may reach in excess of 140 years. The projections assume that the improvements from medical research continue at the same rate as the past.
There is also considerable scope for particular improvements in life expectancy in some specific age groups. Despite improved medical technology, life expectancy for people aged over 80 has changed by much less over the past century than for younger age groups. As there is a growing population in this age group it is expected to become an increased focus for medical research over the next 40 years.
According to the Australian Institute of Health and Welfare there have also been substantial ongoing increases in the length of time for which Australian men and women can expect, on average, to live without disability — so–called healthy life expectancy (Box 1.2).
Box 1.2: Healthy life expectancy
Australians are living longer, and importantly the increases in life expectancy are matched by increases in healthy life expectancy.
To measure this, the Australian Institute of Health and Welfare (AIHW) has estimated ‘health expectancies' for Australians. A male born in 2012 could expect to live 79.9 years (period method) and an average of 62.4 of those years without disability. A fe
male could expect to live 84.3 years, and an average of 64.5 of those years without disability. Of the years spent living with disability, an estimated 11.8 were without severe or profound core activity limitation for men, and 12.0 for women; that is, not needing help with activities of self–care, mobility or communication.
Recent improvements in life expectancy have been met or exceeded by improvements in these health expectancies. That is, not only are Australians' lives getting longer, they are enjoying good health for an increasing number of those extra years. Between 1998 and 2012, the AIHW has estimated that life expectancy at birth for males has increased by 4 years, while the number of years without disability increased by 4.4 years — that is, all of the additional life expectancy was in years without disability. For women, this was an increase of 2.8 years of life expectancy, with 2.4 in years without disability. For Australians at age 65, more of their increase in life expectancy has been for years without any severe disability.
The World Health Organisation publishes estimates of ‘healthy life expectancy' at birth. This measures the average number of years that a person can expect to live in ‘full health' by taking into account years lived in less than full health due to disease and/or injury. By this measure, in 2012 Australians had the equal fourth highest healthy life expectancy at birth in the world (73 years for both sexes combined), along with Spain, South Korea, Switzerland, Italy and San Marino.
Source: Australian Institute of Health and Welfare Bulletin 126, Healthy Life Expectancy in Australia: Patterns and Trends 1998 to 2012; World Health Organisation, Healthy Life Expectancy at Birth.
Box 1.3: Australia's demography — an international perspective
Australia's current total fertility rate of 1.9 births per woman is below the replacement level.1 Still, Australia's fertility rate is well above many European countries and countries in Australia's region such as China and Japan, although below that of New Zealand and the United States.
| Total fertility rate 2005-10 | Median age (years) | Population 65+ (per cent) | Total dependancy ratio (a) (per cent) | Population (millions) | Annual average population growth (per cent) | |
|---|---|---|---|---|---|---|
| Children per woman | 2010 | 2010 | 2010 | 2010 | 2005 to 2010 | |
| Australia | 1.9 | 36.8 | 13.4 | 48 | 22.4 | 1.8 |
| Canada | 1.6 | 39.7 | 14.2 | 44 | 34.1 | 1.1 |
| China | 1.6 | 34.6 | 8.4 | 36 | 1,359.8 | 0.6 |
| France | 2.0 | 40.0 | 16.8 | 54 | 63.2 | 0.6 |
| Germany | 1.4 | 44.3 | 20.8 | 52 | 83.0 | -0.2 |
| Greece | 1.5 | 41.8 | 19.0 | 50 | 11.1 | 0.1 |
| Hungary | 1.3 | 39.9 | 16.7 | 46 | 10.0 | -0.2 |
| India | 2.7 | 25.5 | 5.1 | 54 | 1,205.6 | 1.4 |
| Indonesia | 2.5 | 26.9 | 5.0 | 53 | 240.7 | 1.4 |
| Italy | 1.4 | 43.3 | 20.3 | 52 | 60.5 | 0.6 |
| Japan | 1.3 | 44.9 | 23.0 | 57 | 127.4 | 0.1 |
| Netherlands | 1.7 | 40.8 | 15.4 | 49 | 16.6 | 0.4 |
| New Zealand | 2.1 | 36.6 | 13.0 | 50 | 4.4 | 1.1 |
| Poland | 1.3 | 38.0 | 13.5 | 40 | 38.2 | 0.0 |
| Spain | 1.4 | 40.2 | 17.1 | 47 | 46.2 | 1.3 |
| Sweden | 1.9 | 40.7 | 18.2 | 53 | 9.4 | 0.8 |
| United Kingdom | 1.9 | 39.8 | 16.6 | 52 | 62.1 | 0.6 |
| United States | 2.1 | 37.1 | 13.1 | 49 | 312.2 | 0.9 |
| WORLD | 2.5 | 28.5 | 7.7 | 52 | 6,916.2 | 1.2 |
(a) Total dependency ratio is the ratio of population aged 0–14 and 65+ per 100 population aged 15–64.
Source: United Nations, Population Division, 2012 Revision.
Australia's population, although ageing, is neither as aged nor ageing as fast as some other countries. Japan's median age is almost 45 years and many European countries have a median age in the forties. By contrast Australia's median age is 36.8. The proportion of the Australian population aged 65 years and over is smaller than many OECD countries, including Canada, France, Germany, Italy, Japan and the United Kingdom. On the other hand Australia has a much larger proportion of its population aged 65 years and above than China, India and Indonesia.
Japan and a number of European countries have experienced either very low population growth (for example Greece and Poland) or negative population growth (for example Germany and Hungary). This has been the result of a combination of low fertility rates and very low migration. According to the UN population projections, Japan's population is projected to decline to 105 million by 2055, and then to 84.5 million by 2100.
Migration
Net overseas migration is the net gain or loss of population through immigration to Australia and emigration from Australia. For the central scenario presented in this report, net overseas migration is assumed to be 215,000 per annum from 2018–19, consistent with the assumption used in the 2014–15 Mid–Year Economic and Fiscal Outlook (MYEFO).
Net overseas migration has varied substantially over recent decades. During the decade to 2005, it averaged around 105,000 per annum. Over the period since 2005, net overseas migration was much more rapid, averaging around 220,000 per annum, and reaching a peak of 300,000 in 2008–09.
Consistent with this, there has been significant variation in the levels of net overseas migration underpinning population projections across the series of intergenerational reports. In the 2002 report, the long–term net overseas migration assumption was 90,000 persons per annum. In the 2007 report, the assumption was 110,000 persons per annum, and in the 2010 report, the assumption was 180,000 persons per annum.
Variation in net migration outcomes reflects changes in both out–migration, influenced by economic circumstances domestically and overseas, and in government policy regarding immigration into Australia. Australia's permanent migration intake is determined by government policy (including the mix between skilled and family reunion places) and is subject to review each year as part of the Budget process to reflect evolving economic and social circumstances.
As such, actual population outcomes over coming decades will depend upon the future immigration policy settings of successive governments, as well as Australia's relative economic performance. By way of illustration, if net overseas migration were instead to av
erage 180,000 per annum over coming decades, the projected population in 2054–55 would be 37.9 million, while an average net overseas migration of 140,000 per annum would see a projected population of 35.7 million in 40 years' time. Lower levels of net overseas migration would lead to lower population growth rates over time and, therefore, lower economic growth.
Historically, immigration has been an important source of labour supply for Australia. Since at least the 1980s, immigration has made the largest contribution to growth in Australia's working age population (aged 15 years and over).
As permanent migration has increased since the mid–1990s greater emphasis has been placed on skilled migration and the choice of skills has been made largely demand–driven by employers, supporting economic growth.
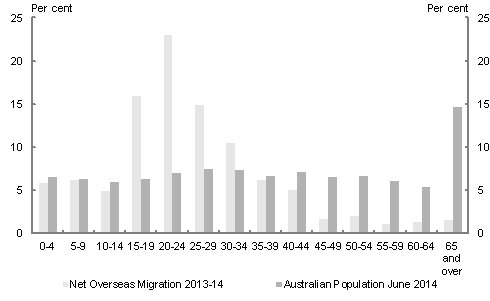
Migration also has an impact on the age distribution of the population. Migrants, on average, are younger than the resident population. Migration reduces the average age of the population and slows the rate of population ageing. This increases the proportion of the population that are of working age and raises aggregate workforce participation, increasing economic growth. This trend has been relatively stable over time.
In 2013–14, around 88 per cent of migrants were aged under 40 years (Chart 1.4). In comparison, at 30 June 2014, around 54 per cent of the resident Australian population was aged under 40. Around 54 per cent of migrants were aged from 15 to 29 years. The share of the resident Australian population aged from 15 to 29 years at 30 June 2014 was 21 per cent.
Chart 1.4 Age distribution of Australia's population and migrants
Source: ABS cat. no. 3101.0 and 3412.0.
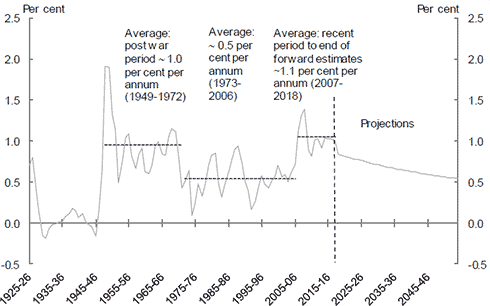
Under the central scenario, net overseas migration is projected to fall as a percentage of the resident population over the next 40 years, to just over 0.5 per cent per annum, which would bring it back in line with the average of 0.5 per cent observed between 1973 and 2006 (Chart 1.5).
Chart 1.5 Net overseas migration as a percentage of the population
Source: ABS cat. no. 3105.0.65.001, 3101.0 and Treasury projections.
1.1.3 Population structure
Consistent with previous reports, the structure of Australia's population is projected to change significantly over the next 40 years. By mid–century, a greater proportion of the population will be aged 65 and over and a significantly smaller proportion of the population will be of traditional working age, that is, 15 to 64 years (Table 1.3).
| Age range | 1974-75 | 2014-15 | 2024-25 | 2034-35 | 2044-45 | 2054-55 |
|---|---|---|---|---|---|---|
| 0-14 | 3.8 | 4.5 | 5.3 | 5.9 | 6.3 | 6.9 |
| 15-64 | 8.9 | 15.8 | 17.8 | 19.9 | 22.1 | 23.8 |
| 65-84 | 1.1 | 3.1 | 4.3 | 5.2 | 5.9 | 7.0 |
| 85 and over | 0.1 | 0.5 | 0.6 | 1.0 | 1.5 | 1.9 |
| Total | 13.9 | 23.9 | 28.0 | 32.0 | 35.8 | 39.7 |
| Percentage of total population | ||||||
| 0-14 | 27.5 | 18.8 | 19.0 | 18.3 | 17.6 | 17.5 |
| 15-64 | 63.8 | 66.2 | 63.6 | 62.1 | 61.6 | 60.0 |
| 65-84 | 8.1 | 13.0 | 15.2 | 16.3 | 16.6 | 17.7 |
| 85 and over | 0.6 | 2.0 | 2.2 | 3.2 | 4.2 | 4.9 |
Source: ABS cat. no. 3105.0.65.001 and Treasury projections.
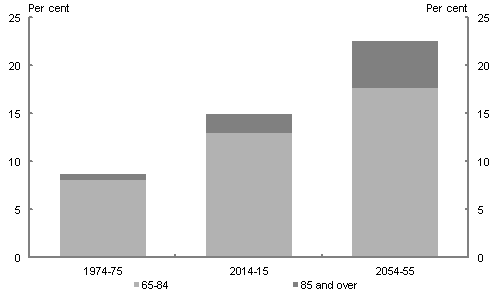
By 2054–55, the number of people aged 65 to 84 will have increased substantially. By 2054–55 there are projected to be 7.0 million Australians aged 65 to 84, compared with around 3.1 million in 2015. This would represent just under 18 per cent of the total population, compared with 13 per cent in 2014–15. In 1974–75, around 1.2 million persons were aged over 65, or around 9 per cent of the population.
Both the number and proportion of Australians aged 85 and over is projected to grow rapidly (Chart 1.6). In 1974–75, this group represented less than 1 per cent of the population — around 80,000 persons. In 2015, around 500,000 persons, or 2 per cent of the population, are projected to be aged 85 and over. By 2054–55, this group is projected to be around 2 million persons, or around 5 per cent of the population.
Chart 1.6 Proportion of population aged 65 and over
Source: ABS cat. no. 3105.0.65.001, 3101.0 and Treasury projections.
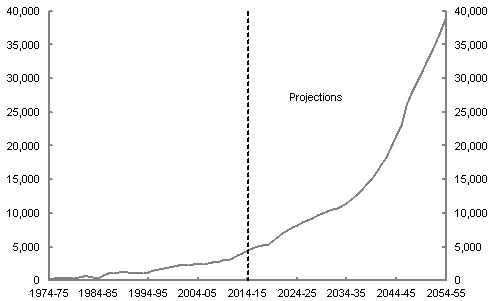
Finally, the projections suggest there will be around 40,000 centenarians in 2054–55 (Chart 1.7). This would be almost nine times the number expected in 2014–15, and well over three hundred times the 120 or so centenarians alive in 1974–75.
Chart 1.7 Number of centenarians
Source: ABS cat. no. 3105.0.65.001, 3101.0 and Treasury projections.
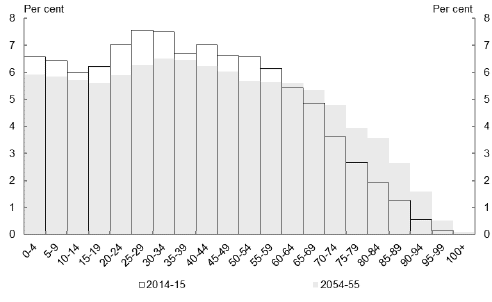
Charts 1.8 and 1.9 illustrate the changing structure of Australia's population. In particular, it shows how the percentage of the
population aged in their younger years will fall and the proportion of the population aged in their later years will increase markedly.
Chart 1.8 Proportion of the Australian population in different age groups in 2014–15 and 2054–55 as a percentage of the total population
Source: Treasury projections.
Chart 1.9 Number of people aged from 15 to 64 relative to the number of people aged 65 and over
Source: ABS cat. no. 3105.0.65.001, 3101.0 and Treasury projections.
1.1.5 Uncertainty in population projections
| Central case | Fertility | Life Expectancy | |||
|---|---|---|---|---|---|
| Low | High | Lower | Higher | ||
| TFR 1.7 births per woman | TFR 2.1 births per woman | ABS Medium assumption | ABS High assumption | ||
| Proportion of population aged 65 and over (per cent of population) | |||||
| As at June 2055 | 22.5 | 23.6 | 21.6 | 21.4 | 23.5 |
| Change from central case | - | 1.0 | -1.0 | -1.1 | 0.9 |
| Median age of population (years) | |||||
| As at June 2055 | 40.4 | 42.2 | 38.6 | 39.7 | 40.9 |
| Change from central case | - | 1.7 | -1.8 | -0.7 | 0.5 |
Note: Life expectancy sensitivity analysis based on medium and high mortality assumptions from ABS population projections (ABS cat. no. 3220.0). The ABS uses two mortality assumptions which it terms ‘high life expectancy' and ‘medium life expectancy'. The ‘higher life expectancy' case assumes continued improvement in life expectancy, while the ‘lower life expectancy' case assumes declining improvement. The ABS uses the ‘medium' assumption for its low population scenario. TFR = Total Fertility Rate.
Sources: Treasury projections.
There is inevitable uncertainty around the assumptions used to produce these projections. Several scenarios are presented to illustrate the effects that adopting different assumptions would have on the projections. The results are presented in Table 1.4 and show population projections for scenarios of low and high fertility, and low and high life expectancy. The alternative projections show that the ageing of the population is a future that Australia cannot avoid given any reasonable set of assumptions about future fertility, life expectancy and migration trends.
1.2 Participation
1.2.2 Participation and future economic growth
The number of people who are able and choose to seek work, how many of them can get jobs when they do seek work and the average number of hours worked by individuals who have jobs are important influences on growth in GDP. Over the next 40 years, the proportion of the population participating in the labour force is expected to decline as a result of population ageing. This declining participation rate is projected to detract slightly from real GDP growth per person over this period. Encouraging and valuing greater workforce participation, in particular amongst older age groups, presents an opportunity to further lift GDP growth per person.
Overall, participation for all people aged 15 years and over is projected to fall from 64.6 per cent in 2014–15 to 62.4 per cent in 2054–55 (Chart 1.10). This figure masks a number of underlying trends in participation rates.
Chart 1.10 Historical and projected participation rates
Source: ABS cat. no. 6291.0.55.001 and Treasury projections.
Labour force participation rates are affected by changes in the age distribution of the population and changes in participation rates within each age group. Factors affecting each age group's participation in the labour force, such as educational attainment, also play an important role in changes to overall participation rates.
The changing age structure of the population will result in overall participation falling (Table 1.5). This is because there will be fewer people in the age groups where participation is highest (the ages from 15 to 64) and more people in the age groups where participation begins to decline (people aged over 65).
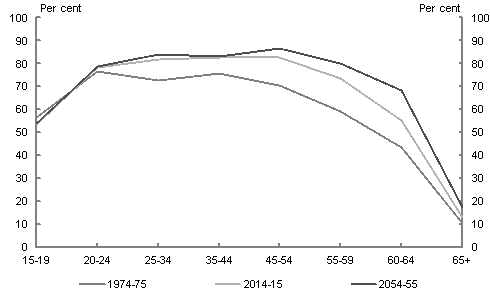
However, participation rates for every male and female age cohort are expected to continue to increase or stabilise. Chart 1.11 shows the participation rates for different age groups and how they have increased from 1975 to 2015 and how they are projected to increase to 2055. The most significant increases are expected for 60–64 and 65–69 year olds.2
Female employment is projected to continue to increase, following on from strong growth over the past 40 years. In 1975, only 46 per cent of women aged 15 to 64 had a job. Today around 66 per cent of women aged 15 to 64 are employed. By 2055, this is projected to increase to around 70 per cent of women aged 15 to 64.
Based on current trends, female labour force participation rates for most age groups are projected to continue to increase, but at a slower rate, and stabilise in the long run.
Chart 1.11 Participation rates in 1975, 2015 and 2055 by age group
Source: ABS cat. no. 6291
.0.55.001 and Treasury projections.
| 2014-15 | 2024-25 | 2034-35 | 2044-45 | 2054-55 | |
|---|---|---|---|---|---|
| 15-24 | 66.6 | 66.7 | 66.6 | 66.9 | 66.9 |
| 25-54 | 82.3 | 83.7 | 84.2 | 84.5 | 84.7 |
| 15-64 | 76.2 | 78.2 | 78.8 | 79.1 | 79.3 |
| 15+ | 64.6 | 64.9 | 64.0 | 63.4 | 62.4 |
| 65+ | 12.9 | 15.9 | 16.9 | 16.7 | 17.3 |
Note: Appendix D contains further details of the participation rate projections by age and gender.
Source: Treasury projections.
With the exception of those aged 15 to 19, the total age specific participation rates (full–time and part–time employment combined) are higher for men than for women. This is projected to continue. Of those aged 25 to 54, around 90 per cent of men, compared to around 76 per cent of women, participated in the labour force in 2013–14.
Changes to the age at which people become eligible for the Age Pension have affected the total participation rate. Between 1995 and 2013, the Age Pension eligibility age for women was brought into line with that for men, rising from 60 to 65 years. From July 2017 the eligibility age for the Age Pension will rise from 65 reaching 67 from 1 July 2023. The Government's policy is to continue the increase in the Age Pension age to reach 70 years by 1 July 2035.
The change in the Age Pension eligibility age from 65 to 70 years is estimated to add around 0.8 percentage points to the total participation rate in 2054–55, bringing it to 62.4 per cent, compared with 61.6 per cent without the changes.
1.2.3 Trends in participation
The trend of overall declining participation, expected in decades to come, is in contrast to the experience over the past 40 years. During this period there was a significant increase in the proportion of people that participated in the labour force. This contributed around 0.2 percentage points to annual economic growth over the period.
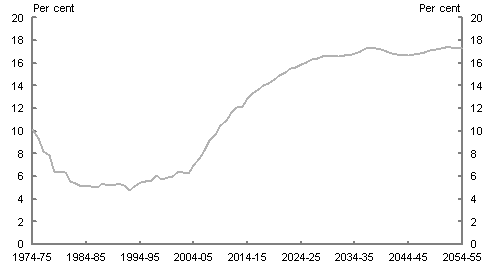
Chart 1.12 Participation rates of people aged 65 years and over
Source: ABS cat. no. 6291.0.55.001 and Treasury projections.
Previous years' gains in participation rates were driven by increases in participation by women and older people (Chart 1.12).
The increase in female participation rates resulted from increased levels of education, changing social attitudes towards gender roles, declining fertility rates, better access to childcare services and more flexible working arrangements.
Older people have been able to extend their labour force participation as a result of the improvements that have led to longer life expectancy, the rise of less physically demanding work and new technologies. Between 1978–79 and 2013–14, the participation of people aged 55 to 64 increased from 45.6 per cent to 63.8 per cent.
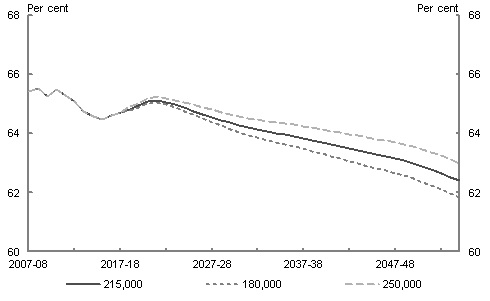
Participation rates also increase as the level of net overseas migration increases (Chart 1.13). Migrants tend to be younger, on average, than the resident population, and therefore increase overall labour force participation rates. While there is some evidence that migrants participate in the labour force more than the Australian average for their age and gender, the projections have not taken this effect into account.
Chart 1.13 Participation rates by net overseas migration assumptions
Source: ABS cat. no. 6291.0.55.001 and Treasury projections.
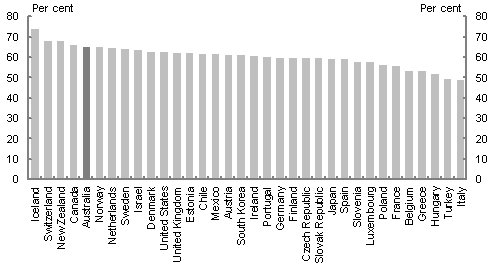
In 2013, Australia's participation rate for people aged 15 and over was fifth highest in the OECD (Chart 1.14).
Chart 1.14 Participation rates of OECD countries 2013, people aged 15 and over
Source: World Bank.
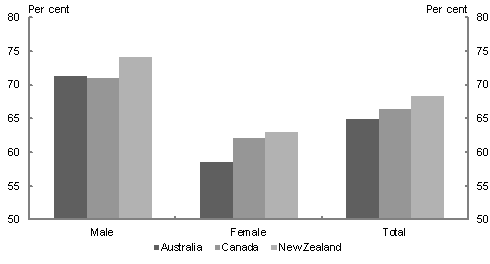
The experience of Iceland, Switzerland, New Zealand, and Canada, all with higher participation rates, demonstrates that further gains can be made, particularly in the female participation rate. Australia's female participation rate is around 4 percentage points lower than that in New Zealand and Canada (Chart 1.15). If Australia's female participation rate reached that of Canada, the Grattan Institute estimate that Australia's GDP would be a permanent $25 billion higher.
Chart 1.15 International comparison of participation rates, 2013
Source: International Labour Organisation.
Participation rates in other countries reflect their specific circumstances, for example, the interaction of the tax and transfer systems, availability of childcare, and policies on parental leave. Nonetheless, policy settings that seek to remove barriers to participation of females and older age groups in Australia and encourage them to work, if they wish to do so, can drive gains in GDP and income growth.
These policy settings include availability of childcare, flexible working arrangements, and removal of discrimination. Policies seeking to remove barriers or support participation for other groups where this has been challenging, for example, young unemployed people and people with disability, would also be expected to generate gains in GDP and income growth.
1.2.4 Hours worked
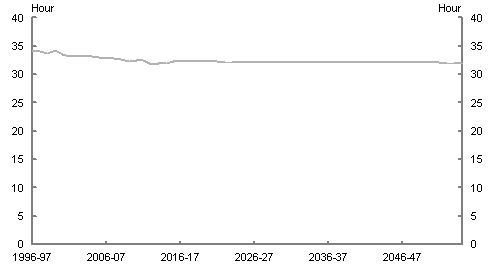
In addition to the participation rate, the average number of hours worked also has a significant impact on economic outcomes. Over the past three decades, the average number of hours worked per week has decreased, due partly to an increase in the number of people working part–time, reflecting the increase in female and older workers, who particularly benef
it from a flexible workplace environment.
The average number of hours worked is projected to fall slightly over the next 40 years. Population ageing is expected to be the main driver of the decline in average hours worked. Historically, those in older age groups have worked for fewer hours per week, on average, than those in younger age groups. This is expected to continue. Changes in the Age Pension eligibility age are projected to have a minimal impact on the average hours worked as the effects of a higher proportion of older workers on part–time hours are taken into account (Chart 1.16).
Chart 1.16 Historical and projected average hours worked
Source: ABS cat. no. 6202.0 and Treasury projections.
1.2.5 Unemployment
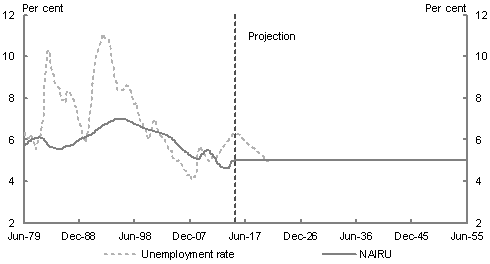
Projections in this report use an assumption of a constant rate of unemployment of around 5 per cent over the projection period.
While employment growth depends on the dynamics of the labour force and the wider economy, the assumption of 5 per cent unemployment is based on estimates of the Non–Accelerating Inflation Rate of Unemployment (NAIRU). The NAIRU is the lowest sustained unemployment rate that does not cause inflation to increase.
The NAIRU varies over time, driven by a complex range of economic, demographic and institutional factors, including the way inflation expectations are formed, the wage–setting environment, labour mobility, and the education and skills of people in the labour force. The NAIRU cannot be measured directly and is typically estimated using economic models (Chart 1.17). There is a wide range of uncertainty around estimates for the NAIRU, of the order of ½ to 1 percentage point.
Under the projections methodology, the unemployment rate returns to 5 per cent. This does not imply that difficulties faced by certain cohorts of the labour force, such as youth, will disappear. After falling to a record low of 7.6 per cent in August 2008, the rate of youth unemployment sits at 14.2 per cent as of January 2015. Ensuring that more young people are able to find employment when they leave education and training will be important to avoid entrenching disadvantage over the longer term.
As a result of the constant unemployment assumption, employment growth from 2020–21 onwards (where the economy is projected to return to full employment) reflects growth in the labour force. Prior to 2025 the unemployment rate assumed is consistent with the 2014–15 MYEFO economic forecasts and projections. Labour force growth, and therefore employment growth, is projected to slow over the remainder of the projection period, associated with a falling total participation rate and slower growth in the working age population.
Source: ABS cat. no. 6202.0 and Treasury projections
1.3 Productivity
1.3.1 Productivity and future economic growth
Australians have high living standards which have been boosted by rapid growth in incomes over the past two decades. This increased wealth over the past 40 years has increased incomes across the community. Average annual income growth increased from 1.7 per cent in the 1980s to 2.2 per cent in the 1990s and to 2.3 per cent through the 2000s to 2013. This has seen average income levels rise from around $40,500 (in today's dollars) in the early 1990s to around $66,400 today. Income is one of the most important determinants of living standards. Increasing real incomes give people the capacity to buy more goods and services, save and invest, as well as more freedom to choose how to spend their time. Higher income generates more tax revenue for government services and income support.
Labour productivity is a measure of how much is produced, on average, for every hour that is worked. On this measure, Australians today produce twice as many goods and services per hour of work than they did in the early 1970s. Labour productivity can be thought of as having two components: capital deepening, and multifactor productivity. Capital deepening reflects the increases in the ration of capital to labour, and allows more to be produced in each hour worked.
Multifactor productivity measures the efficiency with which the key inputs of labour and capital are used to produce goods and services. Many factors can influence changes in measured multifactor productivity, particularly over shorter periods of time, including educational attainment, the extent and type of regulation, levels of competition and other incentives for businesses to operate efficiently, business and economic cycles, economies of scale, and weather patterns.
Productivity has consistently been the most significant driver of income growth. Growth in productivity enables more or better goods and services to be produced with the same, or fewer resources, which can result in higher profits and wages, and lower prices for consumers.
The measure of productivity used throughout this report is labour productivity, consistent with the framework for constructing projections of long–term real GDP based on population, participation and productivity.
This report shows that, given the expected changes in the age structure of the population and the projected gradual decline in the participation rate, productivity will play an even more critical role as a driver of income growth into the future.
1.3.2 Productivity growth
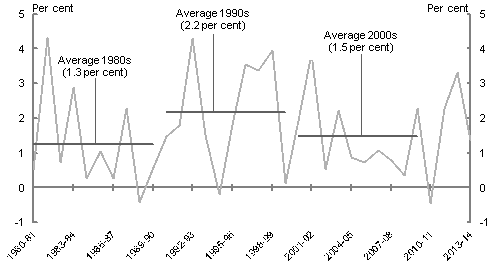
Productivity growth over the next 40 years is assumed to be 1.5 per cent per annum in the projections in this report. This is the same growth rate as the 30–year average assumption used in the 2014–15 Budget and MYEFO. Labour productivity growth averaged 1.3 per cent in the 1980s, increased to 2.2 per cent in the 1990s, and was 1.5 per cent in the 2000s (Chart 1.18).
Chart 1.18 Labour productivity growth
Source: ABS cat. no. 5206.0.
The increase in productivity growth rates seen in the 1990s is widely attributed to significant policy reforms of that decade and the 1980s. These included removing industry protections and opening up the economy to overseas trade, reducing controls over labour, capital and product markets, reforms to improve the efficiency of markets providing essential services, such as electricity, and taxation reforms. Reforms to macroeconomic policy settings included letting market forces determine the exchange rate, introducing the independent setting of interest rates and placing fiscal policy in a medium–term framework.
These reforms created more competitive and productive markets, in which businesses became more efficient and more inn
ovative. The reforms also encouraged businesses to adopt and exploit new and improved technologies developed overseas, including those embedded in new capital, such as information and communications technologies. The reforms engendered greater flexibility in the use of resources and allowed relative prices of goods and services to reflect the balance of supply and demand more accurately, improving overall resource allocation and returns on investments in both physical and human capital. Continued exploitation of new technologies and policy settings conducive to their adoption, will be vital to Australia's future productivity performance.
Since 1970, more Australians have been completing higher levels of education, which has also contributed to growth. In 1970, a third of boys were undertaking their Year 12 High School Certificate or equivalent.3 By 2011, that stands at almost 75 per cent.4 In 1970, 25 per cent of girls were undertaking their Year 12 High School Certificate or equivalent. By 2011, that stands at over 80 per cent.
The slowdown in productivity growth between the 1990s and the 2000s has partly reflected the very high investment activity in the resources and utilities sectors and the slowing of growth internationally and in Australia since the Global Financial Crisis. Productivity growth often slows during a significant investment phase as there are long lead times before increased output is achieved. That is, in the early investment phase, there will be a high level of capital input, but it will be associated with very little increased output, leading to a fall in measured productivity.
Nonetheless, these factors do not explain fully the breadth and magnitude of the slowdown in Australia's productivity growth rates since the 1990s. This has been observed in the majority of industries, suggesting that more fundamental factors are at play. Part of the slowdown may reflect the fading impact of past reforms. There have been fewer significant policy reforms since the early 2000s. Strong income growth, low unemployment and high rates of profitability through the 2000s may have significantly lowered the pressure on governments to undertake the necessary productivity enhancing reforms and reduced the incentive for businesses to become more competitive during this period.
There is also evidence that policy requirements have constrained how inputs are used in some sectors and increased regulatory burdens, thereby detracting from measured productivity growth. For example, some new environmental, water and electricity service standards have required many utilities service providers to invest in higher cost production technologies, which, while potentially enhancing the quality of service, reduce measured productivity.
There is little evidence that slower productivity growth has been the result of inadequate investment in skills, education and innovation more broadly. Australia has not been alone among advanced economies in experiencing slower productivity growth over the 2000s, which suggests that the rate of growth in technological advance — which expands production possibilities — may have been slower than in previous decades.
There is some evidence that high levels of net overseas migration might increase productivity, as the skills focus of Australia's migration program means that migrants may, on average, be better educated than the average Australian. Migrants can also be highly motivated, owing to their decision to move to Australia.
1.4 Long–term economic projections
1.4.1 Economic projections
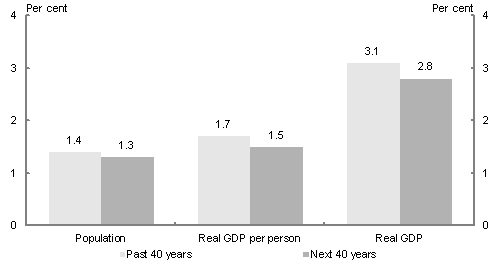
The projections for economic and income growth over the next 40 years have a significant bearing on the fiscal projections. Economic growth is projected to slow over the next 40 years (Chart 1.19). The average annual growth of real GDP is projected to be 2.8 per cent over the next 40 years, compared to 3.1 per cent experienced over the past 40 years. The average annual growth of real GDP per person is projected to be 1.5 per cent over the next 40 years, compared to 1.7 per cent over the past 40 years.
Chart 1.19 Average annual growth of real GDP and real GDP per person
Source: ABS cat. no. 5206.0 and Treasury projections.
Income growth is projected to slow over the next 40 years. Income is measured by real gross national income (GNI). Real GNI is the value of goods and services produced by Australians (either in Australia or overseas), adjusted for changes in purchasing power due to changing trade prices. In other words, real GNI measures changes in what Australians can buy with their income.
The average annual growth rate of real GNI per person is projected to be 1.4 per cent over the next 40 years, compared to the 1.9 per cent experienced over the past 40 years. This would see real GNI per person increase from $66,400 in 2014–15 to $117,300 in 2054–55. This increased wealth over the past 40 years has increased incomes across the community.
The long–term economic projections take current economic conditions and economic forecasts as a base — these are the same parameters as those used in the 2014–15 MYEFO. Over the longer term, trend growth rates are used to develop projections. Trend growth rates are a function of the factors that underpin economic growth — population, participation and productivity.
To 2015, Australia has experienced a record 23 years of uninterrupted economic growth. If history is any guide, the economy will continue to go through business cycles or economic shocks over the next 40 years, which could have significant impacts on growth. However, the outlook to 2054–55 will be driven not by these cycles, but by the underlying trends in population, participation and productivity.
The prospect of business cycles or economic shocks over the next 40 years highlights the importance of achieving fiscal sustainability and positioning Australia's economy to offset the effects of potential downturns. Further discussion is at Box 1.4.
It is also important to keep in mind that the long–term projections look through business cycles and assume a smooth growth path through to 2054–55. The timing, length and magnitude of potential economic downturns are very difficult to forecast. The economic growth projections need to be understood as an average growth projection through to 2054–55, and not as a forecast of uninterrupted growth.
1.4.2 Economic growth and income projections
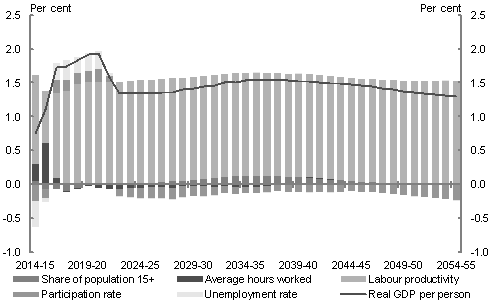
The contribution of population, participation and productivity to annual real GDP growth per person is shown in Chart 1.20. Economic growth rates are expected to decline gradually over the long run. This decline is expected to be caused by a slowing in population growth and a decline in the trend workforce participation rate as a result of population ageing.
Chart 1.20 Population, productivity and participation combine to produce GDP per person
Source: ABS cat. no. 5206.0, 3105.0.65.001, 6202.0 and Treasury projections.
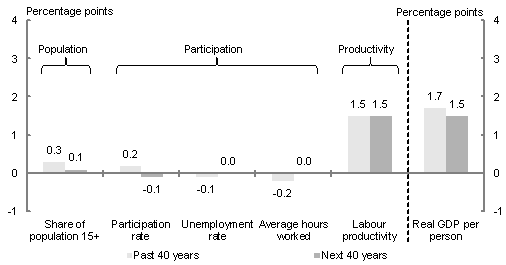
Chart 1.21 identifies the drivers of GDP growth per person over the next 40 years. Labour productivity is expected to be the main driver of real GDP growth, with a smaller contribution coming from compositional changes in population. Falling overall participation rates are expected to reduce GDP growth.
Over the past 40 years, population factors have contributed to per person economic growth, with the growth in the working age share of the population lifting per person growth by 0.3 percentage points per annum. The increase in the participation rate, particularly the participation rate of women, lifted growth by 0.2 percentage points per annum, but this was offset by an increase in the unemployment rate and falling average hours worked. All together, the population and participation factors increased economic growth by 0.2 percentage points per annum. Productivity growth was the largest contributor to per person growth.
Over the next 40 years the increase in the working age share of the population will increase by less than over the previous 40 years, but will still contribute slightly to per person growth. The participation rate is expected to fall, mainly as a result of ageing of the population. The unemployment rate and average hours worked are expected to remain broadly constant, and hence not contribute or detract from growth. Productivity growth is expected still to be the largest contributor to per person growth.
Chart 1.21 Components of growth in real GDP per person
Source: ABS cat. no. 5206.0, 6202.0 and Treasury projections.
Nominal GDP, prices and wages
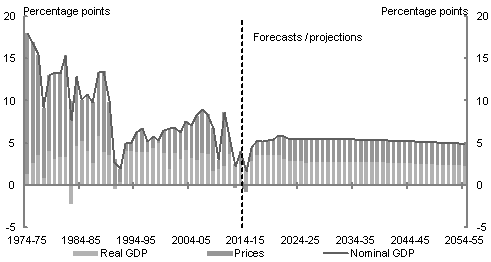
Nominal GDP is the value of the economy's output. Growth in nominal GDP reflects growth in both the quantity and price of output. Projections of nominal GDP growth therefore depend on assumptions regarding real GDP growth and growth in prices. Nominal GDP is the primary determinant of taxation revenue.
Nominal GDP is projected to grow at an average of around 5¼ per cent a year over the projection period, unchanged from the 2010 report (Chart 1.22).
Consistent with assumptions in the 2014–15 MYEFO, Australia's terms of trade are expected to return to the level observed in 2005–06 by 2019–20 and remain at that level over the projection period.
Over the long–run, domestic prices are projected to grow by 2½ per cent a year, consistent with the Reserve Bank of Australia's medium–term inflation target. Wages are projected to grow at around 4 per cent, consistent with domestic inflation and productivity growth of 1.5 per cent.
Chart 1.22 Nominal GDP growth projections
Source: ABS cat. no. 5206 and Treasury projections.
Income growth
Income growth is likely to slow considerably over the next 40 years.
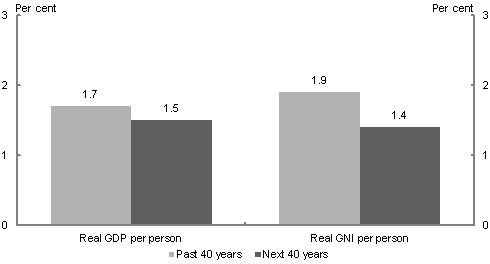
The average annual growth rate of real GNI per person is projected to be 1.4 per cent over the next 40 years, which would see real GNI per person increase from $66,400 in 2014–15 to $117,300 in 2054–55. This compares to the average annual growth rate of 1.9 per cent of the past 40 years. This means that the projected change in the average annual growth of real GNI per person over the projection period is likely to be greater than the change in average annual growth in real GDP per person (Chart 1.23).
Chart 1.23 Average annual growth rates for real GDP and GNI projections
Source: ABS cat no. 5206 and Treasury projections.
These projections take into account the decline in the terms of trade since their peak in 2011. As a result, the increase in average incomes projected over the period from 2014 to 2025 is expected to be slower than experienced over the past decade. Beyond 2024–25, it is assumed that the terms of trade no longer detract from growth, resulting in a projected improvement in real GNI per person growth. The ageing of the population slows GNI growth through its effect on workforce participation.
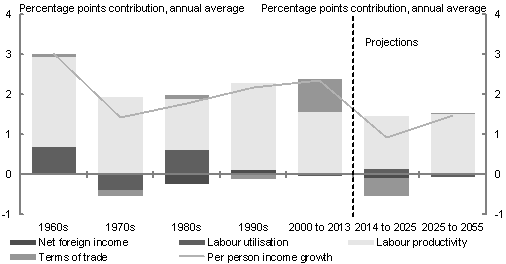
Growth in real GNI per person is driven by growth in labour productivity (how much is produced for each hour worked), labour utilisation (how many hours an average person works), net foreign income receivable from abroad and the terms of trade. Income growth over the past five decades as well as projections for the medium and long term, broken down by source, are shown in Chart 1.24.
Chart 1.24 Sources of growth in real national income per person
Source: ABS cat. no. 5206.0 and Treasury projections.
Productivity growth has been the main driver of growth in real average incomes over t
he past 50 years and is assumed to remain so in the future.
In the 1980s, growth in real GNI per person was supported by a significant contribution from labour utilisation, reflecting an increase in the proportion of the population being of working age and increases in workforce participation. The 1990s saw strong growth in labour productivity, which offset a small negative impact of the terms of trade.
Over the past decade, and despite a broad–based slowdown in productivity growth, income growth increased due to unprecedented growth in the terms of trade as a result of the resources boom.
As has been widely analysed and discussed, over the next decade or so, the fall in the terms of trade is projected to reduce growth in GNI, with growth for the majority of the next 40 years driven by productivity growth.
1.4.3 Uncertainty in economic projections
The results presented in this report are one demonstration of many potential outcomes. To demonstrate the effects of the uncertainty of the economic projections, alternate projections based on different assumptions and parameters have also been prepared. The results are presented in Table 1.6 and show real GDP and real GNI per person projections under high and low productivity and participation assumptions.
| Central case | High productivity | Low productivity | High participation | Low participation | |
|---|---|---|---|---|---|
| Changed assumption | 1.6 | 1.4 | 1.5 per cent higher | 1.5 per cent lower | |
| Projected real GDP level | |||||
| Change from central scenario (per cent) | 3.7 | -3.7 | 1.5 | -1.5 | |
| Projected real GNI per capita | |||||
| As at 2055 | $117,300 | $121,900 | $113,000 | $119,200 | $115,500 |
| Change from central scenario base case | $4,500 | -$4,300 | $1,800 | -$1,800 |
Source: Treasury projections.
The sensitivity analysis in Appendix B provides more results for reasonable alternative assumptions to the central case presented in this report.
Box 1.4: What happens if there is an economic shock?
Long–term economic projections present one possible outcome based on a set of well–informed projections and assumptions about future changes in Australia's population, workforce participation and productivity.
Australia's current long–run average growth rate includes the period of strong productivity growth following the reforms of the 1980s and 1990s. We should not take for granted that this experience will be repeated, particularly in the absence of a reinvigorated structural reform effort.
If history is any guide, it is almost certain that any economy will experience business cycles and shocks over a 40 year time horizon.
When downturns strike the first sign is flagging demand and weakening sales. Capacity utilisation falls as businesses produce less, employ fewer people and delay investment plans. This produces downward pressure on prices and wages growth. Governments tend to collect less in taxes and pay out more in benefits (the so called automatic stabiliser effects), and the result is a deterioration in the budget balance. As the budget position is weaker, and this is typically sustained over several years, this flows through to higher debt levels.
While the economy will recover to its trend real GDP path and full employment over the long run, the pre–downturn trajectory of nominal GDP may never be fully attained if there are long–lasting impacts on domestic prices. There may also be long–lasting changes to the budget position, in particular the level of debt.
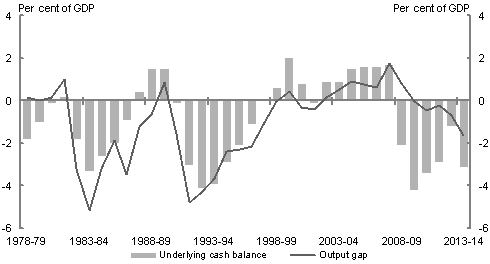
Chart 1.25 highlights the persistent and significant impacts that the recessions of the 1980s and 1990s had on Government budgets. In the early 1990s the underlying cash balance moved from a surplus of 1.5 per cent of GDP to a deficit of 4.1 per cent of GDP. Net debt rose from 4.0 per cent of GDP to a peak of 18.1 per cent of GDP. As the chart highlights, deterioration in the deficit due to a recession tends to be swift, while repair of the budget is more protracted and requires sustained spending discipline.
Chart 1.25 Underlying cash balance and output gap
Source: ABS Cat. No. 5206.0 and Treasury
1.5 Managing the environment
There are many pressures affecting our environment, particularly water and land resources, which may impact the environmental endowment that we leave future generations. The environmental changes that unfold over the next 40 years will affect Australians' quality of life across a range of dimensions. Over–used, damaged or depleted resources could reduce Australians' well–being and the ability of future generations to rely on the environment for economic activity.
Achieving strong economic growth and strong environmental outcomes are complementary objectives. Policies that create strong economic growth and a sustainable budget will mean that government is better placed to invest in environmental protection. More broadly, domestic and international experience shows that as real per capita incomes rise people are more willing not only to devote more resources to environmental improvement, but actually a growing share of their higher incomes.
Conversely, protecting the environment can also contribute to economic growth, particularly in certain sectors. For example, an improved environment can boost opportunities for tourism, while appropriate and sustainable management of fisheries can enhance the long–term health of the fishing industry.
The Government has structured its environmental management under four key pillars — clean water, clean land, clean air and heritage protection — to improve the quality of Australia's environment for future generations.
Clean water
Water is and will continue to be a vital resource in Australia. Australia is one of the driest continents on earth and has large natural variations in inland water flows. Historically, high levels of water extraction from our rivers have compounded the effects of natural variations in water flows and made water management an increasingly important part of environmental policy.
The pressure on Australia's water resources has been most acutely felt in southern Australia, where measures show that water quality has declined as flow declined. Northern Australian and Tasmanian inland water environments, on the other hand, have faced water pressures because of substantial water extraction in specific areas for hydro–electric power.
With regard to water management policy, significant agreement has been reached to address past over–allocation of water resources. The Murray Darling Basin Plan provides an essential framework for managing water use across the Murray Darling Basin in Queensland, NSW, Victoria, South Australia and the ACT for future generations. The Murray Darling Basin Plan provides greater certainty
to businesses and communities and aims to achieve a balance between economic, environmental and social considerations. For these benefits to be achieved, it will be important that the Murray Darling Basin Plan withstands the test of time, including future droughts.
Future generations will benefit from actions taken now to ensure that our water resources are maintained and well managed. This includes ensuring human activity does not result in damage to, or overuse of, our water systems or harm the productive capacity of our resources.
A significant challenge over coming decades will be the protection of the Great Barrier Reef. The Great Barrier Reef supports nearly 70,000 jobs and is worth $5.6 billion a year to the economy.5 While it remains the best managed marine ecosystem in the world, it is facing threats, including from climate change. A growing population with rising per capita incomes, as well as expanding tourist numbers, will require careful policy management to support economic development in the region whilst minimising the environmental impact. Recent initiatives in this space include ending the disposal of capital dredge material for ports in the marine park: five major projects for disposal in the park have been cut to nil and this has been further backed by regulation to ban future disposal in the marine park.
Water quality in the World Heritage Area is improving as a result of a partnership between farmers and governments to reduce the amount of fertilisers, chemicals and sediments running off farming land. This has seen a 28 per cent reduction in pesticides, 11 per cent reduction in sediment and 16 per cent reduction in dissolved inorganic nitrogen.6 Improved water quality is one of the most effective ways to improve the Reef's resilience, including against climate change.
The Australian Government is committed to making strong decisions in managing the Great Barrier Reef and, along with Queensland, is investing $2 billion for its protection over the next decade.
The Australian and Queensland governments' comprehensive strategic assessment of the Great Barrier Reef World Heritage Area and adjacent coastal zone was the most complex and comprehensive analysis of and blueprint for environmental management arrangements ever undertaken in Australia. The Reef 2050 Long–Term Sustainability Plan builds on that work. The Plan has been developed in partnership with stakeholders including environmental representatives, the tourism industry and the fishing industry.
Clean land
It is important that Australia employs effective land management policies to ensure the preservation and improvement of this essential natural resource.
Australia is a continent of significant land mass with climatic zones which vary considerably. Our land resources are used for a range of purposes including livestock grazing, agriculture, forestry, urban development and nature conservation. Past practices from these various uses have had significant impacts on Australia's land resources. For example, pastoral and agricultural land use has sometimes degraded soil structure and water infiltration, and depleted soils of carbon and nutrients.
Whilst there have been improvements in land management in Australia in recent decades, more can and is being done to ensure that the productive capacity of pastoral and agricultural land is maintained for future generations and that protected areas effectively conserve Australia's unique biodiversity (Box 1.5).
Box 1.5: Biodiversity and land management
A major biodiversity initiative is the Government's appointment of Australia's first Threatened Species Commissioner. The Commissioner is tasked with bringing a national focus to conservation efforts for Australia's endangered native flora and fauna and developing a plan of priority actions to prevent extinctions and halt the decline of Australia's most threatened species. Efforts will be supported by the Government's $30 million investment in a new Threatened Species Recovery research hub, under the National Environmental Science Programme (NESP).
On the land, programs with investments of more than $2 billion are being rolled out to engage individuals and communities in work on the ground, exploiting the local knowledge and commitment of those who know their land best.
A key component is a single National Landcare Programme committed to supporting action in natural resource management. This Programme is based on three important values: simple, local and long–term.
Through the National Landcare Programme the Government funds actions to tackle weed and feral animal threats, restore and link habitat, manage fire regimes and protect wildlife.
Working alongside the National Landcare Programme is the Government's Green Army, which is funded to support environmental improvements each year such as revegetation, weed removal and habitat restoration. The Green Army will be a significant environmental resource to deploy across the country and is already making significant and lasting improvements to our environment.
As Australia's population grows, careful land management planning and strategies will be required to mitigate the risk of biodiversity loss. Greater links between conservation and protected areas, national parks and private lands could provide corridors through which native flora and fauna can travel in response to changing habitats.
Close cooperation between federal, state and local governments will also be essential. The introduction of One Stop Shops for environmental approvals will see the start of a new era of cooperation between states and the Australian Government on environmental regulation. Responsibilities for environmental regulation will be consolidated and roles for respective parties will be clearer. This will help ensure that issues do not fall through gaps between the Australian Government and state systems and that high environmental standards are maintained while delivering a more efficient system which will also provide for enhanced monitoring of environmental outcomes over the longer term.
Clean air
The Government's Clean Air Plan incorporates strategies both to address climate change and to reduce air pollution. The strategies to address climate change are discussed further in Section 1.5.4, below. The second focus of the Government's Clean Air pillar is the objective of achieving a National Clean Air Agreement.
Particulate and ozone pollution continue to be a concern and increasing urbanisation and population growth will only add to these problems.
A National Clean Air Agreement will lay the groundwork for improvements in Australia's air quality and for responding to emerging air quality issues over the coming decades. The Government has secured the agreement of all states and territories to work towards a National Clean Air Agreement by mid–2016.
Heritage protection and Antarctica
Australia is acknowledged internationally as a leader in heritage protection but more can be done to ensure our historic, natural and indigenous heritage is well–managed and conserved for future generations.
Australia has been a leader in the exploration and conservation of Antarctica for more than a century and asserts sovereignty over 42 per cent of the Antarctic continent. To strengthen and support our role in the region over the coming decades, the Government has released an independent 20–Year Australian Antarctic Strategic Plan. This Plan critically assesses Australia's national and environmental interests in Antarctica and the Southern Ocean and makes recommendations on how Australia can remain a leading Antarctic nation.
The Government has already taken several steps to secure our future engagement with Antarctica. These include: budgeting for and undertaking the procurement of a new world&n
dash;class icebreaker, to replace the ‘Aurora Australis', which will serve the country for the next three decades; and investing $87 million in Tasmania under the Government's Economic Growth Plan for Tasmania to build on its status as a leading gateway city to east Antarctica. Specific measures include investing further in science to develop a greater knowledge of the impacts of climate change on Antarctica and the Southern Ocean.
1.5.3 Budgetary implications
The Commonwealth's budget is impacted by the environment and climate. Commonwealth Government spending on environment protection is allocated to protection and conservation of the environment, water and waste management, pollution abatement and environmental research. The budget also has other spending programs and taxation arrangements that are affected by the environment and climate (for example, drought relief programs).
This Intergenerational Report focuses primarily on government expenses that are affected by demographic change. The level of Commonwealth Government spending on the environment is not directly linked with demographic factors. Commonwealth environment programs do not vary automatically with population changes. This differs to other expenses, such as transfer payments, health and aged care, where demographic change more directly affects the level of government spending.
Nevertheless, there are costs associated with changes in the environment and climate. The Government is already making significant investments to mitigate the impact of climate change including the $2.55 billion Emissions Reduction Fund (ERF), along with major investments to support biodiversity and, in particular, the Great Barrier Reef.
1.5.4 Climate change
Australia will meet its Kyoto target for 2020 and will join with the international community to establish post 2020 targets with the aim of reducing global greenhouse gas emissions. The international community has agreed to aim to keep global warming to a less than 2oC increase above pre–industrial climate levels.
The Government has committed to reducing Australia's domestic emissions by 5 per cent below 2000 levels by 2020 through its $2.55 billion ERF.
The ERF will provide incentives for cleaning up Australia's environment through activities such as revegetation, investing in soil carbon, increasing industrial and commercial building energy efficiency, cleaning up power stations and capturing gas from the millions of tonnes of waste deposited in our cities' landfills each year.
This will reduce Australia's emissions through direct investment in projects that improve the environment and increase productivity. By achieving verified domestic emissions reductions through incentives, the ERF will avoid achieving such reductions simply by driving domestic production offshore — a process which would cost Australian jobs for no decrease in global emissions.
The ERF will also achieve other direct environmental and economic benefits, beyond its role in reducing greenhouse gas emissions. For example, improvements in energy efficiency can reduce emissions while boosting productivity for a range of businesses.
The Government will also introduce a safeguards mechanism to complement the ERF. The safeguards mechanism will ensure that emissions reductions paid for by the ERF are not displaced by a significant rise in emissions elsewhere in the economy.
The ERF and safeguards mechanism align with actions being taken internationally (Box 1.6).
Box 1.6: International approaches
There is no one–size–fits–all way to reduce emissions and around the world governments are choosing approaches that best suit their national circumstances, in keeping with the Government's Direct Action approach.
Many of the approaches used in jurisdictions overseas have features in common with the ERF. These include incentive–based measures that reward positive action like baseline and credit schemes, and direct purchasing. Energy efficiency, emissions standards and direct support for investment in better practices and technologies are other approaches. For example:
- Japan is establishing its Joint Crediting Mechanism to help meet emissions reduction targets by purchasing direct emissions reductions and funding low–carbon technology diffusion through bilateral agreements with developing countries.
- In California, about 16 million offset credits have been issued for emissions reductions from projects such as the destruction of ozone depleting substances, under the framework of California's climate change response legislation.
Energy efficiency measures are widely used to reduce greenhouse gas emissions. In the United Kingdom, all new homes built from 2016 will need to have zero emissions for heating, hot water, cooling and lighting. Under the Korean Target Management Scheme, around 500 large emitting entities are required to meet energy efficiency targets. There are energy intensity and efficiency schemes in countries such as China, India, Indonesia, Japan, New Zealand, Thailand, Turkey and the United States. New Zealand has an economy–wide energy intensity improvement target of 1.3 per cent annually to 2016.
Box 1.7: Summary of the state of the climate 2014
Data and analysis released by the Bureau of Meteorology (BOM) and Commonwealth Scientific and Industrial Research Organisation (CSIRO) shows that:
- Australia's climate has warmed by 0.9°C since 1910, and the frequency of extreme weather has changed.
- Rainfall averaged across Australia has slightly increased since 1900, with the largest increases in the northwest since 1970.
- Rainfall has declined since 1970 in the southwest. Autumn and early winter rainfall has mostly been below average in the southeast since 1990.
- Extreme fire weather has increased, and the fire season has lengthened, across large parts of Australia since the 1970s.
- Global mean temperature has risen by 0.85°C from 1880 to 2012.
Average rainfall in southern Australia is projected to decrease and heavy rainfall is projected to increase over most parts of Australia.
Research
Governments must continue to plan for the potential economic and environmental effects of climate change. Some economic effects may be beneficial — where regions become warmer or wetter this may allow for increased agricultural output — while others may be harmful. For example, lower rainfall may reduce crop yields, or transport infrastructure (such as roads, ports and rail networks) may become more susceptible to damage from extreme weather events.
To inform and support action on this issue, the Government has committed $9 million over three years to re–fund the National Climate Change Adaptation Research Facility (NCCARF). NCCARF will provide decision–makers, including state and local governments, with advice and guidance on assessing and responding to the risks associated with climate change. Particular emphasis will be placed on responding to risk in Australia's coastal zone.
Under the new NESP, more than $23 million over six years has also been allocated to an Earth Systems research hub to improve our understanding of how the climate system may change in the future.
This research hub will be led by the CSIRO, in partnership with the BOM and several Australian universities, and will build on the knowledge and expertise developed under the National Climate Change Science Programme.
1.5.5 The way forward
National environmental governance is shared among the three levels of government (Commonwealth, state and local), households, businesses and the community sector. There is a role for the Commonwealth in leading and coordinating environmental policies to drive better environmental management for the generations to come.
In many areas, the Commonwealth is already implementing policies with a long–term objective. Nonetheless, some environmental challenges and opportunities are not defined by state or international borders. These challenges will require cooperation from all levels of Government, business and the community.
1 The replacement rate is the level of fertility where each woman gives birth to enough children to sustain the population at its current level. It is around 2.1 for Australia and other developed countries.
2 A cohort method based on the methodology used by the Productivity Commission has been used to project the participation rates of older people. This changed modelling assumption has resulted in higher projected participation rates for older people than in previous reports.
3 ABS cat. no. 4221.0.
4 ABS cat. no 4102.0.
5 Great Barrier Reef Outlook Report 2014.
6 Great Barrier Reef Report Card 2012 and 2013 — detailed results, Australian and Queensland governments.