Key facts box
- The Australian Government is currently spending over $100 million a day more than it collects, and is borrowing to meet the shortfall.
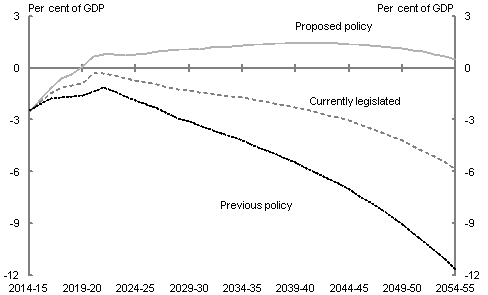
- Under the 'previous policy' scenario, by 2054–55, the underlying cash deficit is projected to have reached 11.7 per cent of gross domestic product (GDP) ($532.8 billion in today's dollars). However, considerable progress has been made under the 'currently legislated' scenario with the underlying cash deficit projected to almost halve to around 6 per cent of GDP ($266.7 billion in today's dollars).
- The 'proposed policy' scenario projects the underlying cash balance to improve further, from a deficit of 2.5 per cent of GDP in 2014–15 to a sustained surplus from 2019–20 to the end of the reporting period.
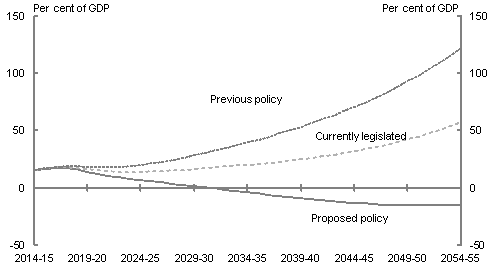
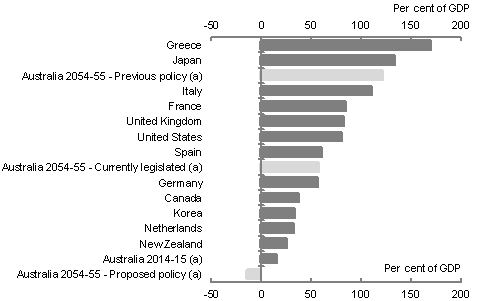
- Under the 'previous policy' scenario by 2054–55, net debt is projected to reach 122 per cent of GDP (or $5,559 billion in today's dollars). The 'currently legislated' scenario projects that net debt would more than halve to 60 per cent of GDP (or $2,609 billion in today's dollars).
- If the 'proposed policy' scenario were to eventuate, net debt would decline from 15.2 per cent of GDP in 2014–15 to be zero by 2031–32 after which the Australian Government is projected to begin accumulating assets utilising projected underlying cash surpluses. This is the first intergenerational report to project that, based on current government policy, Australian taxpayers will not be carrying a significant debt burden.
- The debt levels in both the 'previous policy' and 'currently legislated' scenarios would negatively impact economic growth, waste significant resources on interest payments, and leave Australia exposed in the event of an economic downturn.
- In contrast, the 'proposed policy' scenario would afford scope for future governments to reduce taxes and/or make productivity enhancing investments and improve the resilience of the budget to future economic shocks.
2.1 Projections of the overall budget position
The 2014–15 Mid-Year Economic and Fiscal Outlook (MYEFO) provides the starting point for the fiscal projections contained in this report. It estimates that in 2014–15 the underlying cash deficit will be $40.4 billion (2.5 per cent of GDP) and net debt will reach $245 billion (15.2 per cent of GDP). From this base, this report contains fiscal projections under three key scenarios to illustrate the long–term sustainability of alternative policy settings.
The first scenario, 'previous policy', shows a set of fiscal projections associated with the set of policies in place prior to the 2014–15 Budget. Under this scenario, the underlying cash deficit would reach 11.7 per cent of GDP ($532.8 billion in today's dollars) and net debt would reach almost 122 per cent of GDP ($5,559 billion in today's dollars).
The second scenario, 'currently legislated', shows a set of fiscal projections on the basis of laws currently passed by Parliament, given a range of policies of the current Government remain unimplemented. Under this scenario, the underlying cash balance is projected to remain in deficit, deteriorating to almost 6 per cent of GDP by 2054–55 ($266.7 billion in today's dollars). Net debt is projected to reach almost 60 per cent of GDP ($2,609 billion in today's dollars) by the end of the projection period. The 'currently legislated' scenario shows that the budget position is stronger than it would have been prior to the changes made from the 2014–15 Budget onwards.
The first two scenarios show an unequivocal deterioration in fiscal sustainability. And both of these scenarios assume a further 40 years of unbroken economic growth.
The third scenario, 'proposed policy', shows what would happen if the outstanding unlegislated measures, or alternative measures of equivalent value, are implemented. This scenario follows the usual practice of projecting fiscal aggregates based on the full implementation of the policies of the Government of the day, and the Charter of Budget Honesty Act 1998 requirement that the Intergenerational Report model current government policy. This scenario presents fiscal projections on the basis of announced policy (as taken to the 2014–15 MYEFO), and assumes all outstanding measures are implemented. These measures would make a significant contribution to reducing fiscal pressures over the longer term by addressing the unsustainable rates of growth in expenditure and government debt. Such an improvement increases governments' capacity to respond to the challenges of coming decades, in particular the ageing population and the changing domestic and global economic environment.
This scenario projects the underlying cash balance to improve from a deficit of 2.5 per cent of GDP in 2014–15 to a surplus of 1.4 per cent of GDP in 2039–40, and then moderate to a surplus of around 0.5 per cent of GDP in 2054–55 ($24.3 billion in today's dollars). Net debt is projected to decline from 15.2 per cent of GDP in 2014–15, to around 0 per cent by 2031–32, before declining further to 15 per cent negative net debt in 2054–55 (that is, $691 billion more in assets than debt in today's dollars). This fundamentally stronger budget position would allow the government to provide future tax relief, or make productivity–enhancing investments, rather than accrue substantial financial assets.
2.1.1 Underlying cash balance
The underlying cash balance shows the difference between the cash receipts of the Australian Government and cash expenditure (excluding the net purchases of financial assets).
Chart 2.1 Underlying cash balance
Note: Net Future Fund earnings are included in projections of the underlying cash balance from 2020–21.
Source: Treasury projections. Projections assume trend economic growth from 2021–22 to 2054–55.
Under the 'previous policy' scenario, the projected underlying cash deficit would have reached 11.7 per cent of GDP ($532.8 billion in today's dollars) by the end of the projection period (Chart 2.1).
Under the 'currently legislated' scenario considerable progress has been made to repair the budget. This scenario projects the underlying cash deficit almost halving to 5.8 per cent of GDP in 2054–55 ($266.7 billion in today's dollars).
If no changes were made to payment levels under this scenario, taxes would need to rise to and remain at a sustained level of around 26 per cent of GDP to balance the budget. The previous historic high for tax receipts to GDP was 24.2 per cent of GDP. This level of taxation would significantly reduce the real rewards for effort over time by tax payers — discouraging workforce participation and investment, and depressing economic growth.
Balancing the budget under the 'previous policy' scenario would require taxes to rise even further to a sustained leve
l of around 28 per cent of GDP.
The 'proposed policy' scenario shows the underlying cash deficit is projected to improve significantly over the next decade, and reach a maximum surplus of 1.4 per cent of GDP in 2039–40. By 2054–55, the surplus is projected to be 0.5 per cent of GDP ($24.3 billion in today's dollars). This strong budget position would offer the Government the fiscal space to prudently allow for future tax relief, over and above the relief from the negative impacts of income tax bracket creep on workforce participation already allowed for.7
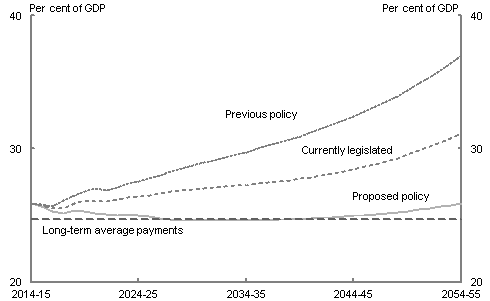
Under the 'previous policy' scenario Australian Government spending is projected to reach 37.0 per cent of GDP in 2054-55 ($1,687 billion in today's dollars) and average 3.6 per cent real annual growth (Chart 2.2).
However, these levels of projected spending have been reduced, and under the 'currently legislated' scenario real spending growth is projected to average 3.1 per cent per annum, leading to Australian Government spending of 31.2 per cent of GDP in 2054–55 ($1,422 billion in today's dollars). In both scenarios, projected spending as a proportion of GDP is dramatically higher than the post–World War II high of 27.6 per cent of GDP.
Under the 'proposed policy' scenario, total spending is projected to reach 25.9 per cent of GDP in 2054–55 ($1,197 billion in today's dollars), broadly similar to current levels, with real spending projected to grow at an average rate of 2.7 per cent per annum.
Chart 2.2 Total Australian Government spending
Notes: The long–term average payments–to–GDP ratio is 24.7 per cent of GDP, calculated over a 40 year period from 1974–75 to 2013–14.
Source: Treasury projections. Projections assume trend economic growth from 2021–22 to 2054–55.
Box 2.1: Fiscal strategy in the medium to long term
The Government's medium-term fiscal strategy is to achieve budget surpluses, on average, over the course of the economic cycle. The fiscal strategy includes a commitment to paying down debt by maintaining strong fiscal discipline during relatively good times. This will provide greater flexibility for supportive fiscal policy, if needed, in the event of an economic downturn.
Projections in this report assume that the economy returns to full employment over the next seven years and then remains at full employment over the remainder of the projection period. These are simplifying assumptions. In reality, Australia's output and employment may not always be equal to its potential. There is more scope for the economy to fall below full capacity for extended periods than to exceed full capacity, implying that risks around the projected fiscal outlook are asymmetric. Given this asymmetry, a responsible approach would be to aim for precautionary surpluses over the cycle. This approach would also mitigate constraints on the use of fiscal policy in a future downturn.
A strong fiscal position is important for mitigating external vulnerabilities, reducing longer term fiscal pressures by reducing interest payments and government debt, and providing some insurance against risks, such as funding risks and contingent liabilities. Australia's reliance on external borrowing increases the importance of maintaining a strong fiscal position, including relative to most other advanced economies. This approach enables flexibility and avoids the unenviable policy choices that arise when access to international credit markets is lost or impaired.
Determining the optimal amount of fiscal flexibility is difficult. Economic cycles do not follow a regular pattern, but depend on exogenous shocks affecting the economy and any build–up of internal imbalances. The impacts of a downturn will also depend on the nature of the policy response and the monetary and fiscal policy mix. Although we cannot predict such events, a prudent approach is to plan for contingencies, informed by experience over previous cycles.
Past experience suggests that economic downturns occur roughly every decade. In considering the likelihood and magnitude of possible deficits it is also relevant that downturns have, in the past, led to cumulative deficits of over 10 per cent of GDP. This would suggest that a responsible approach would be to aim for budget surpluses of around 1 per cent of GDP, on average, over the cycle.
2.1.2 Primary balance
The primary balance is an important measure of fiscal sustainability. The primary balance includes the same expenditure and receipts as the underlying cash balance, but excludes net interest payments and earnings from the Future Fund — that is, balance sheet impacts from prior year surpluses and deficits. In doing so, the primary balance reveals underlying spending pressures in a particular year.
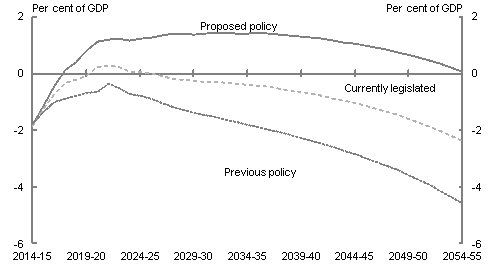
Under the 'previous policy' scenario the primary balance is projected to deteriorate to a deficit of 4.6 per cent of GDP ($209.2 billion in today's dollars) in 2054–55 (Chart 2.3).
Under the 'currently legislated' scenario, the primary balance is projected to improve over the next five years, before returning to deficit around 2026–27 and then continuing to deteriorate, reaching a deficit of 2.4 per cent of GDP ($109.1 billion in today's dollars) at the end of the projection period.
The primary balance is projected to rise to a surplus of 1.4 per cent of GDP in 2035–36 under the 'proposed policy' scenario and then fall gradually to around 0 per cent of GDP by 2054–55. The difference of 0.5 per cent of GDP between the primary and underlying cash balances reflects the exclusion of net interest earnings.
Chart 2.3 Primary cash balance
Note: The projections are of the primary cash balance (which excludes net interest payments and net Future Fund earnings).
Source: Treasury projections. Projections assume trend economic growth from 2021–22 to 2054–55.
2.1.3 Balance sheet
The balance sheet shows how the assets and liabilities of the Australian Government are likely to change over the next 40 years. The balance sheet provides a further assessment of the sustainability of Australian G
overnment finances. A strong fiscal position means that the Government can reduce debt and build up assets over time to meet accumulated liabilities and avoid future spending pressures.
Net debt
Under the 'previous policy' scenario, net debt is projected to reach 122 per cent of GDP in 2054–55. This represents $5,559 billion in today's dollars and is equal to $139,900 per person (Chart 2.4).
The projected level of Australian Government debt is significantly improved under the 'currently legislated' scenario. Net debt is projected to reach 57.2 per cent of GDP in 2054–55 ($2,609 billion in today's dollars) under the 'currently legislated' scenario. Net debt per person is projected to rise from $10,400 in 2014–15 to $65,600 in today's dollars by the end of the projection period.
Note: The projections of net debt include net interest payments.
Source: Treasury projections. Projections assume trend economic growth from 2021–22 to 2054–55.
In contrast to the first two scenarios, net debt is projected to decline from 15.2 per cent of GDP in 2014–15 to around 0 per cent of GDP by 2031–32 under the 'proposed policy' scenario. After this point, net debt improves further, to reach around 15.0 per cent negative net debt in 2054–55 (that is, $691 billion more in assets than debt in today's dollars). Net debt per person is projected to fall from around $10,200 in 2014–15 to be fully paid off in 2031–32, and assets continue to build thereafter to negative net debt of $17,400 in 2054–55 in today's dollars. Rather than continue to build up significant net financial assets, this degree of balance sheet improvement would afford significant scope for future governments to adjust policy to provide tax relief, or make productivity–enhancing investments.
Chart 2.5 Net debt — international comparison
Note: For cross–country comparability, net debt levels reported by national statistical agencies for countries that have adopted the 2008 System of National Accounts (Australia, Canada, and the United States) are adjusted to exclude unfunded pension liabilities of government employees' defined benefit pension plans.
(a) Commonwealth general government net debt only; does not include net debt of states and territories.
Source: Treasury projections for Australia, IMF World Economic Outlook (October 2014) estimates for 2013 for all other countries.
Australia's net debt is currently lower compared to many other developed countries (Chart 2.5). Under the 'previous policy' scenario net debt in 2054-55 would be higher than most countries today. In contrast, the proposed policy scenario projects a dramatically improved position with negative net debt.
This negative net debt position (that is, more assets than debt) stems from the purchase of additional financial assets from underlying cash surpluses. The 'proposed policy' scenario projections for this report show the government building up substantial financial assets from around 2030–31. This implies that from that point the government would have a growing share of the economy held on its balance sheet.
This is the first Intergenerational Report to project a net debt position of zero or below by the end of the projection period. The projections also include allowance for future tax relief, with projections showing that the Government would have the fiscal space from the early 2020s under the 'proposed policy' scenario. This fiscal space means that the Government would be in a position to reduce taxes or otherwise adjust its fiscal parameters. It would likely make such an adjustment once net debt reaches around zero.
To some extent it makes sense to have some fiscal room, to allow for the economic shocks that might happen over the next 40 years. Between 2007–08 and the expected peak of net debt in 2016–17 the Australian Government's net debt is expected to have deteriorated by around 20 per cent of GDP. Recent international experience suggests that government debt levels can change rapidly as a result of economic shocks (Box 2.2).
Box 2.2: Rapid debt increase in Ireland
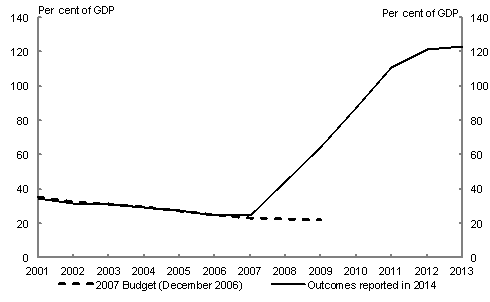
In Ireland, gross debt was estimated at around 25.1 per cent of GDP in 2006 (Chart 2.6). The 2007 Budget, which was released in 2006, forecast that gross debt would decline across the forward estimates, falling to 21.9 per cent of GDP in 2009.
The onset of the Global Financial Crisis pushed the Irish economy into a recession and brought an end to its housing boom. Irish banks required substantial Government support, in turn increasing the public debt burden. This alongside a fall in revenues saw a rapid increase in Irish gross debt between 2008 and 2013. In contrast with the outlook presented in the 2007 Budget, the Irish Government recorded gross debt of 124 per cent of GDP in 2013.
Ireland's experience provides a cautionary warning for all governments. Government balance sheets can deteriorate rapidly in the face of large economic shocks, especially when public finances are exposed to contingent liabilities in the financial sector.
Chart 2.6 Irish gross debt expected at 2007 Budget and outcomes, 2001 to 2013
Note: Outcomes and projections for the financial year ending 31 December.
Source: Irish Department of Finance, Budgetary Statistics 2014; Irish Department of Finance, Budget 2007.
Net financial worth
Net financial worth measures the difference between the financial assets and financial liabilities of the Australian Government, and provides a broader indication of fiscal sustainability than net debt. This measure includes government borrowing as well as superannuation liabilities and all financial assets.
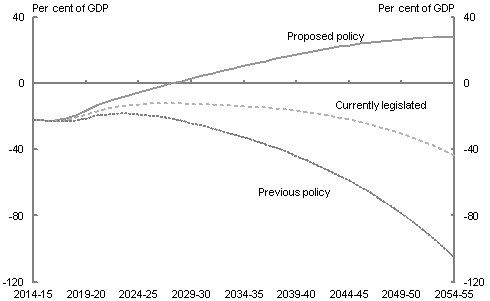
Under the 'previous policy' scenario, net financial worth is projected to deteriorate to negative 104
.9 per cent of GDP in 2054–55 (–$4,786 billion in today's dollars). This deterioration moderates markedly under the 'currently legislated' scenario, in which net financial worth is projected to be negative 43.4 per cent of GDP in 2054–55 (–$1,980 billion in today's dollars) (Chart 2.7).
Net financial worth is projected to be substantially higher under the 'proposed policy' scenario, projected to reach 27.7 per cent of GDP in 2054–55 ($1,279 billion in today's dollars).
Source: Treasury projections. Projections assume trend economic growth from 2021–22 to 2054–55.
2.1.4 Sensitivity of the fiscal projections
Projections of fiscal aggregates are an estimate of the Government's future fiscal position given the current policy environment and projections of the population and economic aggregates. Projections are therefore sensitive to changes in underlying assumptions.
The economic projections assume that the economy returns to full employment over the next seven years and then remains at full employment over the remainder of the projection period. These are simplifying assumptions. In reality, Australia's output and employment may not always be equal to its potential. Deterioration in the employment assumption would have a negative impact on the fiscal projections. In particular, actual growth outcomes that are lower than assumed in this report would have a negative impact on revenue collected by the Government, including tax receipts. This would lead to deterioration in the underlying cash balance and higher net debt.
Projections of fiscal aggregates are also affected by the projected levels of the various Australian Government payments. These payments are also sensitive to many of the underlying assumptions used. For instance:
- a higher than projected unemployment rate will result in higher Australian Government assistance to people of working age; and
- changes to demographic assumptions will have an impact on the projections of Australian Government health expenditure.
2.2 Government spending
This section contains more detailed projections of Australian Government spending in key areas based on the long–term demographic and economic growth trends outlined in Chapter 1, and other factors that are expected to affect spending. For the purpose of this section, total expenditure excludes interest payments, and reveals underlying spending pressures. Appendix A provides further details of the projections.
In 2014–15, around 55 per cent of Australian Government spending is directed to health, the National Disability Insurance Scheme (NDIS), aged care, pensions, payments to individuals, and education. These spending areas are sensitive to demographic change as spending is dependent on the size and age structure of the population. Other areas of spending — such as defence, official development assistance and infrastructure — are not linked explicitly to demographic factors and tend to be variable and highly dependent on discretionary government decisions (see Appendix C for further detail on modelling methodology).
In the coming decades, all levels of government will face growing fiscal pressures as the population ages and expectations for greater government support of ageing–related programs increase (Box 2.3).
Box 2.3: Age–related demand for government resources
The Australian population is projected to age significantly over the next 40 years. In this context, it is worth considering how patterns of consumption and labour income vary through the life cycle of education, work, and retirement.
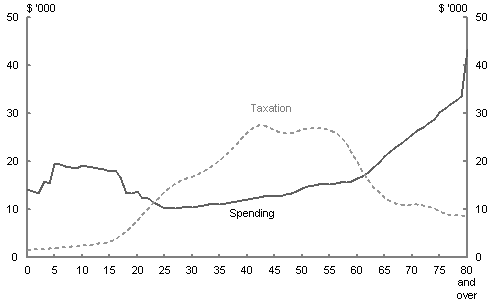
The value of total consumption of goods and services is relatively constant over an individual's life. Between age 25 and 58, this consumption, on average, can be more than funded through their labour income.
This age group also contributes more in taxes to government budgets than it receives in government funded goods and services (Chart 2.8). Outside these years, because individual income is not sufficient to fund demand for goods and services, some other source is needed: their own savings, transfers within households, or the government. These trends in consumption and income are not unique to Australia. The United States, Canada, Europe and Japan all exhibit similar patterns.
Government funds are not the only source available to bridge this gap between income and consumption for the very young or older cohorts. Private transfers and asset income, from properties or capital, provide a significant contribution to funding the difference between consumption and income for these groups. Further, many people in older age groups continue to bring valuable skills and experience to the economy, which is evident in the recent trend of rising participation of those aged 65 and over.
Chart 2.8 Total government spending and taxes by age (2009–10)
Note: Total government refers to Australian Government and State and Territory governments.
Source: Rice, Temple and McDonald, 2013.
Public spending is relatively high for the young, as they are not yet in the workforce and are generally consuming education services. Public spending per person is highest beyond age 65, with a substantial increase for people aged 80 and over. The reason for this is two–fold. People aged 65 and over tend to scale down their participation in the workforce, for example, in favour of other activities such as volunteering, spending time with family or leisure activities. At the same time, demand for government–provided services and payments such as the Age Pension and aged care, tends to increase.
In the critical area of health services, population ageing is an important component of the trend for higher consumption, though non–demographic factors are also major drivers (see Box 2.4).
Under the 'currently legislated' scenario, government spending in a number of areas is projected to rise as a proportion of GDP. Despite the efforts made already to implement budget repair, spending pressures remain. The most significant spending pressures are increased spending on health, and age–related spending on aged care and pensions.
Even under the 'proposed policy' scenario — which reflects all of the Government's 2014–15 Budget measures to constrain expenditure growth — spending on health and aged care are projected to rise as a proportion of GDP.
2.2.1 Health spending
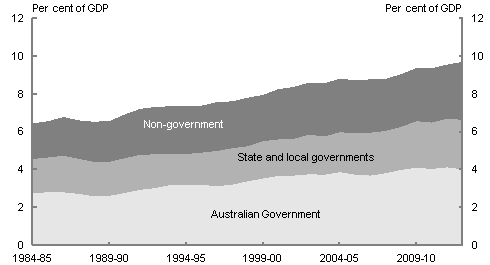
In 2012–13, the Australian Government provided around 41 per cent of total health spending and was the major source of public funds for health. State and local governments contributed 27 per cent, and private contrib
utions made up the remaining 32 per cent (Chart 2.9).
Chart 2.9 Historical health spending
Source: Australian Institute of Health and Welfare health spending database.
The key drivers of growth in real per person health spending over the past two decades have been non–demographic factors such as rising income, wage costs in the sector, changes in disease rates, and technological change. Demographic factors such as population growth and the ageing of the population have had a smaller impact (see Box 2.4).
Australian Government health expenditure
The Australian Government provides funding for health services to improve the health and wellbeing of Australians, and to ensure access to timely, affordable and high–quality health care services.
Major health programmes funded by the Australian Government include the Medicare Benefits Schedule and the Pharmaceutical Benefits Scheme. The Australian Government also makes a major contribution to the funding of public hospital services provided by State and Territory governments, subsidises the cost of private health insurance and provides financial support in other areas, including medical research, public health, Indigenous health services and medical workforce development; and provides health care services to veterans via White and Gold Card arrangements.
Under the 'previous policy' scenario Australian Government health expenditure was projected to rise to 7.1 per cent of GDP by 2054–55 ($324 billion in today's dollars) (Chart 2.10). Under this scenario real health spending per person, which was $1,400 in 1984-85, would have risen to $2,900 in 2014–15 and be expected to reach $8,200 in 2054–55.
Under the 'currently legislated' scenario, Australian Government health expenditure is projected to increase as a proportion of GDP from 4.2 per cent in 2014–15 to 5.7 per cent of GDP in 2054–55 ($260 billion in today's dollars) (Chart 2.10). Under this scenario real health spending per person would be $2,800 in 2014–15 and is expected to reach $6,600 in 2054–55.
At the 2014–15 Budget and MYEFO, the Government made a number of decisions to improve the sustainability of health spending. Some of these announced measures remain unimplemented. Under the 'proposed policy' scenario health expenditure is projected to rise to 5.5 per cent of GDP in 2054–55 ($255 billion in today's dollars).
Chart 2.10 Australian Government health spending
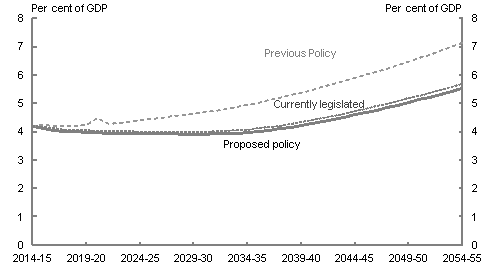
Note: Under the 'previous policy' scenario, health spending in 2020–21 is significantly higher than in the adjacent years owing to guarantee payments under the National Health Reform Agreement.
Source: Treasury projections. Projections assume trend economic growth from 2021–22 to 2054–55.
In addition to Australian Government spending, the Government will invest health savings announced at the 2014–15 Budget and the 2014–15 MYEFO measure 'A strong and sustainable Medicare' into the Medical Research Future Fund until the Fund reaches $20 billion. The Fund will provide significant new funding to medical research and will facilitate Australia maintaining a world–class medical research sector.
Box 2.4: Drivers of health spending
The drivers of real growth in health spending can be split into demographic factors, such as population growth and the ageing of the population and other, non–demographic factors.
Non–demographic growth refers to increases in health spending that occur independently of changes to the size and age of the population. A number of different factors influence either, or both of, demand and price growth. They include:
- Higher incomes are associated with an increased preference of individuals and society to consume greater or higher quality health care services (see Appendix C).
- Wage growth, which generally rises faster than the consumer price index (CPI), leads to price growth in labour intensive health industries, including hospitals and publicly funded medical services.
- Changes in disease rates, in particular increased prevalence of chronic health conditions which increase demand for treatments.
- Technological change also has impacts on both the price of, and demand for, health services.
- Some treatments that come on to the market are expensive, pushing up health expenditure.
- New ways of treating a condition can also be more efficient, leading to lower prices.
- New treatments such as keyhole surgeries often cause lower discomfort to the consumer than treatments previously available for the same condition. These treatments are therefore more popular and increase the demand for services.
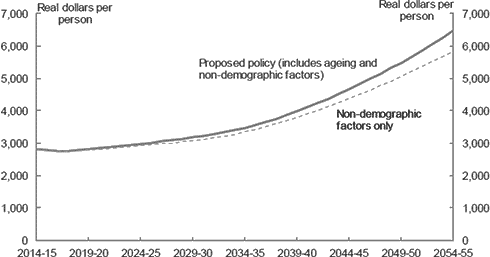
Non–demographic factors are expected to be the largest contributor to growth in real per person health spending. Non–demographic factors on their own (in the absence of the effects of an ageing population) account for around 80 per cent of the projected increase in real expenditure per person.
While non–demographic factors are the biggest driver of growth in health spending, the ageing of the population will also contribute to increases. The impact of ageing on its own is expected to contribute around 10 per cent of the projected increase in real expenditure per person (Chart 2.11).
Chart 2.11 Australian Government health spending per person with and without ageing (real 2014-15 dollars)
Source: Treasury projections. Projections assume trend economic growth from 2021–22 to 2054–55.
In addition, the ageing of the population and non‑demographic factors interact to accentuate their individual effects. For example, new medicines are more likely to be used by those who are already heavy users of the health system, often older people. This interaction effect contributes the remainder of the projected increase in real expenditure per person.
The impact of demographics on the Government’s health spending projections is a result of the health care of older people costing substantially more than the average person across major health programmes (Chart 2.12). For instance, for both pharmaceutical benefits and public hospitals expenditure, spending on the average person aged 85 years and older is over four times the spending on the average person across all ages.
Chart 2.12 Australian Government health spending by program based on age
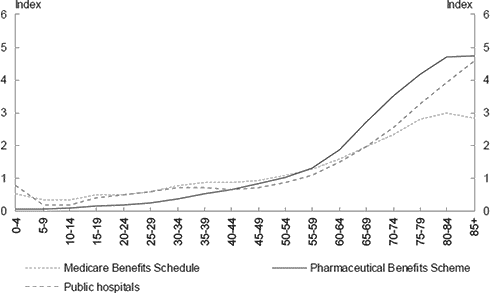
Note: Index of average cost per person in 2012‑13 = 1.
Source: Department of Health.
Components of Australian Government health spending
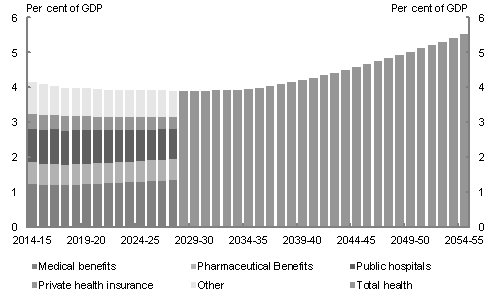
The major components of Australian Government health spending are projected individually for 10 years beyond the forward estimates, to 2027–28. Largely because of current policy settings for hospitals and private health insurance, it is projected that growth in Australian Government spending will be slower than projected in previous intergenerational reports, yet broadly keep pace with Australia's growing and ageing population.
During the period for which components are projected separately, from 2014–15 to 2027–28:
- Medicare services is projected to be the fastest growing component of health expenditure. In real terms, spending per person on Medicare services is projected to grow from $855 in 2014–15 to $1,071 in 2027–28 (in today's dollars). This is an increase of over 25 per cent in real spending per person.
- Real pharmaceutical spending per person is projected to grow from $420 in 2014–15 to $474 in 2027–28 (in today's dollars).
- Australian Government funding for public hospitals has increased from $568 per person in 2007–08 (in today's dollars) to $647 in 2014–15 and is expected to increases further to around $680 in 2017–18 (in today's dollars). From 2017–18 onwards, real per person funding from the Australian Government for public hospitals will remain constant.
- Real per person expenditure on the private health insurance rebate is projected to remain fairly stable, increasing slightly from $280 real per person in 2014–15 to $283 real per person in 2027–28 (in today's dollars).
From 2028–29 onwards, total Australian Government health spending is projected in aggregate based on the long–term trend in the spending on health by all levels of government. This growth rate is adjusted for different usage by age and sex.
The methodology adopted in these projections from 2028–29 reflects the strong likelihood that the Australian Government health budget will face spending pressures over the longer term, while recognising that the source of these pressures is uncertain. For example, the mix of health services is expected to shift gradually away from in–hospital treatment, towards (Australian Government funded) primary care and pharmaceutical interventions, which are less invasive and less costly per treatment.
Chart 2.13 Australian Government health spending by component
(excludes contributions to the Medical Research Future Fund)
Source: Treasury projections, 'proposed policy' scenario. Projections assume trend economic growth from 2021–22 to 2054–55.
2.2.2 Assistance to the aged
Payments to the aged
The Age Pension is designed to provide income support to older Australians who need it, while encouraging pensioners to maximise their overall incomes through superannuation and private savings.
Assistance to people older than the working age includes the Age Pension and similar payments to veterans and war widows (the Service Pension). Australian Government expenditure on payments to the aged is currently equal to around 2.9 per cent of GDP.
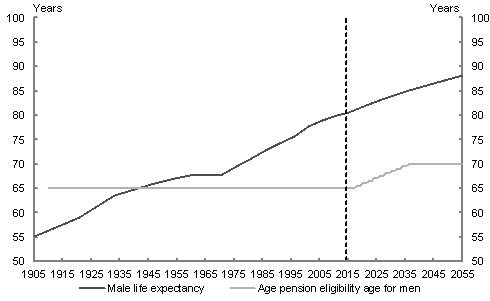
The Age Pension is a means tested payment for people over 65. From 1 July 2017, the qualifying age for the Age Pension will gradually increase to 67 by 1 July 2023. The 2014–15 Budget announced that the eligibility age would increase at the same rate to reach 70 by 1 July 2035. The rate of payment is dependent on the current level of a single person or couple's combined income or assets (excluding the family home) and does not depend on previous labour force experience or individual contributions.
Australia's Age Pension payment is designed to provide pensioners with a basic standard of living and is only one of three retirement income pillars — the others being compulsory superannuation and private savings. In addition to a cash payment, pensioners may also be eligible for a comprehensive range of concessions and assistance for health, rent, pharmaceuticals and other living expenses.
In 2013–14, about 70 per cent of people of Age Pension age were receiving the Age Pension. Of these pension recipients, around 60 per cent receive a full rate pension. Under the 'proposed policy' scenario, the proportion of people of Age Pension age receiving the Age Pension is projected to fall to around 67 per cent by 2054–55 (Box 2.5).
Box 2.5: Superannuation
The superannuation system helps Australians to enhance their retirement incomes and can supplement or reduce reliance on the Age Pension. Since the advent of compulsory superannuation in 1992, employers have been required by law to make minimum payments to a complying superannuation fund to help employees save for retirement.8 This rate is currently 9.5 per cent and is scheduled to rise to 12 per cent between 1 July 2021 and 1 Jul
y 2025.
Australians are also able to make additional voluntary contributions to superannuation in order to boost their retirement savings. Superannuation benefits are generally preserved until the age of 55 years (increasing to 60 years).
Superannuation is generally taxed more concessionally than some other forms of saving, such as bank deposits, in recognition of the fact that superannuation saving cannot be accessed until retirement.
- Pre–tax contributions of up to $30,000 pa ($35,000 for those aged 50 or over) into superannuation funds are taxed at a flat rate of 15 per cent in the fund.
- It is also possible to make post–tax contributions of up to $180,000 per annum.
- Superannuation fund earnings in the accumulation phase are taxed at 15 per cent, while superannuation fund assets that support a retirement income stream are tax exempt.
- Most superannuation benefits to those aged over 60 are tax exempt.
Tax concessions for superannuation seek to encourage long–term saving for retirement.
At the end of 2013–14, total superannuation assets were $1.84 trillion, around 116 per cent of GDP. Superannuation assets are expected to continue to increase as the system matures and wages grow. Compulsory superannuation savings appear to have made a significant contribution to national savings (around 1.5 per cent of GDP in 2011 and rising to close to three per cent over the next few decades). This is despite some reduction in other forms of savings. The Financial System Inquiry (FSI) noted a Treasury estimate that the size of the sector could reach around $9 trillion by 2040 (Interim Report, pages 2–84).
The median superannuation balance for a person in the accumulation phase in 2011–12 is estimated to be around $30,000. The median account balance for a person aged 60 or over in the accumulation stage in 2011–12 is estimated to be $95,000. These retirees may have received no compulsory superannuation or lower Superannuation Guarantee (SG) contributions for part of their careers. In the future, retirees are likely to achieve higher balances as a result of receiving higher SG payments for longer periods.
Future growth in retirement balances has potential implications for the size of Australian Government outlays on the Age Pension. In 2013–14, around 70 per cent of people of Age Pension age were receiving the Age Pension. Of these, 60 per cent were in receipt of the full–rate pension. As Australia's superannuation system matures, and compulsory contributions increase, many Australian workers will retire with much larger superannuation balances. The proportion of part–rate pensioners relative to full–rate pensioners is expected to increase. The proportion of retirees receiving any pension is not projected to decline.
An important issue identified by the FSI concerns how the superannuation system transforms savings into retirement income streams. The FSI highlighted the extent to which concern among retirees about outliving their benefits leads them to fail to draw down their superannuation balances in retirement, resulting in lower standards of living and significant transfers to beneficiaries. The Government is reviewing regulatory obstacles to the development of better post–retirement products and will respond to the FSI recommendations later in 2015.
Box 2.6: Age Pension means tests
The Age Pension provides a basic level of income to senior Australians and is one of the three pillars of the Australian retirement income system (along with compulsory superannuation and voluntary saving). Age Pension recipients may also receive Rent Assistance if they are renting privately and the Pensioner Concession Card, which provides a range of non–cash benefits including reduced–cost medicines and more refunds for medical expenses through the Medicare Safety Net.
The Age Pension is means tested with two tests: an income test and an assets test.
The assets test reduces the pension amount by $1.50 per fortnight for every $1,000 of assets over the threshold (currently $202,000 for a single and $286,500 combined for couple homeowners and $348,500 for a single and $433,000 combined for a couple who are not homeowners). The income test reduces the pension amount by 50 cents for every dollar over the income–free area (currently $160 per fortnight for a single pensioner and $284 a fortnight for a couple combined).
The test that results in the lower rate of payment is the one used to calculate the benefit received. Amounts over the means test thresholds result in a (tapered) reduction of the Age Pension payment. Payment rates also vary according to whether a person is single or a member of a couple.
Nearly all assets and income a pensioner owns or earns are included in the means tests. The primary residence is not included in the asset test. Financial assets, such as shares and superannuation, are deemed to earn income. This deemed income is added to any other income, such as income from running a business, employment or rent from an investment property, for the purpose of the income test.
A pensioner can continue to receive some payment and the Pensioner Concession Card with assets (excluding their primary residence) up to $771,750 for single homeowners and $1,145,500 combined for couple homeowners. A single person who does not own a home can have assets up to $918,250 and a couple up to $1,292,000 combined and still receive a part pension. A single pensioner can also earn up to $1,868.60 per fortnight (approximately $48,580 per annum) in income and continue to receive a part pension, while a couple can earn up to $2,860 per fortnight combined (approximately $74,360 per annum).
For example:
- Kathleen and Steve are 68, own their home and have $1.1 million in superannuation, shares and bank accounts. They have no other income. They will receive a part–rate pension.
- Liam is 75 is single and has superannuation, an investment property and shares valued at $910,000. He does not own a home and has no other income. He also receives a part–rate pension.
- Lillian is 85, single and lives in her own home worth $1.5 million. She has bank accounts valued at $50,000 but has no other income. Lillian receives a full–rate pension.
- Kushla is 68, works part time and earns $750 a week. She also has superannuation and bank accounts valued at $123,000. She does not own a home. Kushla receives a part–rate pension.
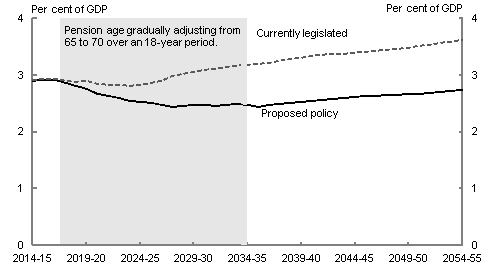
Under the 'currently legislated' scenario, Australian Government expenditure on Age and Service pensions is projected to rise as a per cent of GDP from 2.9 per cent in 2014–15 to 3.6 per cent in 2054–55 ($165 billion in today's dollars).
The Government announced a number of reforms at the 2014–15 Budget which would place Age and Service Pension spending on a more sustainable path. These reforms include increasing the eligibility age of the Age Pension and changes to indexation and the deeming thresholds, which will reduce the drivers of spending by reducing the eligible population and growth in payments. As the majority of these reforms remain unimplemented, projections of Age and Service Pension spending under the 'previous policy' scenario are broadly similar to the projections under the 'currently legislated' scenario.
Under the 'proposed policy' scenario, Australian Government expenditure on Age and Service Pensions is projected to decrease slightly from 2.9 per cent of GDP in 2014–15 to 2.7 per cent of GDP in 2054–55. However, pension rates are projected to increase each and every year.
As outlined in the 2014–15 MYEFO, once the Budget returns to a surplus of 1 per cent of GDP, there will be more capacity to revisit the level of Government support to groups such as Age Pensioners. The Budget is projected to reach
a 1 per cent surplus in 2028–29. For modelling purposes, the projections for assistance to the aged assume that indexation of pensions switches from the Consumer Price Index to Average Weekly Earnings in that year.
Chart 2.14 Australian Government Age and Service pensions
Source: Treasury projections. Projections assume trend economic growth from 2021–22 to 2054–55.
Chart 2.15 Male life expectancy and age pension age
Note: Period life expectancies have been used for this chart to allow comparisons over time. Data is for the financial year ending June 30.
Source: Australian Government Actuary Life Tables, Treasury projections.
Aged care spending
The Australian Government provides aged care funding for residential aged care and a range of community care services, including care in the home. In 2014–15, the Australian Government provided around 0.9 per cent of GDP for total government aged care expenditure. The States contributed a small proportion of less than 0.1 per cent.
The dominant influence on aged care spending projections is the number of people over the age of 70, reflecting the government's commitment to provide 125 aged care places per thousand people aged over 70. The number of people aged 70 years and over is expected to almost triple over the next 40 years, reaching around 7 million people by 2055.
In the 2014–15 Budget the Australian Government took measures to adjust the real rate of growth in the Commonwealth Home Support Programme (which will replace the current Home and Community Care Programme) to 3.5 per cent annually. As these measures have been implemented, projections of Australian Government Aged Care expenditure are similar under both the proposed policy and 'currently legislated' scenario.
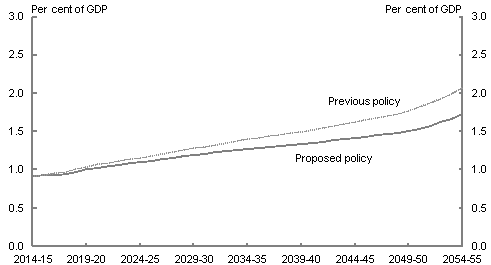
Under the 'proposed policy' scenario, Australian Government Aged Care expenditure is projected to rise from 0.9 per cent of GDP in 2014–15 to 1.7 per cent of GDP in 2054–55 ($80 billion in today's dollars) (Chart 2.16).
Under the 'previous policy' scenario, projections show that spending would increase to 2.1 per cent of GDP by 2054–55 ($94 billion in today's dollars).
Chart 2.16 Australian Government aged care spending
Source: Treasury projections. Projections assume trend economic growth from 2021–22 to 2054–55.
2.2.3 Other payments to individuals
In addition to the Age and Service Pensions and assistance to the aged, a range of Australian Government programs provide income support to individuals who require support or supplementary assistance. These payments fall across two broad groups: assistance to those of working age; and assistance to families. The two largest components are the Disability Support Pension (DSP) and the Family Tax Benefit.
Chart 2.17 Composition of Australian Government payments to individuals
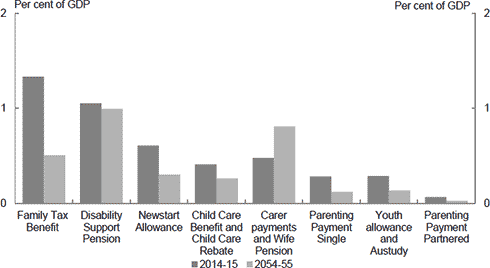
Note: Carer payments = Carer Allowance + Carer Payment.
This chart shows projections under the 'proposed policy' scenario.
Source: Treasury projections.
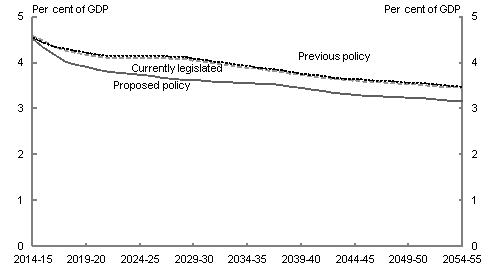
Under the 'currently legislated' scenario, projections show that payments to individuals are projected fall from 4.5 per cent of GDP in 2014–15 to 3.4 per cent of GDP by 2054–55 ($157 billion in today's dollars) (Chart 2.18).
As the majority of the Government's measures to improve the sustainability of income support remain unimplemented, projections of payments to individuals under the previous policy scenario are broadly similar to the projections under the 'currently legislated' scenario.
This trend is broadly similar to the 2010 report where spending on payments to individuals was projected to fall from 4.2 per cent of GDP in 2009–10 to 3.0 per cent of GDP in 2049–50.
Under the 'proposed policy' scenario, Australian Government payments to individuals, excluding the Age and Service Pensions, are projected to fall to 3.2 per cent of GDP in 2054–55 ($146 billion in today's dollars).
Chart 2.18 Australian Government payments to individuals
Source: Treasury projections. Projections assume trend economic growth from 2021–22 to 2054–55.
Assistance to those of working age
The Government provides assistance to people of working age who are in genuine need of assistance. This includes people who, because of certain factors such as disability and caring responsibilities, are unable to earn their own incomes.
The Government also provides income support to assist jobseekers who are temporarily unable to support themselves through work, targeted to those most in need and designed to encourage self–reliance and participation.
The main payments to people of working age are the Disability Support Pension (DSP), Newstart Allowance, Parenting Payment Single, Parenting Payment Partnered, Carer Payment, Carer Allowance, Youth Allowance (other), Youth Allowance (student) and Austu
dy.
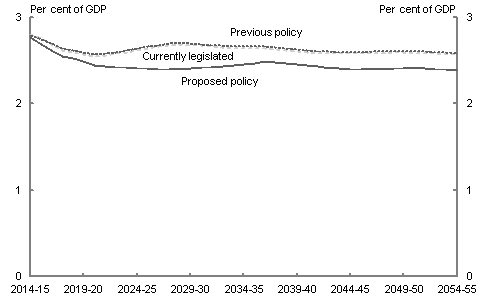
Under the 'currently legislated' scenario, Australian Government assistance to those of workforce age is projected to decline from 2.8 per cent of GDP in 2014–15 to 2.6 per cent of GDP in 2054–55 ($117 billion in today's dollars) (Chart 2.19).
Under the 'proposed policy' scenario, Australian Government spending on assistance to those of working age is projected to decline to 2.4 per cent in 2054–55 ($110 billion in today's dollars).
This trend is broadly similar to the 2010 report where Australian Government assistance to the workforce age was projected to fall as a per cent of GDP from 2.4 per cent in 2009–10 to 2.2 per cent in 2049–50.
Improvements in the sustainability of Australian Government expenditure on working–age payments partly reflect decisions made in the 2014–15 Budget. Most significantly, key working age pension or pension–equivalent payments, including the DSP and Carer Payment, will be indexed to CPI from 2017–18.
Further, the indexation of all income and asset thresholds will be paused for three years and jobseekers under 30 years of age applying for Newstart or Youth Allowance (other) will have a new waiting period before receiving any payments. Some DSP recipients will be reviewed with the current Impairment Tables and there are new requirements regarding participation for DSP recipients under 35.
Chart 2.19 Australian Government assistance to those of working age
Source: Treasury projections. Projections assume trend economic growth from 2021–22 to 2054–55.
Assistance to families
The main payments that provide assistance to families are the Family Tax Benefit, Child Care Benefit and Child Care Rebate. Family Tax Benefit is designed to assist low and middle income families with the costs of raising dependent children.
The Government provides funding for childcare to facilitate increased workforce participation of parents, particularly women, and generate community–wide benefits from enhanced child–development.
One driver of reductions in spending on assistance to families is demographic change. The proportion of the population aged less than 15 is projected to fall from 18.8 per cent in 2014–15 to 17.5 per cent in 2054–55.
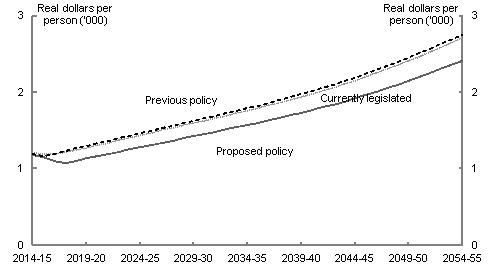
Under the 'currently legislated' scenario, Australian Government expenditure on assistance to families is projected to fall as a per cent of GDP from 1.8 per cent in 2014–15 to 0.9 per cent in 2054–55 (Chart 2.20).
At the 2010 report, Australian Government assistance to families was projected to fall as a per cent of GDP from 1.6 per cent in 2009–10 to 0.9 per cent in 2049–50.
2014–15 Budget measures improve the targeting and sustainability of Family Tax Benefit payments. This includes tighter eligibility conditions for Family Tax Benefit Part B from 1 July 2015 and pauses to indexation of payment rates. In addition, the Schoolkids Bonus payment will be means tested from 1 January 2015 and cease from 31 December 2016.
Under the 'proposed policy' scenario, Australian Government expenditure on assistance to families is projected to reach 0.8 per cent of GDP by 2054–55 ($35 billion in today's dollars).
Chart 2.20 Australian Government assistance to families per person (real 2014–15 dollars)
Source: Treasury projections. Projections assume trend economic growth from 2021–22 to 2054–55.
2.2.4 Education and training spending
The Australian Government provides funding for the delivery of education services in schools and the vocational education and training (VET) and higher education sectors to support human capital formation, improved productivity and labour market outcomes, and social opportunity.
Education and training services in Australia comprise schools, VET and higher education. Australian Government education spending is estimated to be 1.7 per cent of GDP in 2014–15. Just over half of this spending is on government and non–government schools delivered as specific purpose payments to State and Territory governments.
In 2010 and then in 2012, the then Australian Government introduced changes to higher education to partially and then fully uncap the number of Commonwealth supported places, leading to a sharp increase in the number of undergraduate students and related Australian Government expenditure.
The Government has proposed various reforms to the higher education sector. These reforms include deregulating fees for higher education providers, extending Commonwealth supported places to sub–bachelor as well as bachelor courses at all approved higher education institutions, and a reduction in the Australian Government's contribution towards a new student's course fees. These measures are yet to be implemented.
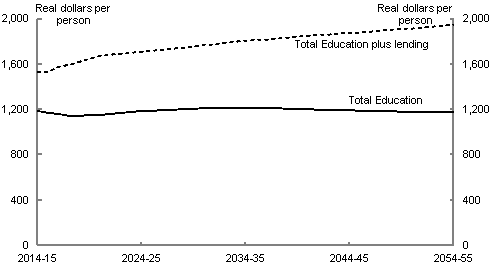
Chart 2.21 Australian Government Spending on Education and Training per person (real 2014–15 dollars)
Source: Treasury projections, 'proposed policy' scenario. Projections assume trend economic growth from 2021–22 to 2054–55.
Under the 'currently legislated' scenario, Australian Government spending on education and training is projected to rise as a per cent of GDP from 1.7 per cent in 2014–15 to 2.0 per cent in 2054–55.
This is broadly similar to the projections under the 'previous policy' scenario as the Government is yet to implement a number of the education reforms announced at the 2014–15 Budget. These include the changes to indexation of recurrent schools funding and reforms to the higher education system.
Under the 'proposed policy' scenario, Australian Government spending on education and training is projected to decline to 1.0 per cent of GDP by 2054–55. However, these figures do not take into account the significant increase in lending to students through the higher education and vocational education and training loan schemes.
Australian Government spending per person (in today's dollars) on education and training is projected to be $1,200 in 2014–15 and in 2054–55. If Higher Education Loan Programme (HELP) loans and VET FEE–HELP are taken into account t
hen the amount the government provides per person (in today's dollars) is projected to rise from $1,500 in 2014–15 to $1,900 in 2054–55.
Spending per higher education student (in today's dollars) is projected to fall from $11,800 in 2014–15 to $9,400 in 2054–55. If HELP loans to students are taken into account then the amount the government provides per higher education student (in today's dollars) is projected to rise from around $19,100 per student in 2014–15 to $23,100 per student in 2054–55.
If VET FEE–HELP provided to students is taken into account, then the amount the government provides per vocational education and training student (in today's dollars) is projected to rise from around $3,600 per student in 2014–15 to $3,700 per student in 2054–55.
Spending per school student (in today's dollars) in projected to rise from $4,200 in 2014–15 to $4,600 in 2054–55.
2.2.5 National Disability Insurance Scheme
The National Disability Insurance Scheme (NDIS) is a mechanism for funding long–term care and support for people with disability. The Australian and State governments jointly fund the scheme, and established a single agency, the National Disability Insurance Agency, to administer and fund the NDIS.
The NDIS is expected to be fully operational in 2019–20, before which cost estimates reflect the transition to the full scheme agreed with the States.
From 2020–21, the model used for projections builds on the cost estimates from the Productivity Commission's 2011 report into Disability Care and Support, and projects the total cost of the NDIS based on the number of participants and the average cost per participant.
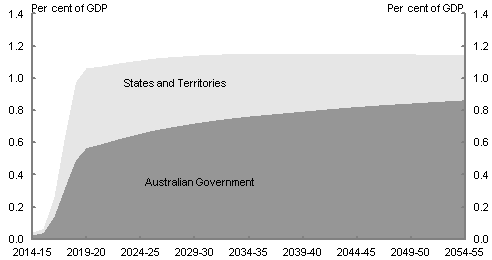
Total government spending on the NDIS is projected to be broadly stable at 1.1 per cent of GDP between 2019–20 and 2054–55 (Chart 2.22), following a significant increase from less than 0.1 per cent of GDP in 2014–15.
As a per cent of GDP, State spending on the NDIS is projected to decrease from 0.5 per cent of GDP in 2019–20 to 0.3 per cent in 2054–55. Consequently, the Australian Government's contribution is projected to grow as a proportion of the total NDIS spending, increasing from under 55 per cent in 2019–20 to around 75 per cent in 2054–55.
Chart 2.22 Total government NDIS spending
Note: This chart shows projections under the 'proposed policy' scenario. There are no pending measures for this area of spending.
Source: Treasury projections. Projections assume trend economic growth from 2021–22 to 2054–55.
2.2.6 Defence
The Australian Government provides funding for the delivery of navy, army, air and intelligence capabilities, support for Australian military operations overseas and strategic policy advice for the defence of Australia and its national interests. Funding for defence (excluding operations) in 2014–15 is estimated to be 1.8 per cent of GDP, following a low of 1.6 per cent of GDP in 2012–13 and, consistent with government policy, is projected to increase gradually to 2 per cent of GDP by 2023–24.
As a defence expenditure profile for the years beyond 2023–24 will be agreed in the 2015 Defence White Paper, defence funding is held constant at 2 per cent of GDP from 2023–24 onwards to enable defence funding to reflect changes in national income without representing a significant change in policy. The projection methodology is detailed in Appendix C.
2.3 Revenue projections
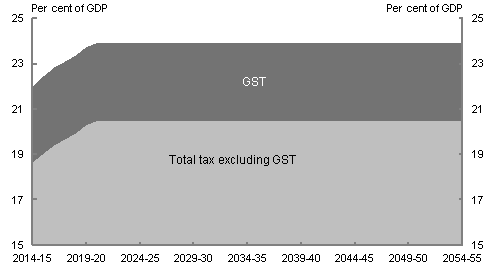
This report assumes, in the long run, a constant tax–to–GDP ratio of 23.9 per cent. This rate is based on the average tax–to–GDP ratio of the years following the introduction of the GST and prior to the global financial crisis (2000–01 to 2007–08 inclusive). This methodology is similar to that used in previous intergenerational reports. Appendix C sets out the methodology and the rationale for a constant tax–to–GDP assumption.
Consistent with other economic assumptions, under the 'proposed policy' scenario, tax receipts continue to recover from the global financial crisis and are projected to increase as a proportion of GDP to 2020–21, when it reaches the tax–to–GDP ratio assumption. The projected path is shown in Chart 2.23. The tax–to–GDP ratio is projected to increase from 22.0 per cent of GDP in 2014–15 to 23.9 per cent of GDP in 2020–21. The increase occurs largely because individuals will pay increasing average tax rates on personal income over time owing to bracket creep.
Chart 2.23 Projected tax–to–GDP ratio
Source: Treasury projections. Projections assume trend economic growth from 2021–22 to 2054–55.
Box 2.7: Bracket creep
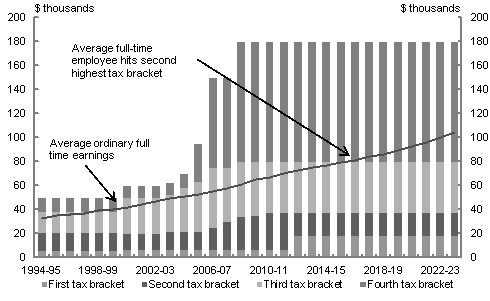
Under our progressive tax system individuals pay higher marginal rates of tax as their taxable income increases. Tax thresholds do not automatically keep pace with inflation or wage growth. Bracket creep refers to the fact that taxpayers will face higher average, and sometimes marginal, tax rates over time even if their income has only increased by inflation. While bracket creep exists because of the progressivity of the individuals income tax system, unchecked bracket creep affects lower and middle income earners proportionally more than higher incomes earners.
For example, average ordinary full time earnings were around $75,000 in 2013–14, and are expected to be around $104,000 in 2023–24. Someone on average full time earnings therefore had an average tax rate of 22.7 per cent in 2013–14, which would increase to 27.4 per cent by 2023–24 without any tax cuts. By contrast, someone with only half that income earned $37,500 in 2013–14, increasing to $52,000 in 2023–24. However, their average tax rate will increase from 10.3 per cent to 17.8 per cent, a larger percentage point increase. Someone earning twice the average full time wage is on $150,000, increasing to $208,000 in 2023–24, but their average tax rate will only increase from 30.5 per cent to 34.3 per cent.
Chart 2.24 Personal income tax rates and the effects of bracket creep
Source: ABS cat. no. 6302.0 and Treasury calculations.
For some people, particularly those on relatively low incomes, bracket creep can reduce incentives to work. At higher incomes, bracket creep increases the incentives for tax planning and structuring, and even overseas relocation.
2.3.1 Pressures and risks to revenue
The overall level of Australian Government taxation has remained broadly steady as a share of GDP over the past 30 years. In the coming decades, taxation receipts are expected to continue to closely track the strength of the Australian economy. This highlights the importance of improving workforce participation and increasing productivity, key drivers of economic growth. Changes to Australia's tax system could help Australia take advantage of global opportunities and improve economic growth (discussed in chapter 3).
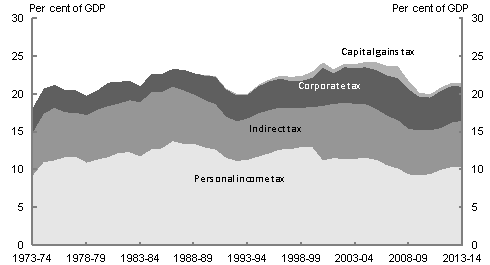
The composition of Australian Government taxes and heavy reliance on income taxes has also remained largely unchanged. Over the past fifteen years, some modest compositional changes in tax revenue have occurred partly as a result of movements in commodity prices and policy changes, for example, the introduction of the GST (see Chart 2.25).
In recent decades, however, financial deregulation, the growth of multinational companies using global supply chains and the increasing digitisation of global commerce have all transformed the environment in which tax systems must operate.
Demographic influences clearly have an impact on aggregate GDP, and they may also affect the composition of GDP. This means that the various tax bases may generate either more or less revenue than is assumed by the constant tax–to–GDP ratio. It is likely that the impact of demographic changes on the composition of tax revenue will be small and ambiguous.
Chart 2.25 Historical composition of tax
Source: Treasury.
Superannuation
There are two offsetting effects on tax revenues stemming from the superannuation and taxation system.
First, recognising the restriction on accessing superannuation, superannuation income is generally taxed at a lower rate than other income to provide an incentive to save for retirement. As the population ages and a greater share of income is earned through superannuation funds, the overall average tax rate may decrease.
Second, the superannuation system is expected to grow faster than GDP, at least until the pre–Super Guarantee workforce moves through the system. According to current projections, the superannuation system is expected to mature at about the same time as the old–age dependency ratio stabilises.
Changed consumption patterns
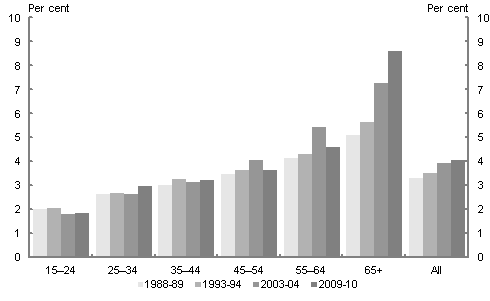
As the population ages, consumption patterns are likely to change. For example, older people spend a greater proportion of their income on health services than the average individual, and this proportion has been rising over time (Chart 2.26). An ageing population will increase the overall average proportion of income spent on health, hence decreasing GST receipts (as health services are GST–free). At the same time, however, an ageing population will also decrease the overall average proportion of income spent on education, which is also GST–free.
Chart 2.26 Expenditure on medical care and health expenses as a percentage of total household expenditure by age of reference person
Source: ABS cat. no. 6530.0.
Excise
In the 2014–15 Budget, the Government re–introduced biannual indexation by the consumer price index of excise and excise–equivalent customs duty for all fuels except aviation fuels. Not indexing would see fuel excise collections fall from around 1 per cent of GDP in 2014–15 to less than 0.5 per cent in 2054–55. In that circumstance, a constant tax–to–GDP ratio would imply that other taxes would increase as a share of total tax.
In addition, taxes levied on a volumetric basis, such as fuel, tobacco and some alcohol, may grow at a slower rate than nominal GDP. For example, a continuation of the long–run decline in per–capita tobacco consumption will mean that tax receipts from tobacco excise continue to decline as a share of total tax receipts, leading to a change in the composition of taxes.
Changed labour and capital shares of income
This report assumes that the labour–capital ratio is constant in the projection period. Changes in the labour–capital ratio will affect the relative proportion of taxes derived from wages and capital. For example, a change to saving rates or the composition of expenditure will affect the composition of income between wages and profits.
The impact on total tax revenue will depend on the difference between tax rates on wages and profits. Historically, both rates average around 24 to 28 per cent, depending on the year and definitions used. The small range of these rates suggests that a very large compositional change between wages and profits would be required before there was a significant effect on tax revenues.
2.4 Major balance sheet items
2.4.1 Gross debt
With the budget in balance or surplus over the longer term, Commonwealth Government Securities (CGS) issuance (gross debt) will eventually not be required to finance the government's activities. The Government is committed to a well–functioning and liquid debt market. This supports the Treasury bond futures markets (used
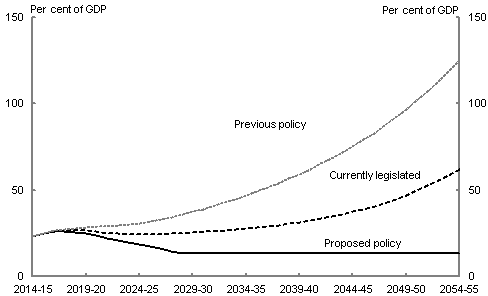
by financial institutions to manage interest rate risk), supports the corporate bond market by providing a risk–free benchmark and provides a low–risk investment vehicle. The balance sheet projections therefore incorporate a technical assumption that gross debt will be maintained at a level equivalent to 13 per cent of GDP. Under the 'proposed policy' scenario, gross debt is projected to fall from a projected peak of 26.1 per cent of GDP in 2016–17 to the assumed 13 per cent minimum by around the late 2020s, where it will remain over the rest of the projection period (Chart 2.27).
Source: Treasury projections. Projections assume trend economic growth from 2021–22 to 2054–55.
Under the 'currently legislated' scenario, gross debt is projected to reach 61.8 per cent of GDP by 2054–55 ($2,820 billion in today's dollars), substantially lower than under the 'previous policy' scenario projections of 125.1 per cent of GDP ($5,707 billion in today's dollars).
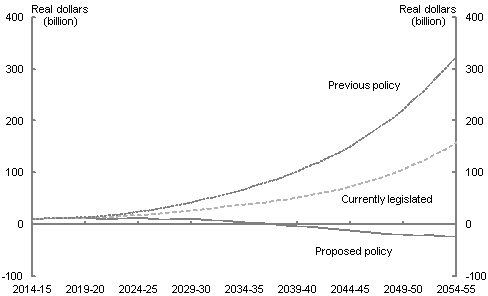
The 'proposed policy' scenario shows that the Government's budget measures would stabilise interest payments on gross debt (as a per cent of GDP) over the projection period. However, under the 'currently legislated' scenario, net interest payments are projected to rise from 0.7 per cent of GDP in 2014–15 to 3.5 per cent of GDP in 2054–55 ($157.6 billion in today's dollars). This is an improvement compared to 7.1 per cent ($323.6 billion in today's dollars) under the 'previous policy' scenario (Chart 2.28).
If all proposed policy is implemented, net interest payments are projected to fall to negative 0.5 per cent of GDP in 2054–55 (that is, annual net interest receipts of 0.5 per cent of GDP — $22.3 billion in today's dollars).
Chart 2.28 Net interest payments (2014–15 dollars)
Source: Treasury projections. Projections assume trend economic growth from 2021–22 to 2054–55.
2.4.2 Public Sector Superannuation
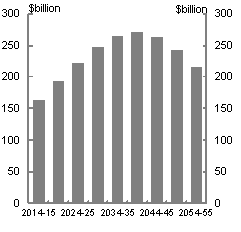
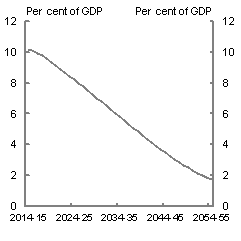
The largest of the Australian Government's future superannuation obligations are the defined benefit schemes for civilian and military employees. These schemes have historically been mostly unfunded, with the bulk of entitlements being funded at the time benefits are paid rather than when they accrue — the unfunded superannuation liability as at 30 June 2014 for these schemes was estimated at $155 billion (just under 10 per cent of GDP).
Almost all of the unfunded superannuation liability relates to the Commonwealth Superannuation Scheme (CSS), the Public Sector Superannuation Scheme (PSS), the Defence Force Retirement and Death Benefits Scheme (DFRDB) and the Military Superannuation and Benefits Scheme (MSBS). The first three of these schemes are now closed to new entrants, and the Government has announced that the MSBS will close from 1 July 2016.9
Since the closure of the PSS in 2005, the Australian Government has been funding the superannuation entitlements for new civilian employees as they accrue. This will also be largely the case for military personnel from 1 July 2016. In the medium to long term, this will considerably reduce future unfunded accruals. In the shorter term, existing contributory members of the closed schemes will continue to accrue unfunded benefits and the unfunded liability is projected to continue to grow in nominal value.
Given this, the liability is projected to grow more slowly than the economy over the next 40 years, and consequently it represents a declining share of GDP, falling from around 10 per cent of GDP in 2014–15 to less than 2 per cent in 2054–55.
Chart 2.29 projects the combined liabilities of the CSS, PSS, DFRDB and MSBS.
Chart 2.29 Defined benefit unfunded superannuation liabilities
Source: The Australian Government Actuary.
2.4.3 Future Fund
The Future Fund was established by the Australian Government in 2006 to assist future governments in funding the cost of the superannuation liabilities of the Commonwealth public sector.
From 2020, superannuation payments will be financed by drawing down on assets in the Future Fund rather than from general revenue. This will ease the fiscal adjustment task associated with other projected fiscal pressures.
The Future Fund had assets of $101 billion as at 30 June 2014 and generated a return of 13.9 per cent in 2013–14.10 Projections in this report suggest that assets will peak in the late 2020s at around $165 billion, contributing earnings of $7 billion a year to the Australian Government's cash position.
As a result of drawdowns made from the Fund from 2020, the balance is projected to be depleted by around the late–2040s, during which time the Fund is projected to have funded around $400 billion of Commonwealth superannuation payments. These are payments that would otherwise have to be funded from general government revenue and borrowings.
Between 2014–15 and 2019–20, annual net earnings (interest and dividends less operating expenses) of the Future Fund are excluded from the Australian Government underlying cash balance. This is consistent with the treatment in Australian Government budget updates since the Fund was established in 2006. Once drawdowns commence in 2020–21, net earnings are included in the underlying cash balance, because the Fund's earnings are available to finance government liabilities from that date. This has only a marginal impact on the reported underlying cash balance. On average, the underlying cash balance is 0.1 per cent of GDP higher ov
er the 40 year projection period than if net Future Fund earnings are excluded.
2.4.4 Higher Education Loan Programme
The Higher Education Loan Programme asset (that is, the value of future repayments on outstanding student debt) is projected to increase as a share of GDP over the projection period. This reflects both increasing demand, which is assumed to result in growing numbers of students incurring a debt in each year, and higher average debts per student. The expansion of the student population and the longer repayment periods associated with higher average debts both have the potential to lead to different repayment patterns from those that have been seen in the past. This introduces significant uncertainty around the estimates.
7 All scenarios assume that taxes will not grow to exceed 23.9 per cent of GDP. This is the average ratio of the years following the introduction of the GST and prior to the Global Financial Crisis (from 2000-01 to 2007-08 inclusive).
8 Superannuation Guarantee (SG) does not apply to employees who earn less than $450 per month; the maximum base for the SG is $49,430 per quarter.
9 Following the closure of the MSBS, new military personnel will continue to have access to unfunded salary-related death and disability benefits. Retirement benefits will be provided under a funded defined contribution arrangement.
10 See the Future Fund Portfolio update at 30 June 2014
.