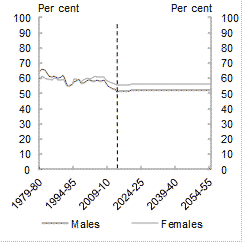
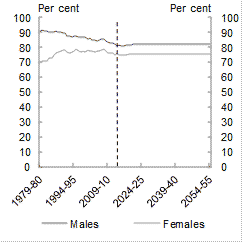
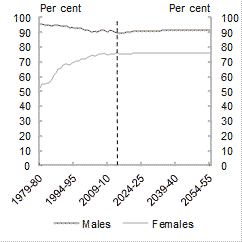
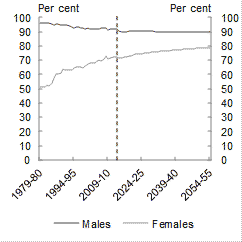
The age–specific participation rates for both men and women are projected to increase or stabilise in all age groups to 2054–55 (Chart D.1).
While total labour force participation is projected to decline as the population ages, based on recent trends, some age groups are expected to experience rising labour force participation rates.
Labour force participation rates for females in most age groups have increased significantly over the past 20 years, and are expected to continue increasing over the projection period. This is attributed to the increased levels of educational attainment among women and continued better access to childcare services and more flexible work arrangements.
For all age groups (other than those aged 15–19 years) the total participation rate for men is higher than for women. In 2013–14, around 71 per cent of men, compared to 58.6 per cent of women, participated in the labour force. This trend is projected to continue, with 68.1 per cent of men and 56.8 per cent of women in the labour force in 2054–55.
Participation rates of older age groups (aged 55+) have risen in recent years, a trend that is expected to continue as life expectancy increases and the availability of less physically demanding work rises.
Participation rates for men and women are projected to increase significantly for those aged 60–69 years. This is partly associated with the gradual increase in the Age Pension eligibility age from 65 to 70 years between 2017 and 2035.
Chart D.1 Participation rates ‑ history and projections by age group and gender
Age 15–19
Age 20–24
Age 25–29
Age 30–34
Age 35–39
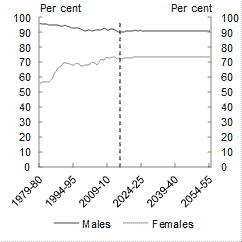
Age 40–44
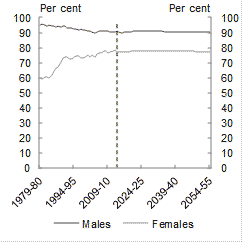
Age 45–49
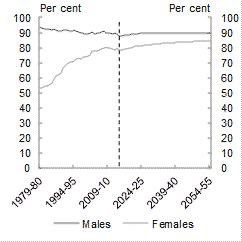
Age 50–54
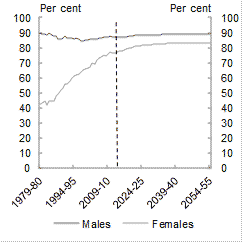
Age 55–59
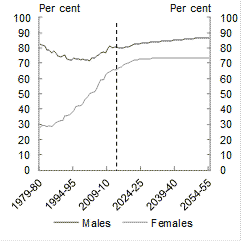
Age 60–64
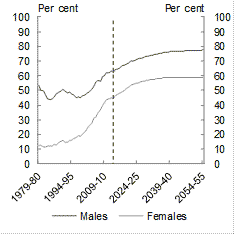
Age 65–69
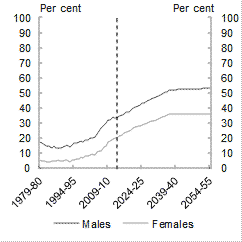
Age 70 and over
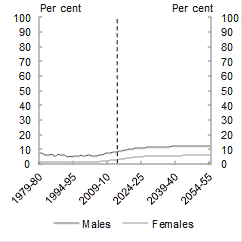
Note: Dashed line is placed over 2013–14 to distinguish history from projections.
Source: ABS cat. no. 6291.0.55.001 and Treasury projections.