Ben Dolman, Lan Lu and Jyoti Rahman1
Market sector productivity — the output produced perhour worked — grew at an annual rate of 3.2percent during the five years to 1998-99, which was the fastest rate on record. In the five years to 2003-04, productivity growth eased to 2.2 per cent per year, which is around the average rate over the past four decades. On balance, business cycle fluctuations, international developments, investment in physical and human capital (including information and communication technology), and the movement of labour across industries did not cause this easing in productivity growth. Rather, these trends are apparent within a number of industries: mining, construction, utilities, wholesale trade, communications and finance and insurance. A closer inspection of these industries suggests that, with the exception of mining, the recent trends at least partly reflect an easing of growth rates towards their historical averages after the unusual productivity surge of the late 1990s.
Introduction
Productivity growth is the main source of improvement in living standards in the long run. Australia’s current economic expansion has benefited from very strong growth in productivity. Labour productivity, output per hour worked, grew faster in the five years to 1998-99 (the late 1990s) than during any comparable period in the previous 30years. This strong productivity performance has generally been attributed to the effect of a range of micro and macroeconomic reforms over the past two decades. Increased competition drove new work practices and encouraged rapid uptake of new technologies in a macroeconomic environment that supported strong investment and steady growth. In the five years to 2003-04 (the early 2000s), however, productivity growth eased towards rates closer to the average of the past four decades.
An Australian Bureau of Statistics (ABS) publication (ABS, 2005) illustrates recent productivity trends in Australia. This paper looks at what might be behind those trends.
Some factors that might have affected recent productivity trends include: fluctuations in step with the business cycle; international technological changes; changes in investment in physical and human capital; the movement of labour across industries; and a set of supply-side shocks affecting a large proportion of the economy. Each of these factors are analysed in separate sections. It appears that none of these factors by themselves can explain the observed trend. Rather, productivity growth eased by different rates in different industries for different reasons.
Analysis of productivity trends is inherently difficult. Nonetheless, a number of papers have explored the Australian productivity experience. Valadkhani (2003) finds that in the long term, labour productivity is improved by various types of investment, openness to international trade and labour market reforms. Gruen (2001) notes the importance of opening up the domestic economy to international trade and adopting information and communication technologies (ICT) for the productivity pick-up of the 1990s. Parham (2004) adds increased R&D activity to openness and ICT as a source of the productivity surge. An alternative explanation for the strong performance is that the economy has avoided a recession in these years, and what is observed as a productivity surge might actually be unmeasured increase in work hours (Quiggin2001). Turning to the more recent experience, Parham (2005) argues that a range of unusual events such as the Sydney Olympics and Y2K may have hindered productivity growth since the end of the 1990s.
The tentative conclusion reached in this paper is that, in an historical context, the productivity surge of the late 1990s, rather than the most recent productivity cycle, appears to be the more unusual experience. However, this assessment may change: future developments in productivity will elucidate the causes and consequences of productivity trends over the past decade.
Before proceeding, terminology needs to be clarified. Productivity and labour productivity are used synonymously in what follows. Multi-factor productivity, the output produced from a given bundle of labour and capital, is specifically identified. Unless otherwise stated, productivity in the market sector of the economy is analysed. The market sector includes those industries in which the volume of output can be measured independently from the inputs into production. For example, the market sector includes industries such as mining and manufacturing, but not government administration.
The business cycle
Short-term productivity growth is difficult to interpret. It is very volatile from quarter to quarter and even over a year. This is clear from Chart1, which shows annual productivity growth in the market sector of the economy over the short, medium and long term. This volatility means that average rates of growth over a number of years provide a better gauge of the underlying pace of improvement in productivity.
Chart 1: Productivity growth(a)
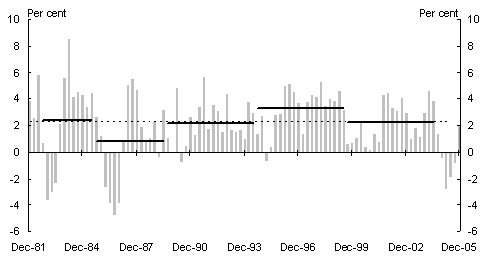
(a) The columns represent through-the-year growth; the solid lines represent annual average growth rates over the medium term (see the discussion); and the dotted line represents the annual average growth rate over the four decades to 2004-05. Annual average growth rates were: 2.4 per cent between 1981-82 and 1984-85, 0.8 per cent between 1984-85 and 1988-89, 2.2 per cent between 1988-89 and 1993-94, 3.2 per cent between 1993-94 and 1998-99, and 2.2 per cent between 1998-99and 2003-04. The annual average growth rate over the four decades to 2004-05 was 2.2percent.
Source: ABS National Accounts.
Interpretation is further complicated by the fact that productivity growth varies over the business cycle. The economy tends to move through periods of weak productivity growth, and sometimes declining productivity, every five years or so. For example, 2004-05 appears to have been one of these ‘weak periods’, with employment growing rapidly despite an easing in the rate of outputgrowth.
The cyclicality of the data means that some care is required in choosing the periods over which to average productivity growth. Comparing average rates of growth across a time that includes two weak periods with a time that includes none will give a misleading impression of underlying productivity growth.
The Australian Bureau of Statistics (ABS) attempts to account for these cyclical fluctuations by averaging rates of growth across identified ‘productivity growth cycles’. In general, these cycles are constructed to contain only one weak period, usually early in the cycle. This is achieved by choosing the last year of the cycle to be a peak in multi-factor productivity compared to its underlying trend and taking into account economic conditions more generally. A comparison of the two most recent productivity growth cycles shows that productivity has slowed since the late 1990s (Chart 1). Whereas productivity grew by 3.2percent peryear in the five years to 1998-99, the growth rate achieved in the five years to 2003-04 was 2.2per cent per year.
Averaging across productivity growth cycles is a statistical method of removing cyclical fluctuations from the data. However, there are a number of economic explanations for cyclical productivity patterns (Basu and Fernald 2000). One such explanation is that the intensity with which labour and capital are worked varies over the business cycle. Firms may choose to retain staff during economic downturns, even though there may not be sufficient demand for final products to keep staff working at peak capacity, to avoid hiring costs and
the loss of firm-specific skills. This process of ‘labour hoarding’ suggests that capacity utilisation measures may be a useful indicator of productivity growth cycles. A different explanation is that production technology fluctuates and these fluctuations are an important driver of the broader business cycle. Technological improvement also often motivates investment decisions, suggesting that investment rates may be another useful indicator of productivity growth cycles.
Chart 2 illustrates the development of the business cycle over the past two decades by comparing GDP growth with two different indicators: a measure of the number of firms producing above or below their normal capacity and the addition to the capital stock. As shown, the recession of the early 1990s accompanied weak investment and excess capacity in many firms.
Chart 2: Business cycle indicators
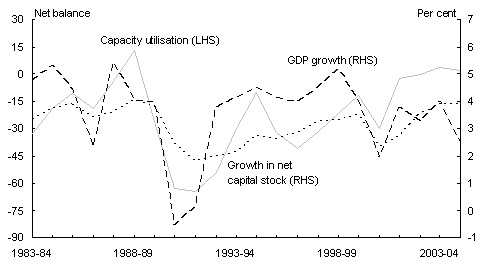
Source: ABS National Accounts; Australian Chamber of Commerce and Industry (ACCI).
Year-to-year movements in productivity over the past decade have no doubt been influenced by business cycle conditions. Nevertheless, both the late 1990s and early2000s were periods of economic expansion. The net rate of investment and the extent of capacity utilisation rose fairly steadily over that decade — they were both higher on average in the five years to 2003-04 than in the preceding five-year period. Since productivity growth had historically been positively related to both of these indicators, it is difficult to attribute the easing in the average rate of productivity growth in the more recent period to the business cycle. This suggests that the slowdown had deeper, structural determinants.
International developments
Australia’s productivity is affected by global technological changes. A slowdown in the pace of technological development will tend to slow productivity across the world.This has happened in the past. Chart 3 shows that productivity slowed, to varying degrees, across the OECD during the 1970s and 1980s (data are for whole economies, rather than the market sector measures used elsewhere in the paper).
Chart 3 also shows that Australia’s productivity performance since the early 1990s has been different from international patterns. Australia’s productivity revival of the 1990s preceded that of the UnitedStates and occurred despite a productivity slowdown elsewhere in the OECD. This suggests that the 1990s productivity revival may have been largely due to the easing of Australian domestic constraints on productivity growth, rather than a pickup in the pace of global technological change.
Chart 3: Annual average productivity growth(a)
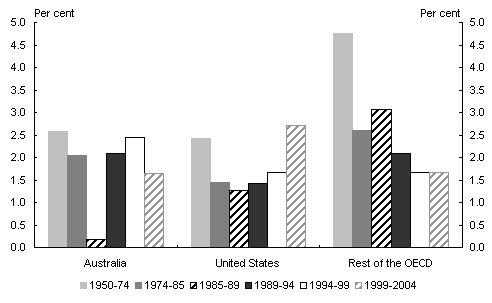
(a) Rest of the OECD are the 22 longest standing OECD member countries excluding Australia and the United States (New Zealand and Iceland data are not available for 1950). Periods are chosen to coincide approximately with the four most recent Australian productivity growth cycles.
Source: Groningen Growth and Development Centre and The Conference Board, January 2006.
The subsequent slowdown also appears to be a uniquely Australian experience. Productivity in the US accelerated over the same period. This acceleration was partly due to the US business cycle — the 2001 US recession was one of the mildest on record in terms of output but one of the sharpest since the GreatDepression in terms of employment — though the business cycle effects do not fully explain the productivity acceleration (Skoczylas and Tissot 2005). There was little change in productivity performance elsewhere in the OECD. It may be that the US economy is experiencing some structural changes that are not yet shared by other developed economies. Any productivity comparison should take this possibility into account.
The more salient point here is that there is no indication of a worldwide productivity slowdown since the end of the 1990s. This suggests that Australia’s recent productivity slowdown does not appear to have international origins.
Capital accumulation and multi-factor productivity
Investment decisions are important drivers of labour productivity growth. If workers are given better machines and equipment — that is, if there is capital-deepening — this will boost labour productivity. In addition to capital-deepening, labour productivity will also grow over time if there is an improvement in the efficiency with which capital and labour inputs are used in the production process — that is, if there is growth in multi-factor productivity.
Both the productivity surge of the late 1990s and the more recent slowdown were entirely driven by multi-factor productivity (Table 1). This suggests that the slowdown was not a result of an easing in investment.
Table 1: Decomposing annual labour productivity growth (per cent)
|
Labour productivity |
Multi-factor productivity |
Contribution of capital-deepening(a) |
|
|
1981-82 to 1984-85 |
2.4 |
1.2 |
1.2 |
|
1984-85 to 1988-89 |
0.8 |
0.7 |
0.1 |
|
1988-89 to 1993-94 |
2.2 |
0.9 |
1.2 |
|
1993-94 to 1998-99 |
3.2 |
2.1 |
1.2 |
|
1998-99 to 2003-04 |
2.2 |
1.0 |
1.2 |
(a) Percentage points.
Source: ABS National Accounts.
This simple decomposition of productivity growth would mask any possible role of changes in human capital. Human capital refers to the skills and knowledge of individual workers and their ability to use these skills and knowledge in the wider economy. Human capital improvement has probably added to productivity growth in Australia over the past couple of decades. Whereas around one-third of students completed high school in the early 1980s, this rose to around three-quarters by the mid-1990s. In turn, the number of Australian students completing post-graduate degrees has doubled over the past decade. This process has raised the stock of human capital.
It is very difficult to calculate the contribution that human capital makes to productivity. Nonetheless, the ABS has constructed an experimental quality adjusted labour index by assuming that productivity differences due to education and experience are proportional to wages. This experimental index suggests that labour quality has indeed made a positive contribution to Australia’s productivity gr
owth throughout the past couple of decades. Nonetheless, changes in labour quality do not explain recent productivity trends. Improvement in quality contributed a similar amount to productivity growth in the late 1990s (0.3 of a percentage point per year) as in the early 2000s (0.4 of a percentage point per year).
That is, while physical and human capital-deepening has steadily contributed to Australia’s productivity growth, multi-factor productivity has been the major driver of the late-1990s productivity surge and the subsequent slowdown.
It is multi-factor productivity that accounts for most of the income and growth differences across countries and across time periods (Easterly and Levine 2001). In Australia, much as in other developed countries, there is virtually no correlation between multi-factor productivity growth rates over the medium term. Along with Australia and the US, four other OECD countries — Denmark, Ireland, theNetherlands and Norway — experienced a productivity pickup in the 1990s (OECD2000). Their experiences in the current decade have differed markedly.
A period of strong multi-factor productivity growth is not typically followed by another similar period. This implies that the recent slowdown in multi-factor productivity should not come as a surprise. This also highlights the difficulty in forecasting future multi-factor productivity growth. Nevertheless, it is still possible, and important, to analyse past multi-factor productivity growth.
The series of broad and deep micro and macroeconomic reforms of recent decades underpinned the productivity revival of the 1990s. These reforms increased competition and gave Australian firms a more international focus. Competition encouraged both a more efficient allocation of resources and a more vigorous pursuit of productivity improvement through the adoption of new technologies. At the same time, more flexible labour markets allowed the reorganisation of work practices to take advantage of improvements in technology and skills, and more flexible financial markets gave new, developing industries access to the capital they required.
Many of these reforms might have lifted productivity levels in specific industries. For example, Productivity Commission (2005) modelling on the economy-wide impact of National Competition Policy suggested that observed productivity and price changes in selected infrastructure industries targeted by reform have boosted Australia’s GDP by 2.5 per cent. On the other hand, reforms may also have improved the economy’s long-run productivity growth rate by improving incentives for ongoing innovation. While these dynamic effects on annual productivity growth are likely to be smaller than the one-off improvement in the level of productivity, they may accumulate to a large effect over long periods of time.
The reforms enhanced Australia’s ability to adopt technologies developed overseas and reorganise workplaces towards world’s best practice. Australia’s productivity level, however, is only about 80to85per cent of that of the United States, a reasonable proxy for the global technological frontier. Policy differences or Australia’s remoteness explain only part of this productivity gap (Rahman 2005). This suggests that additional reforms are required to catch up further to the productivity level of the US.
A review of studies of the late-1990s surge pointed to three proximate factors — the use of ICT, R&D and openness — as making a more specific contribution to multi-factor productivity in that decade (Parham 2004). Has there been any change in the role of these factors during the current decade?
ICT is considered first. Over the 1990s, Australia was among the world’s leading users of ICT (OECD2005). This played an important part in the productivity surge of the 1990s (Simon and Wardrop 2002; Productivity Commission 2004; Revesz, Anderssen and Boldeman 2005).
Most simply, ICT affects productivity growth by providing workers with more and better quality equipment. The estimated contribution of ICT capital deepening to productivity growth has increased over every productivity growth cycle (ABS 2005). This suggests that the recent productivity slowdown was not caused by an easing of investment in ICT capital.
ICT might also affect multi-factor productivity. The use of ICT allows firms to develop new value-adding and efficiency-enhancing products, processes and organisational structures. However, such gains do not come automatically from the mere purchase of new hardware and software. To realise the full benefits of ICT investments, firms typically need to reorganise work assignments, retrain workers, develop new relationships with suppliers and modify their management systems. As a result, firms and industries typically differ in the timing and magnitude of their realisation of multi-factor productivity gains from ICT.
The ICT-related multi-factor productivity dividends realised during the late 1990s may have been larger than those realised in the current decade. One reason for this might be that the inventions that became available during the late 1990s, such as the Internet, were more beneficial than more recent inventions, such as Internet-enabled mobile telephony. Another reason might be that, by the late 1990s, firms had realised most of the benefits of an earlier set of inventions, such as electronic record-keeping systems, whereas some benefits of the Internet and other recent inventions are still to come.
According to Parham (2004), R&D is the second proximate factor that contributed to the late-1990s productivity surge. It is innovation that drives productivity growth in the long run. Innovation is the continual improvement of efficiency through learning-by-doing, improving management structure, reorganising work practices, adapting technologies to suit the firm’s needs and conducting R&D. Expenditure on R&D — an oft-used proxy for innovation — has remained steady as a percentage of GDP over the past decade. Although it is below the OECD average, there are not clear reasons to believe that Australia’s R&D intensity has been inappropriate during the current decade. To a significant degree, Australia’s R&D intensity is a result of its industry structure (Davisand Tunny 2005).
Finally considered is openness. Opening domestic markets to international trade encourages multi-factor productivity by allowing firms to specialise and achieve economies of scale. International competition also encourages inefficient firms to reform their work practices or exit the market. Trade also aids the process of technology transfer to the domestic economy.
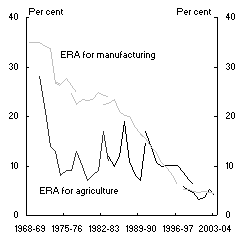
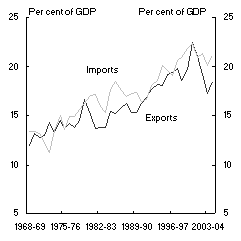
Australia embarked upon trade liberalisation in the early 1970s and by the early 2000s the effective rate of government assistance was very low. As trade barriers came down in Australia and around the world, exports and imports as a proportion of the economy rose (Chart 4).
Chart 4: Protection and openness
|
Chart 4a: Effective rates of assistance for manufacturing and agriculture(a) |
Chart 4b: Exports and imports |
|
|
|
(a) Breaks in series represent re-calculation of cost structures (that is, new production and intermediate usage data from the ABS
), giving different estimates for value added and therefore effective rates of assistance.
Source: Productivity Commission; ABS National Accounts.
While increased openness helped productivity growth during the 1990s, the puzzle is that the recent slowdown has happened despite continued openness. There is no particular reason to believe that the productivity benefits of increased openness have been fully realised. In recent years, productivity growth has accelerated in agriculture and manufacturing (Chart5 below), two of the industries most subject to international competition. Further, there is some recent empirical evidence that suggests openness can raise long-run growth rates (Frankel and Romer 1999).
The industry perspective
Productivity growth over time depends on both the growth in productivity within each industry and the effect of movements of labour between industries (as measured by the share of hours worked in each industry). Movements of labour affect productivity in the broader economy because different industries have different levels of capital intensity and multi-factor productivity. The movement of labour from industries with low productivity to industries with high productivity could raise productivity growth.
Did a movement of labour from high-productivity industries to low-productivity industries cause the productivity slowdown in the latest cycle? This question is answered by splitting annual average productivity growth over the two cycles into two components (Table 2). The first component measures the growth in productivity that would have resulted from productivity growth within each industry had the share of hours worked in each industry remained unchanged through the cycle. The second component is the effect that movements of labour between industries during the cycle had on labour productivity growth, holding labour productivity in each industry fixed at the initial levels.
Table 2: Productivity growth in the market sector — shift-share analysis (percent, peryear)(a)
|
Productivity growth: |
due to productivity growth within industries |
due to movements of employment between industries |
|
|
1993-94 to 1998-99 |
3.1 |
3.6 |
-0.4 |
|
1998-99 to 2003-04 |
2.3 |
2.5 |
0.1 |
|
Difference between the cycles(b) |
-0.7 |
-1.2 |
0.5 |
(a) Shares of hours worked are required to undertake this shift-share analysis, but the National Accounts contains only indices of hours worked. Hours worked series for each industry was constructed by growing 1998-99 levels of hours worked in each industry, sourced from the Labour Force Survey, in line with the National Accounts indices. The resulting productivity growth measures are slightly different from those reported elsewhere in the paper.
(b) Percentage points; five years to 2003-04 less five years to 1998-99, negative signifying a slowdown.
Source: ABS National Accounts and Labour Force Survey; authors’ calculations.
Movements of labour between industries had only a small effect on productivity growth in the early 2000s. Further, the very strong productivity growth during the late1990s occurred despite a movement of employment away from high-productivity industries into low-productivity industries. During that cycle, high-productivity industries such as mining and the utilities shed labour, while some low-productivity industries such as construction and the hospitality sector experienced an increase in hours worked. The movement of labour away from high-productivity industries did not continue in the most recent productivity cycle — both mining and the utilities experienced strong growth in hours worked in this period. However, this effect has not been sufficient to offset the slowdown in productivity within industries.
Therefore, to understand the nature of the recent productivity slowdown, an examination of productivity developments within each industry is required. In Chart5, the horizontal axis shows the annual average growth rate in productivity during the late 1990s, while the vertical axis shows the rate during the early 2000s. Industries are represented by dots. Industries that are below the diagonal line experienced a slowdown in productivity during the early 2000s compared with the late1990s.
Chart 5: Annual productivity growth by industry (percent)
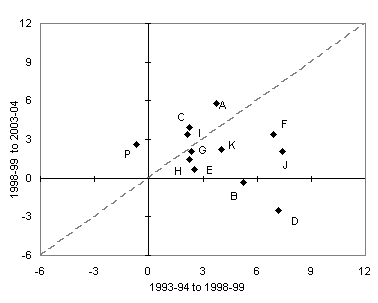
A=agriculture, forestry and fishing; B=mining; C=manufacturing; D=electricity, gas and water supply; E=construction; F=wholesale trade; G=retail trade; H=accommodation, cafes and restaurants; I=transport and storage; J=communication services; K=finance and insurance; P=cultural and recreational services.
Source: ABS National Accounts.
Each industry’s contribution to the aggregate productivity changes depends not only on the extent of the changes within the industry, but also its size. Table 3 illustrates this— the right-hand column shows the contribution to the aggregate productivity change by industry holding the share of hours worked unchanged from 1993-94. As shown, wholesale trade and construction contributed most heavily to the slowdown, with electricity, gas and water supply (utilities), communication services, mining and finance and insurance being the other significant contributors.
Table 3: Contribution to the change in productivity (late 1990s to early 2000s)
|
Change in productivity growth (percentage points)(a) |
Share of hours worked (percent)(b) |
Contribution (percentage points) |
|
|
Wholesale trade |
-3.50 |
10.5 |
-0.37 |
|
Construction |
-1.85 |
11.0 |
-0.20 |
|
Electricity, gas and water supply |
-9.69 |
1.7 |
-0.17 |
|
Communication services |
-5.34 |
2.5 |
-0.13 |
|
Mining |
-5.58 |
2.0 |
-0.11 |
|
Finance and insurance |
-1.82 |
5.9 |
-0.11 |
|
Retail trade |
-0.33 |
18.7 |
-0.06 |
|
Accommodation, cafes and restaurants |
-0.85 |
5.9 |
-0.05 |
|
Cultural and recreational services |
3.26 |
2.8 |
0.09 |
|
Transport and storage |
1.31 |
7.6 |
0.10 |
|
Agriculture, forestry and fishing |
2.09 |
9.2 |
0.19 |
|
Manufacturing |
1.67 |
22.0 |
0.37 |
(a) Five years to 2003-04 less five years to 1998-99, negative signifying a slowdown.
(b) Hours worked series for each industry was constructed by growing 1998-99 levels of hours worked in each industry, sourced from the Labour Force Survey, in line with the National Accounts indices.
Source: ABS National Accounts and Labour Force Survey; authors’ calculations.
Reforms, technological changes and other shocks
The Australian economy has been subject to a number of specific one-off shocks since the beginning of the current decade. These include the introduction of The New Tax System, the Sydney Olympics, a severe drought, and very high terms of trade. Parham(2005) concludes that these shocks adversely affected productivity in a range of industries.
Care needs to be taken in interpreting possible effects of such shocks, in particular to distinguish clearly between demand and supply-side shocks, and between short-term and medium to long-term effects. A demand-side shock should not have any impact on productivity over the medium term as businesses adjust their inputs accordingly. Some supply-side shocks, on the other hand, alter an industry’s productivity over the medium to long term. Yet others have a transitory effect — the recent drought sharply reduced agricultural output and productivity in 2002-03, but both had recovered by 2003-04.
It is difficult to make a comprehensive case that there was a series of common supply-side shocks that affected all the industries identified above during the early2000s. Rather, productivity slowed by different rates in different industries for different reasons. This is illustrated by using wholesale trade, construction and the utilities as examples.
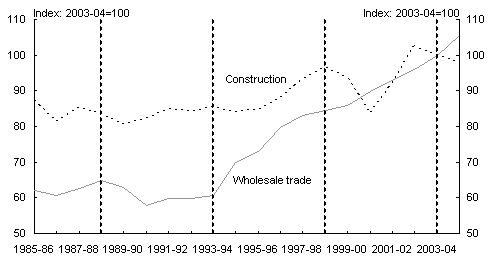
Wholesale trade experienced a marked improvement in the level and growth rates of productivity around 1994-95 (Chart6). The apparent productivity slowdown in the industry is a reflection of this earlier improvement. A combination of increased competition and technological change made this improvement possible (Johnston et al 2000). The industry, particularly the machinery and the motor vehicle wholesaling sub-industry, experienced increased price competition around 1994-95. This competitive pressure, flowing from tariff reductions in the early 1990s, may have prompted the increase in the level of productivity. Wholesale trade, along with retail trade and transport and storage, also benefited heavily from the use of ICT-related innovations during the 1990s. These innovations may have made it possible to sustain productivity growth since 1994-95.
Chart 6: Productivity in construction and wholesale trade
Source: ABS National Accounts.
Construction also experienced an increase in the level of productivity during the late1990s compared with the historical and international trend of stagnant productivity. The Sydney Olympics might have been a contributing factor during the late 1990s by increasing non-residential construction activity. The change in timing of construction activity around the introduction of The New Tax System in 2000 had a transitory effect on productivity (Chart6).
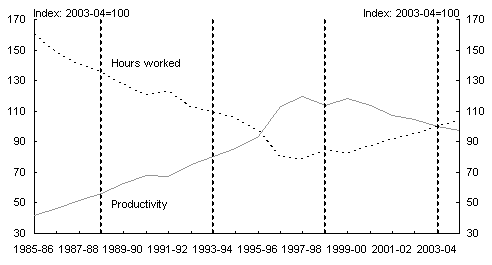
In utilities, the fall in productivity over recent years accompanied an increase in employment. This was a reversal of an earlier trend. Between 1984-85 and 1998-99, hours worked in utilities almost halved (Chart7). This was partly facilitated by the outsourcing of non-core services, but there were also very large improvements in efficiency. These improvements in efficiency have largely been attributed to a long sequence of reforms. Though different in each State and in each of electricity, gas and water, these reforms improved work practices in government enterprises, brought pricing more closely into line with costs, increased competition (such as through third-party access), raised incentives to improve productivity through privatisation and reform of organisational structures, and reduced the extent of excess capacity.
Chart 7: Productivity and hours worked in utilities
Source: ABS National Accounts.
Turning to more recent developments in the utilities industry, it is not entirely clear why employment of both capital and labour outpaced output, so that productivity fell. The increase in employment occurred within the electricity and gas industries; productivity developments in water supply partly reflect the water shortages in 2003-04. It is perhaps not surprising that the remarkably strong earlier rates of productivity growth have not been sustained. This remains an area of ongoing policy and regulatory reform, both within States and nationally through the Council of Australian Governments process.
In all three of these industries — wholesale trade, construction and utilities — the rates of productivity growth of the late 1990s appeared unusually high. In other industries that contributed significantly to the slowdown, the story appears to be similar. Productivity continued to grow solidly during the early 2000s in both finance and insurance and communications. However, the potential to continue to increase productivity variously through regulatory reform, computerisation, greater electronic delivery of services, and the popularisation of new means of communication (such as mobile telephony and the Internet) may have been more limited than during the 1990s.
On the surface, the productivity performance of the industries contributing to the slowdown during the five years to 2003-04 was not remarkable. One exception was perhaps in the mining industry. Rising commodity prices gave mining
companies an incentive to add labour to existing sites and invest in new facilities. This process may have lowered mining productivity while these facilities awaited completion. If this interpretation is correct, mining productivity may rise over coming years as output increases.
There are always some industries affected over the medium term by supply shocks. It could be the case that in the late 1990s a number of industries were subject to some positive shocks — such as microeconomic reforms or the introduction of ICT-related innovations — and that the subsequent productivity slowdown reflects the unwinding effects of those shocks on productivity growth rates.
Concluding remarks
This paper has tried to understand recent productivity trends. The reader is by now aware that the analysis has not arrived at a single cause of the easing in productivity growth over the five years to 2003-04, although several possible explanations have been ruled out. On balance, the easing in productivity growth cannot be obviously explained by business cycle fluctuations or international developments, suggesting that there were fundamental domestic factors at work. An easing of investment in physical or human capital (including ICT) did not cause the slowdown either. Nor was the slowdown a result of movements of labour into less productive industries.
Instead, these productivity trends are apparent within a number of industries: mining, construction, utilities, wholesale trade, communications and finance and insurance. A closer inspection of these industries has suggested that, with the exception of mining, recent productivity trends at least partly reflect an easing of growth rates towards their historical averages after the unusual productivity surge of the late 1990s.
The above-average productivity growth of the late 1990s permanently lifted the level of productivity, adding around $1,300 to GDP per person in 2003-04. It was underpinned by a series of broad and deep reforms, and assisted by ICT-related innovations. The economy is now more open, competitive and flexible, allowing it to take better advantage of future technological developments (including in ICT). Productivity growth over the latest cycle appears more consistent with long run averages.
It may be the case that many of the productivity benefits of these past reforms have already been realised. Future productivity trends will shed further light on this conjecture. Nevertheless, regardless of the causes of recent productivity trends, the future prosperity of the ageing population will depend on the economy’s ability to find new ways of adding to productivity.
References
ABS 2005, ‘Estimates of productivity in the Australian National Accounts’, Australian National Accounts: National Income, Expenditure and Product, 5206, September.
Basu, S & Fernald, J 2000, ‘Why is productivity procyclical? Why do we care?’, NBER Working Paper, no.7940, October.
Davis, G & Tunny, G 2005, ‘International comparisons of research and development’, Economic Roundup, Spring 2005, pp63-82.
Easterly, W & Levine, R 2001, ‘It’s not factor accumulation: stylized facts and growth models’, World Bank Economic Review, vol15, no.2, pp177-219.
Frankel, J & Romer, D 1999, ‘Does trade cause growth?’, American Economic Review, June, vol89, no.3, pp379-99.
Gruen D 2001, ‘Australia’s strong productivity growth: will it be sustained?’, Reserve Bank of Australia Bulletin, February, pp62-69.
Johnston, A, Porter, D, Cobbold, T & Dolamore, R 2000, Productivity in Australia’s wholesale and retail trade, Productivity Commission, Canberra.
OECD 2000, Is there a new economy? First report of the OECD Growth Project, Paris.
OECD 2005, OECD factbook: economic, environmental and social statistics, Paris.
Parham, D 2004, ‘Sources of Australia’s productivity revival’, The Economic Record, vol80, no.249, pp239-57.
Parham, D 2005, ‘Is Australia’s productivity surge over?’, Agenda, vol12,no.3, pp252-66.
Productivity Commission 2004, ICT use and productivity: a synthesis from studies of Australian firms, Commission research paper, Canberra.
Productivity Commission 2005, Review of National Competition Policy reforms, report number 33, Ausinfo, Canberra.
Quiggin, J 2001, ‘The Australian productivity miracle: a sceptical view’, Agenda, 8, pp333-48.
Rahman, J 2005, ‘Comparing Australian and United States productivity’, Economic Roundup, Autumn 2005, pp27-45.
Revesz, J Anderssen, H & Boldeman, L 2005, ‘Productivity growth in service industries’, occasional economic paper, Department of Communications, Information Technology and the Arts, April.
Simon, J & Wardrop S 2002, ‘Australian use of information technology and its contribution to growth’, Reserve Bank of Australia discussion paper, no.2002-02, January.
Skoczylas, L & Tissot, B 2005, ‘Revisiting recent productivity developments across OECD countries’, BIS working papers, no. 182, Bank for International Settlements, Basel, September.
Valadkhani, A 2003, ‘An empirical analysis of Australian labour productivity’, Australian Economic Papers, vol no.42, pp273-91.
1 Lan Lu is from Domestic Economy Division and Jyoti Rahman is from Macroeconomic Policy Division. At the time of writing, Ben Dolman worked in Macroeconomic Policy Division of the Australian Treasury. This article has benefited from comments and suggestions provided by Graeme Davis, David Gruen, Stewart Jones, Steven Kennedy, Paul O’Mara, David Parker, Gene Tunny, the authors’ colleagues in the Macro Dynamics Unit and participants at a number of internal Treasury presentations. The views in this article are those of the authors and not necessarily those of the Australian Treasury.
