Address to the Australian Industry Group’s Economy 2006 Forum by David Gruen, Chief Adviser (Domestic), Macroeconomic Group, Australian Treasury on 1March2006.1
The response of the economy to the current terms of trade boom is compared to its response to the comparably sized boom of the early 1970s. Across a range of dimensions, there are stark differences in the economy’s response to the two booms. It is argued that the current macroeconomic institutional arrangements — with a market-determined exchange rate, a credible medium-term inflation targeting regime implemented by the Reserve Bank, and more decentralised wage-setting arrangements — have a lot to do with the improved macroeconomic performance this time around. An implication of these current institutional arrangements, however, is that the market-determined exchange rate imposes significant restraint on those export and import-competing sectors, including parts of the manufacturing sector, which are not experiencing strongly rising prices for their output or are not directly exposed to the booming sectors of the economy.
Introduction
Thank you for the opportunity to speak to you this morning.
For those of us interested in the state of the economy, how it evolves and how best to manage it, we are living in interesting times.
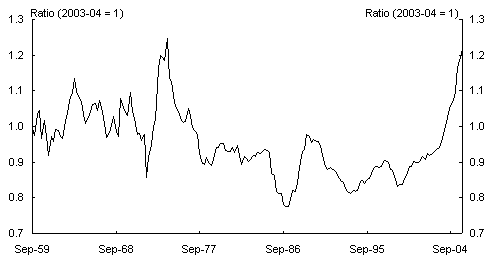
An important respect in which the times are interesting can be illustrated with the help of Chart 1, which shows Australia’s terms of trade — the ratio of the prices we receive for our exports to the prices we pay for our imports — for the whole period over which quarterly balance of payments statistics have been published, from September 1959 to December 2005.
Chart 1: Terms of trade
1959-2005
Source: Australian Bureau of Statistics, Balance of Payments and International Investment Position, cat.no.5302.0
Two terms of trade booms
We are currently experiencing a boom in Australia’s terms of trade, the likes of which we see only rarely — indeed only once before in the past fifty years. As the chart shows, that previous boom was in the early 1970s.
The current terms of trade boom is largely a consequence of big rises in the price Australia receives for some of its mineral exports — particularly iron ore and coal.2 The terms of trade boom in the 1970s was also caused by big rises in commodity export prices — but in that case, the commodity exports were predominantly agricultural. Thus, for example, over the year to September 1973, the Australian dollar price of wool rose by about 60percent, cereals and meat by about 40percent, and dried and canned fruits by 35percent; OECD (1974), p 11.
It is instructive to compare the response of the macroeconomy to the current boom in the terms of trade with its response to that earlier comparably sized boom. And it is this comparison on which I will focus my talk today.
An illuminating way to present the comparison is to examine different aspects of the economy at comparable times in the two booms. According to the September quarter 2005 National Accounts, the peak in the 1970s terms of trade boom was reached in the March quarter of 1974. In the current boom, the latest available data suggest that the terms of trade are still rising and we do not yet know when the peak will be reached.
For the purposes of the comparisons I wish to make here, I need estimates of the timing and height of the peak in the current boom in the terms of trade. For these estimates, I will use the Mid-Year Economic and Fiscal Outlook (MYEFO) forecasts, which imply a (gentle) peak in the March quarter 2006.3
So I will use these two dates, the March quarter 1974 and the March quarter 2006, as the quarters in which the terms of trade are assumed to have peaked in the two terms of trade booms.
For simplicity, these peak quarters are labelled ‘quarter 0’. Going back in time before the peak, the quarters are therefore labelled -1, -2, -3 etcetera, while after the peak, they are labelled 1, 2, 3 etcetera.
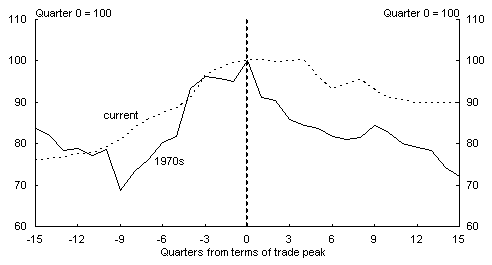
Chart 2 is then the first chart of this type. It shows the evolution of the terms of trade for 15 quarters both before and after ‘quarter 0’ (March 1974 or March 2006).
For each episode, the peak level of the terms of trade is indexed at ‘100’.4 A terms of trade level of 80 in a particular quarter, for example, then implies that the terms of trade in that quarter were 20percent below the peak achieved in that terms of trade boom.
Chart 2: Terms of trade
Sources: ABS cat. no. 5302.0 and Treasury. The MYEFO forecasts and projections are used for the assumed future evolution of the terms of trade.
As Chart 2 shows, the rise in the terms of trade is broadly similar in the two episodes, although it has been somewhat more gradual in the current boom than it was in the 1970s.5
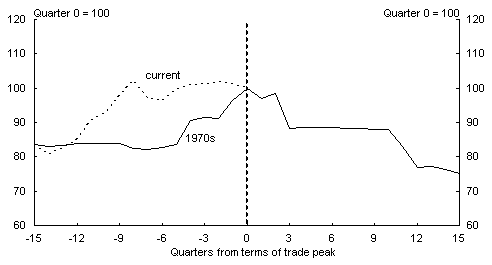
Moving from the terms of trade to the exchange rate is where things get interesting. Chart 3 shows the nominal trade weighted exchange rate over the same time periods as for the terms of trade chart. As was done for the terms of trade, the level of the exchange rate is indexed to 100 in quarter 0 for both episodes.
In the current episode, the exchange rate was rising strongly from about 12 quarters, or three years, before the peak in the terms of trade. Indeed, the exchange rate was rising strongly in the current episode before there had been much of a rise in the terms of trade.
Chart 3: Nominal exchange rate
(trade weighted index)
Source: Reserve Bank of Australia; Treasury. March quarter 2006 based on data up to 15 February 2006.
The foreign exchange market at the time was presumably making its best guesses about likely future developments. At the time, the exchange rate was rising strongly because the market was anticipating that the gathering strength of the world economy would sooner or later generate significant rises in the terms of trade of raw-material exporting countries like Australia. And as events unfolded, that anticipation turned out to be broadly correct.6
By contrast, there was almost no rise in the exchange rate in the 1970s until quarter’-4’, by which time the terms of trade had risen very sharply, imparting considerable stimulus to the economy, as we will see shortly.
The crucial difference between these two patterns of behaviour for the exchange rate is a consequence, of course, of the different institutional arrangements for determining its value. For the current terms of trade boom — indeed, since December 1983 — Australia has had a market-determined floating exchange rate. Furthermore, in coming to a view about the appropriate level of the exchange rate, the market’s view of the likely future path of inflation is informed by its understanding of the medium-term inflation target operated by the Reserve Bank. By contrast, both the value of the exchange rate and the conduct of monetary policy were under the direct control of the Federal govern
ment at the time of the previous terms-of-trade boom in the early 1970s.
And it is illuminating, for the story I am telling, to recall how federal governments in the early 1970s grappled with exchange rate policy.
In late 1971 — which is quarter ‘-9’ in our charts — there was intense public discussion of foreign exchange policy in Australia. At the time, export and import-competing industries — rural, mining and manufacturing — urged devaluation against the US dollar. A group of academic economists, by contrast, urged substantial appreciation. The federal government decided on an appreciation of the Australian dollar against the US dollar, but it was so small that the currency actually fell slightly in trade-weighted terms; OECD (1972, pp. 52-5 and Chart 3).7
As the terms of trade continued to rise strongly, the nominal exchange rate stayed essentially unchanged until December, 1972; late in quarter ‘-5’ in our nomenclature. The newly elected federal Labor Government of the day accepted the strong economic case for appreciating the Australian dollar but, aware of the likely unpopularity of the decision, timed its announcement for Saturday, 23 December, two days before Christmas, when most people were presumably busying themselves with something other than the foreign exchange value of the Australian dollar.8
There can be little doubt that a rising exchange rate causes pain for export and import-competing industries, especially those that have not enjoyed a significant rise in their own terms of trade. And it is therefore not surprising that governments find it extremely difficult to make explicit decisions to appreciate the currency, even in an environment in which the terms of trade are rising strongly. By contrast, if the value of the exchange rate is set by the market, no such considerations arise.
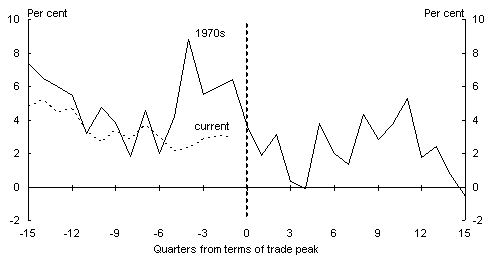
The next economic variable of interest in our comparison of the two terms of trade booms is real growth in the non-farm economy, shown in Chart 4. Focusing on the non-farm economy rather than the whole economy allows us to abstract from the effect of drought, which can have a significant influence on aggregate GDP and mask the underlying forces acting on the rest of the economy.9
Chart 4: Real non-farm GDP
(through-the-year growth)
Source: ABS, National Income, Expenditure and Product, cat. no. 5206.0.
Comparing the two episodes is again quite revealing. In the 1970s, the strongly rising terms of trade, combined with the absence of any restraint imposed on domestic activity by the exchange rate (since it did not appreciate at all until late in quarter ‘-5’) contributed to a substantial economic boom, with non-farm GDP estimated to have grown by a sizeable 8.8percent over the year to quarter ‘-4’, at a time when the economy was already operating close to full capacity. The contrast with economic activity in the current terms of trade boom is a stark one — with much less volatility and no signs of boom conditions in the aggregate economy despite strongly rising terms of trade.
Of course, the behaviour of the exchange rate is not the only difference between the two episodes. The waning of the housing boom has clearly contributed to more modest outcomes for economic growth in the current episode. But the floating exchange rate, together with the credible macroeconomic policy framework, has also made a big contribution to the enhanced stability of the macroeconomy this time around.10
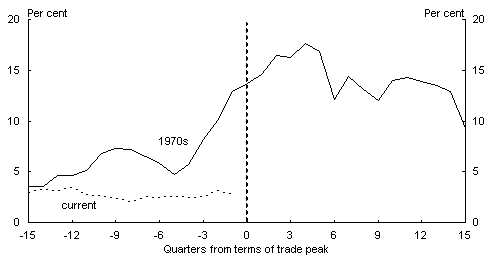
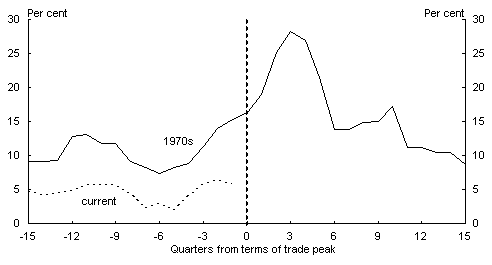
The next two charts complement each other. Chart 5 shows the behaviour of consumer price inflation and Chart 6 the growth in male average weekly earnings.11
Consumer price inflation was already running quite strongly at the beginning of the 1970s before the terms of trade began to rise sharply. And the same is true of growth in male average weekly earnings.
While these outcomes were unfavourable, they were merely the prelude to much more unfavourable outcomes, as the two charts show. In the aftermath of the terms of trade induced economic boom, wages growth accelerated extremely sharply in 1974, fuelling a continuation of double-digit consumer price inflation and generating a sharp rise in real wages, which cast a long shadow in the labour market as we will see shortly.12 Again, the contrast with inflation and wage outcomes in the current episode is a stark one.
Chart 5: Consumer price inflation
(through-the-year)
Source: ABS, Consumer price index, cat. no. 6401.0.
Chart 6: Male average weekly earnings
(through-the-year percentage growth)
Source: ABS, Average Weekly Earnings, cat. no. 6302.0.
There were, of course, other important differences between the two episodes. The first OPEC oil price shock also hit the Australian economy in the March quarter 1974, resulting in a near quadrupling in the Australian dollar price of oil in that quarter — an oil shock of a rather different magnitude from the current one.
Furthermore, as has been widely recognised, the centralised wage fixing system operating in the 1970s played a role in transmitting demand pressures in some sectors of the economy to aggregate wage outcomes across the whole economy. By contrast, the significantly more decentralised wage-setting arrangements currently in place have enabled wage outcomes to more closely match sectoral demand-supply balances, with fewer implications for aggregate wage outcomes.
So it would be an overstatement to claim that the rise in Australian inflation and wage growth during this 1970s episode was solely a consequence of the price rises and the economic boom generated by the rising Australian terms of trade. But it is not an overstatement to claim that economic outcomes would have been much more favourable had the exchange rate responded as it did in the current terms of trade boom, rather than remaining essentially unchanged until late in quarter ‘-5’, as it did in the 1970s.
This alternative exchange rate response would have had two important consequences. Firstly, it would have put direct downward pressure on consumer price inflation (via lower import prices) as the terms of trade were rising strongly, which would have put a significant brake on what was rapidly becoming a savage wage-price spiral. And secondly, it would have tempered the economic boom that eventuated as the terms of trade were rising (Chart 4), thereby also tempering the eventual inflationary consequences of that boom.
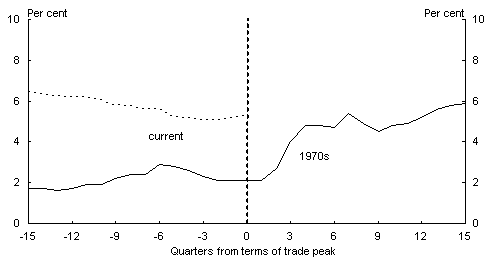
The final comparative chart, Chart 7, shows the unemployment rate for the two episodes. Unemployment was extremely low in the lead up to the 1970s terms of trade boom, as it had been for most of the previous two decades. With the sharp rise in real wages in 1974, however, unemployment also rose sharply. By late 1977, the end of the period shown for the 1970s episode, the unemployment rate had risen above 5percent. Over the next nearly thirty years to the present, it did not fall back below 5percent until eighteen months ago in Octobe
r 2004.13
While the mishandling of the terms of trade boom of the early 1970s cannot be held responsible for the unemployment rate for the next thirty years, it probably can be held responsible, at to least some extent, for poor unemployment outcomes for most of the next decade.14
Chart 7: Unemployment rate
Sources: ABS, Labour Force, cat. no. 6202.0 and Treasury. March quarter 2006 based on January outcome.
Lessons
A comparison of macroeconomic outcomes during the current terms of trade boom with those during the boom of the early 1970s provides a clear illustration of what is, at its essence, a simple proposition.
If the economic environment is generating a sizeable boom in one part of the economy, significant restraint needs to be imposed on other parts to ensure that the economy overall does not overheat.
In the 1970s, the Federal Government was in direct control of all arms of macroeconomic policy, including the value of the exchange rate. At a time when commodity prices were rising strongly, generating boom conditions for those sectors whose prices were rising, it proved extremely difficult for governments of either political persuasion to impose sufficient restraint on other parts of the economy to deliver an appropriate outcome for the economy overall.
Compared with that set of institutional arrangements, the current set of arrangements, with a market-determined exchange rate, a credible medium-term inflation targeting regime implemented at the discretion of an independent Reserve Bank, and more decentralised wage-setting arrangements, seems a crucial improvement.
A consequence of the current institutional arrangements, however, is that at times when commodity prices are rising strongly, or are anticipated to do so, the floating exchange rate is likely to appreciate significantly. The exchange rate plays the role of a shock absorber, reducing the expansionary effects of the terms of trade rise on the overall economy. As a consequence, ‘activist’ macroeconomic management becomes unnecessary — witness the tiny percent rise in the policy interest rate combined with little change in the stance of fiscal policy over the past two years. An important advantage of this absence of macro-policy activism is, of course, that it reduces the possibility of policy errors.
The exchange rate plays its shock-absorber role primarily, however, by imposing significant restraint on those export and import-competing sectors, including parts of the manufacturing sector, which are not experiencing strongly rising prices for their output or are not directly exposed to the booming sectors of the economy. (Indeed, some parts of manufacturing are experiencing long-term falls in their output prices which are also contributing, albeit gradually, to the favourable developments in the terms of trade.)
Some have argued that we are at the early stages of a super-cycle in which, even with a rising supply of commodities, the industrialisation of China and India will create so much demand that commodity prices will remain higher for longer than in a standard cycle; see, for example, Blythe (2006). If so, then the restraint currently being imposed by the exchange rate on export and import-competing sectors is also likely to continue for quite some time.
As we have seen, the 1970s terms of trade boom ended badly — with a big rise in inflation, an economic bust during which through-the-year growth in non-farm GDP briefly turned negative, as well as adverse longer-term implications for unemployment. This time around, the economic outcomes during the terms of trade upswing have been starkly different. Inflation outcomes have remained moderate and, notwithstanding some booming sectors and regions, boom conditions in the aggregate economy are notable for their absence.
Having avoided the aggregate boom during the current terms of trade upswing, as well as its inflationary consequences, there are grounds for optimism that Australia can also avoid a subsequent bust. When the terms of trade fall at some time in the future — which seems the most plausible current forecast even allowing for the possibility of a super-cycle — there will be adverse implications for some sectors of the economy, as well as a likely significant slowing in tax revenue growth as nominal GDP growth slows.15 But the institutional frameworks currently in place, which were described earlier, enhance the prospects that an end to the terms of trade boom need not derail the aggregate economy — for the same reasons that the terms of trade upswing did not do so.
The current institutional frameworks represent a crucial improvement on those in place in the 1970s. They have helped mute the business cycle. They cannot, however, deliver us a bullet-proof economy. Sufficiently large shocks, or macroeconomic policy mistakes, can still occur and can still generate severe macroeconomic difficulties. A decade and a half of good macroeconomic outcomes without a recession is an impressive achievement. But it should not tempt us to embrace the dubious proposition that the business cycle has been consigned to the dustbin of history.
References
Blythe, M 2006, ‘Terms of trade bust?’, Economic Issues, Commonwealth Bank, 20February.
Grant, A, Hawkins, J and Shaw, L 2005, ‘Mining and commodities exports’, Economic Roundup, Spring, Treasury, pp1-15.
Hughes, B 1980, Exit Full Employment, Angus and Robertson.
Organisation for Economic Co-operation and Development 1972, 1974, Economic Surveys: Australia, Paris.
Stone, A, Wheatley, T and Wilkinson, L 2005, ‘A small model of the Australian macroeconomy: an update’, Research Discussion Paper, no. 2005-11, Reserve Bank of Australia, December.
Walsh, M 1972, ‘Now for a mini-budget’, Australian Financial Review, 27 December, p1.
1 I am grateful to Oliver Richards for enthusiastic assistance in putting this talk together, and to Nicholas Gruen, John Hawkins, Steven Kennedy, Paul O’Mara and David Parker for helpful comments. The views expressed are those of the author and not necessarily those of the Australian Treasury.
2 Aspects of Australia’s mining exports are discussed in the article by Grant, Hawkins and Shaw in the Spring 2005 issue of the Economic Roundup.
3 For the current episode, terms of trade data from the September quarter 2005 Balance of Payments release are used, as well as the MYEFO forecasts and projections for the assumed future evolution of the terms of trade, which were based on the September quarter release.
4 The MYEFO forecasts imply a level of the terms of trade at its March 2006 peak less than 3percent below its March 1974 peak.
5 Of course, this statement is predicated on having identified the timing and size of the current peak with reasonable accuracy.
6 A chart of the real trade-weighted exchange rate looks similar to Chart 3, at least for quarters up to quarter 0, because movements in the real exchange rate are dominated by movements in the nominal rate over these periods. On a different point, there may have been another influence tending to appreciate the exchange rate early in the current terms of trade upswing. Having fallen to an anomalously low l
evel in 2000 and 2001 — indeed, to a level that remains hard to explain with the benefit of hindsight; Stone, Wheatley and Wilkinson (2005)— some of the subsequent appreciation may simply have been the gradual unwinding of this earlier anomalous behaviour.
7 The terms of trade were at a local minimum in quarter ‘-9’ in the 1970s, as Chart 2 shows. But there was, nevertheless, a strong improvement in the trade balance and a sharp acceleration in capital inflow at the time, which put significant upward pressure on the currency; OECD (1972), pp50-2.
8 The appreciation on 23 December 1972, by 7.05percent, was decided by three senior ministers rather than the whole Cabinet — another sign of how difficult it was for governments to make such decisions; Walsh (1972). There were subsequent appreciations in February and September 1973, as well as a 25percent across-the-board tariff cut in July 1973, which were all designed to reduce the strong stimulus to domestic economic activity being provided by the external sector; Hughes (1980), pp 62-4.
9 A focus on the non-farm economy remains informative even though the terms of trade boom in the 1970s was predominantly in agricultural commodities. Over the years we are examining, drought affected farm production in 1969-70, 1970-71, and in the years following 2002-03.
10 Another difference between the two episodes is also worth recording. Some of the proceeds from the current terms of trade boom accrue to predominantly foreign-owned mining companies which, if they are not reinvested, are not likely to be spent on Australian goods and services. By contrast, the proceeds from the previous terms of trade boom accrued predominantly to Australian farmers. With a highly regulated financial system at the time, many of these farmers were credit-constrained and hence spent, rather than saved, a significant share of their temporarily higher incomes.
11 Data on male average weekly earnings for all employees are used because they are the only easily available wage data going back before the 1970s terms of trade boom.
12 ‘Adult male earnings rose by 31percent during the year [1974], which would have been the highest on record during the 20th century were it not for the fact that female pay rates rose even more’; Hughes (1980) , p69.
13 That is, apart from the month of June 1981 when unemployment was 5.4percent.
14 The level of real unit labour costs in the economy, having risen sharply in 1974, did not return to its pre-terms-of-trade boom levels until the second half of the 1980s.
15 The tax revenue projections for MYEFO are based on an assumed significant slowing in nominal GDP growth. They assume year-average nominal GDP growth of 4percent in 2007-08 and 2008-09 which, if realised, would be the slowest nominal growth since 1990-91 and 1991-92.