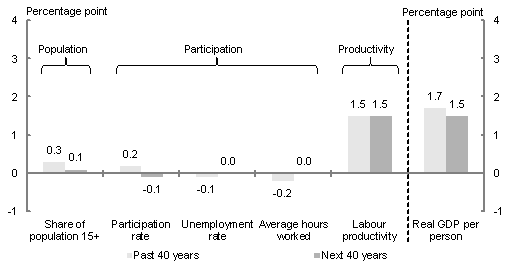
Chart 1 Components of real GDP growth per person

Source: ABS cat. no. 5206.0, 6202.0 and Treasury projections.
| Percentage points contribution, annual average | Share of population 15+ | Participation rate | Unemployment rate | Average hours worked | Labour productivity | Real GDP per person |
|---|---|---|---|---|---|---|
| Past 40 years | 0.3 | 0.2 | -0.1 | -0.2 | 1.5 | 1.7 |
| Next 40 years | 0.1 | -0.1 | 0 | 0 | 1.5 | 1.5 |
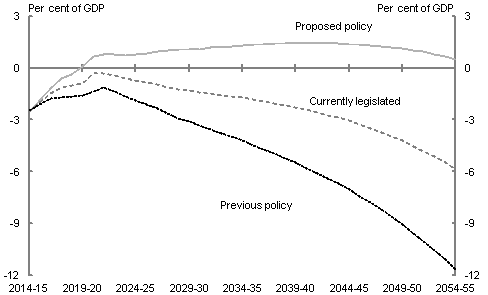
Chart 2 Underlying cash balance

Note: Net Future Fund earnings are included in projections of the underlying cash balance from 2020–21.
Source: Treasury projections. Projections assume trend economic growth from 2021–22 to 2054–55.
| Proposed policy | Currently legislated | Previous policy | |
|---|---|---|---|
| 2014-15 | -2.5 | -2.5 | -2.5 |
| 2015-16 | -1.9 | -2.0 | -2.1 |
| 2016-17 | -1.2 | -1.5 | -1.8 |
| 2017-18 | -0.6 | -1.1 | -1.7 |
| 2018-19 | -0.4 | -1.0 | -1.6 |
| 2019-20 | 0.1 | -0.9 | -1.6 |
| 2020-21 | 0.7 | -0.3 | -1.3 |
| 2021-22 | 0.8 | -0.3 | -1.1 |
| 2022-23 | 0.8 | -0.4 | -1.3 |
| 2023-24 | 0.7 | -0.6 | -1.6 |
| 2024-25 | 0.8 | -0.7 | -1.8 |
| 2025-26 | 0.9 | -0.8 | -2.1 |
| 2026-27 | 0.9 | -0.9 | -2.3 |
| 2027-28 | 1.1 | -1.1 | -2.6 |
| 2028-29 | 1.1 | -1.2 | -2.9 |
| 2029-30 | 1.1 | -1.3 | -3.1 |
| 2030-31 | 1.1 | -1.4 | -3.3 |
| 2031-32 | 1.2 | -1.5 | -3.5 |
| 2032-33 | 1.2 | -1.6 | -3.8 |
| 2033-34 | 1.3 | -1.6 | -4.0 |
| 2034-35 | 1.3 | -1.7 | -4.2 |
| 2035-36 | 1.4 | -1.8 | -4.5 |
| 2036-37 | 1.4 | -1.9 | -4.7 |
| 2037-38 | 1.4 | -2.0 | -5.0 |
| 2038-39 | 1.4 | -2.1 | -5.2 |
| 2039-40 | 1.4 | -2.3 | -5.5 |
| 2040-41 | 1.4 | -2.4 | -5.8 |
| 2041-42 | 1.4 | -2.6 | -6.1 |
| 2042-43 | 1.4 | -2.7 | -6.4 |
| 2043-44 | 1.4 | -2.9 | -6.7 |
| 2044-45 | 1.4 | -3.1 | -7.0 |
| 2045-46 | 1.3 | -3.3 | -7.4 |
| 2046-47 | 1.3 | -3.5 | -7.8 |
| 2047-48 | 1.3 | -3.7 | -8.2 |
| 2048-49 | 1.2 | -3.9 | -8.6 |
| 2049-50 | 1.1 | -4.2 | -9.0 |
| 2050-51 | 1.0 | -4.5 | -9.6 |
| 2051-52 | 0.9 | -4.8 | -10.0 |
| 2052-53 | 0.8 | -5.1 | -10.6 |
| 2053-54 | 0.7 | -5.5 | -11.1 |
| 2054-55 | 0.5 | -5.8 | -11.7 |

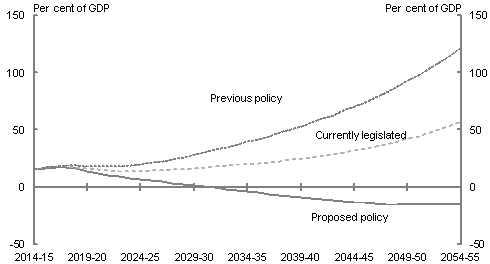
Note: The projections of net debt include net interest payments.
Source: Treasury projections. Projections assume trend economic growth from 2021–22 to 2054–55.
| Proposed policy | Currently legislated | Previous policy | |
|---|---|---|---|
| 2014-15 | 15.2 | 15.4 | 15.4 |
| 2015-16 | 16.7 | 17.0 | 17.0 |
| 2016-17 | 17.2 | 17.8 | 18.1 |
| 2017-18 | 17.0 | 18.0 | 18.9 |
| 2018-19 | 15.9 | 17.5 | 18.9 |
| 2019-20 | 14.0 | 16.4 | 18.4 |
| 2020-21 | 11.8 | 15.0 | 17.9 |
| 2021-22 | 10.2 | 14.2 | 17.7 |
| 2022-23 | 8.8 | 13.8 | 18.0 |
| 2023-24 | 7.8 | 13.7 | 18.8 |
| 20 24-25 |
6.7 | 13.8 | 19.8 |
| 2025-26 | 5.6 | 14.1 | 21.1 |
| 2026-27 | 4.5 | 14.5 | 22.6 |
| 2027-28 | 3.4 | 15.0 | 24.3 |
| 2028-29 | 2.4 | 15.7 | 26.2 |
| 2029-30 | 1.3 | 16.4 | 28.2 |
| 2030-31 | 0.3 | 17.0 | 30.3 |
| 2031-32 | -0.8 | 17.8 | 32.4 |
| 2032-33 | -1.9 | 18.5 | 34.7 |
| 2033-34 | -2.9 | 19.3 | 37.1 |
| 2034-35 | -4.0 | 20.2 | 39.6 |
| 2035-36 | -5.1 | 20.9 | 42.0 |
| 2036-37 | -6.1 | 21.9 | 44.7 |
| 2037-38 | -7.2 | 22.8 | 47.4 |
| 2038-39 | -8.2 | 23.8 | 50.2 |
| 2039-40 | -9.1 | 24.9 | 53.2 |
| 2040-41 | -10.1 | 26.0 | 56.3 |
| 2041-42 | -10.9 | 27.3 | 59.6 |
| 2042-43 | -11.8 | 28.7 | 63.0 |
| 2043-44 | -12.5 | 30.2 | 66.7 |
| 2044-45 | -13.2 | 31.8 | 70.5 |
| 2045-46 | -13.8 | 33.4 | 74.3 |
| 2046-47 | -14.4 | 35.3 | 78.6 |
| 2047-48 | -14.8 | 37.4 | 83.0 |
| 2048-49 | -15.2 | 39.6 | 87.8 |
| 2049-50 | -15.4 | 42.1 | 92.8 |
| 2050-51 | -15.6 | 44.6 | 97.8 |
| 2051-52 | -15.6 | 47.4 | 103.4 |
| 2052-53 | -15.5 | 50.5 | 109.3 |
| 2053-54 | -15.3 | 53.7 | 115.4 |
| 2054-55 | -15.0 | 57.2 | 121.9 |