Chart 2.1 Underlying cash balance
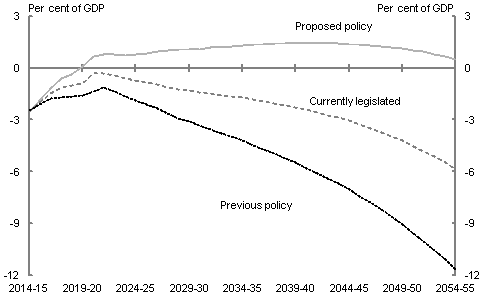
Note: Net Future Fund earnings are included in projections of the underlying cash balance from 2020–21.
Source: Treasury projections. Projections assume trend economic growth from 2021–22 to 2054–55.
| Proposed policy | Currently legislated | Previous policy | |
|---|---|---|---|
| 2014‑15 | ‑2.5 | ‑2.5 | ‑2.5 |
| 2015‑16 | ‑1.9 | ‑2.0 | ‑2.1 |
| 2016‑17 | ‑1.2 | ‑1.5 | ‑1.8 |
| 2017‑18 | ‑0.6 | ‑1.1 | ‑1.7 |
| 2018‑19 | ‑0.4 | ‑1.0 | ‑1.6 |
| 2019‑20 | 0.1 | ‑0.9 | ‑1.6 |
| 2020‑21 | 0.7 | ‑0.3 | ‑1.3 |
| 2021‑22 | 0.8 | ‑0.3 | ‑1.1 |
| 2022‑23 | 0.8 | ‑0.4 | ‑1.3 |
| 2023‑24 | 0.7 | ‑0.6 | ‑1.6 |
| 2024‑25 | 0.8 | ‑0.7 | ‑1.8 |
| 2025‑26 | 0.9 | ‑0.8 | ‑2.1 |
| 2026‑27 | 0.9 | ‑0.9 | ‑2.3 |
| 2027‑28 | 1.1 | ‑1.1 | ‑2.6 |
| 2028‑29 | 1.1 | ‑1.2 | ‑2.9 |
| 2029‑30 | 1.1 | ‑1.3 | ‑3.1 |
| 2030‑31 | 1.1 | ‑1.4 | ‑3.3 |
| 2031‑32 | 1.2 | ‑1.5 | ‑3.5 |
| 2032‑33 | 1.2 | ‑1.6 | ‑3.8 |
| 2033‑34 | 1.3 | ‑1.6 | ‑4.0 |
| 2034‑35 | 1.3 | ‑1.7 | ‑4.2 |
| 2035‑36 | 1.4 | ‑1.8 | ‑4.5 |
| 2036‑37 | 1.4 | ‑1.9 | ‑4.7 |
| 2037‑38 | 1.4 | ‑2.0 | ‑5.0 |
| 2038‑39 | 1.4 | ‑2.1 | ‑5.2 |
| 2039‑40 | 1.4 | ‑2.3 | ‑5.5 |
| 2040‑41 | 1.4 | ‑2.4 | ‑5.8 |
| 2041‑42 | 1.4 | ‑2.6 | ‑6.1 |
| 2042‑43 | 1.4 | ‑2.7 | ‑6.4 |
| 2043‑44 | 1.4 | ‑2.9 | ‑6.7 |
| 2044‑45 | 1.4 | ‑3.1 | ‑7.0 |
| 2045‑46 | 1.3 | ‑3.3 | ‑7.4 |
| 2046‑47 | 1.3 | ‑3.5 | ‑7.8 |
| 2047‑48 | 1.3 | ‑3.7 | ‑8.2 |
| 2048‑49 | 1.2 | ‑3.9 | ‑8.6 |
| 2049‑50 | 1.1 | ‑4.2 | ‑9.0 |
| 2050‑51 | 1.0 | ‑4.5 | ‑9.6 |
| 2051‑52 | 0.9 | ‑4.8 | ‑10.0 |
| 2052‑53 | 0.8 | ‑5.1 | ‑10.6 |
| 2053‑54 | 0.7 | ‑5.5 | ‑11.1 |
| 2054‑55 | 0.5 | ‑5.8 | ‑11.7 |
Chart 2.2 Total Australian Government spending
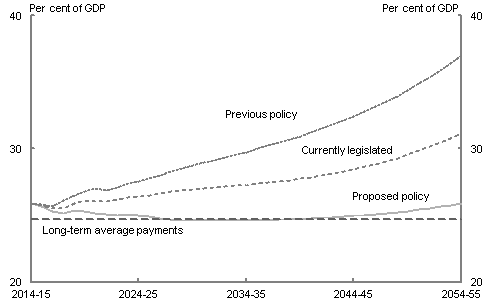
Notes: The long–term average payments–to–GDP ratio is 24.7 per cent of GDP, calculated over a 40 year period from 1974–75 to 2013–14.
Source: Treasury projections. Projections assume trend economic growth from 2021–22 to 2054–55.
| Proposed policy | Currently legislated | Previous policy | Long-term average payments | |
|---|---|---|---|---|
| 2014‑15 | 25.9 | 25.9 | 25.9 | 24.7 |
| 2015‑16 | 25.7 | 25.8 | 25.8 | 24.7 |
| 2016‑17 | 25.3 | 25.5 | 25.7 | 24.7 |
| 2017‑18 | 25.2 | 25.5 | 26.1 | 24.7 |
| 2018‑19 | 25.4 | 25.9 | 26.5 | 24.7 |
| 2019‑20 | 25.3 | 26.1 | 26.8 | 24.7 |
| 2020‑21 | 25.2 | 26.1 | 27.1 | 24.7 |
| 2021‑22 | 25.1 | 26.1 | 26.9 | 24.7 |
| 2022‑23 | 25.0 | 26.2 | 27.1 | 24.7 |
| 2023‑24 | 25.1 | 26.4 | 27.4 | 24.7 |
| 2024‑25 | 25.0 | 26.4 | 27.6 | 24.7 |
| 2025‑26 | 2 4.9 | 26.5 | 27.8 | 24.7 |
| 2026‑27 | 24.8 | 26.6 | 28.0 | 24.7 |
| 2027‑28 | 24.7 | 26.8 | 28.3 | 24.7 |
| 2028‑29 | 24.6 | 26.9 | 28.5 | 24.7 |
| 2029‑30 | 24.6 | 27.0 | 28.7 | 24.7 |
| 2030‑31 | 24.6 | 27.0 | 28.9 | 24.7 |
| 2031‑32 | 24.6 | 27.1 | 29.1 | 24.7 |
| 2032‑33 | 24.6 | 27.2 | 29.3 | 24.7 |
| 2033‑34 | 24.6 | 27.2 | 29.6 | 24.7 |
| 2034‑35 | 24.6 | 27.3 | 29.8 | 24.7 |
| 2035‑36 | 24.6 | 27.4 | 30.0 | 24.7 |
| 2036‑37 | 24.6 | 27.5 | 30.2 | 24.7 |
| 2037‑38 | 24.7 | 27.5 | 30.5 | 24.7 |
| 2038‑39 | 24.7 | 27.6 | 30.7 | 24.7 |
| 2039‑40 | 24.7 | 27.7 | 31.0 | 24.7 |
| 2040‑41 | 24.8 | 27.9 | 31.3 | 24.7 |
| 2041‑42 | 24.8 | 28.0 | 31.5 | 24.7 |
| 2042‑43 | 24.9 | 28.2 | 31.8 | 24.7 |
| 2043‑44 | 24.9 | 28.3 | 32.1 | 24.7 |
| 2044‑45 | 25.0 | 28.5 | 32.4 | 24.7 |
| 2045‑46 | 25.0 | 28.7 | 32.8 | 24.7 |
| 2046‑47 | 25.1 | 28.9 | 33.2 | 24.7 |
| 2047‑48 | 25.2 | 29.1 | 33.5 | 24.7 |
| 2048‑49 | 25.2 | 29.3 | 33.9 | 24.7 |
| 2049‑50 | 25.3 | 29.5 | 34.4 | 24.7 |
| 2050‑51 | 25.4 | 29.9 | 34.9 | 24.7 |
| 2051‑52 | 25.5 | 30.1 | 35.4 | 24.7 |
| 2052‑53 | 25.6 | 30.5 | 35.9 | 24.7 |
| 2053‑54 | 25.8 | 30.8 | 36.4 | 24.7 |
| 2054‑55 | 25.9 | 31.2 | 37.0 | 24.7 |
Chart 2.3 Primary cash balance
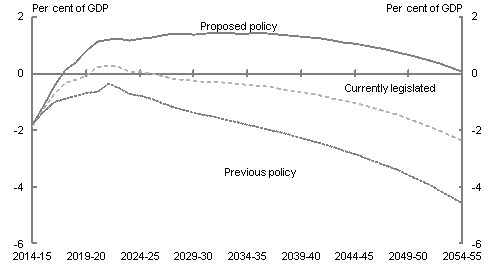
Note: The projections are of the primary cash balance (which excludes net interest payments and net Future Fund earnings).
Source: Treasury projections. Projections assume trend economic growth from 2021–22 to 2054–55.
| Proposed policy | Currently legislated | Previous policy | |
|---|---|---|---|
| 2014‑15 | ‑1.8 | ‑1.8 | ‑1.8 |
| 2015‑16 | ‑1.1 | ‑1.3 | ‑1.3 |
| 2016‑17 | ‑0.4 | ‑0.7 | ‑1.0 |
| 2017‑18 | 0.1 | ‑0.3 | ‑0.9 |
| 2018‑19 | 0.4 | ‑0.2 | ‑0.8 |
| 2019‑20 | 0.8 | ‑0.1 | ‑0.7 |
| 2020‑21 | 1.1 | 0.2 | ‑0.6 |
| 2021‑22 | 1.2 | 0.3 | ‑0.4 |
| 2022‑23 | 1.2 | 0.2 | ‑0.5 |
| 2023‑24 | 1.1 | 0.1 | ‑0.7 |
| 2024‑25 | 1.2 | 0.1 | ‑0.8 |
| 2025‑26 | 1.3 | 0.0 | ‑0.9 |
| 2026‑27 | 1.3 | ‑0.1 | ‑1.0 |
| 2027‑28 | 1.4 | ‑0.2 | ‑1.2 |
| 2028‑29 | 1.4 | ‑0.2 | ‑1.3 |
| 2029‑30 | 1.4 | ‑0.3 | ‑1.4 |
| 2030‑31 | 1.4 | ‑0.3 | ‑1.5 |
| 2031‑32 | 1.4 | ‑0.3 | ‑1.5 |
| 2032‑33 | 1.4 | ‑0.3 | ‑1.6 |
| 2033‑34 | 1.4 | ‑0.4 | ‑1.7 |
| 2034‑35 | 1.4 | ‑0.4 | ‑1.8 |
| 2035‑36 | 1.4 | ‑0.4 | ‑1.9 |
| 2036‑37 | 1.4 | ‑0.5 | ‑2.0 |
| 2037‑38 | 1.4 | ‑0.5 | ‑2.1 |
| 2038‑39 | 1.3 | ‑0.6 | ‑2.2 |
| 2039‑40 | 1.3 | ‑0.7 | ‑2.3 |
| 2040‑41 | 1.3 | ‑0.7 | ‑2.4 |
| 2041‑42 | 1.2 | ‑0.8 | ‑2.5 |
| 2042‑43 | 1.2 | ‑0.9 | ‑2.6 |
| 2043‑44 | 1.1 | ‑1.0 | ‑2.7 |
| 2044‑45 | 1.0 | ‑1.1 | ‑2.8 |
| 2045‑46 | 1.0 | ‑1.1 | ‑3.0 |
| 2046‑47 | 0.9 | ‑1.3 | ‑3.1 |
| 2047‑48 | 0.8 | ‑1.4 | ‑3.3 |
| 2048‑49 | 0.7 | ‑1.5 | ‑3.4 |
| 2049‑50 | 0.7 | ‑1.6 | ‑3.6 |
| 2050‑51 | 0.6 | ‑1.7 | ‑3.8 |
| 2051‑52 | 0.4 | ‑1.9 | ‑3.9 |
| 2052‑53 | 0.3 | ‑2.0 | ‑4.1 |
| 2053‑54 | 0.2 | ‑2.2 | ‑4.4 |
| 2054‑55 | 0.0 | ‑2.4 | ‑4.6 |
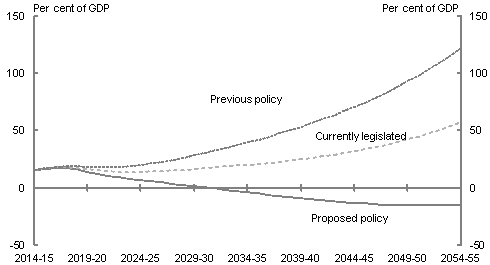
Note: The projections of net debt include net interest payments.
Source: Treasury projections. Projections assume trend economic growth from 2021–22 to 2054–55.
| Proposed policy | Currently legislated | Previous policy | |
|---|---|---|---|
| 2014‑15 | 15.2 | 15.4 | 15.4 |
| 2015‑16 | 16.7 | 17.0 | 17.0 |
| 2016‑17 | 17.2 | 17.8 | 18.1 |
| 2017‑18 | 17.0 | 18.0 | 18.9 |
| 2018‑19 | 15.9 | 17.5 | 18.9 |
| 2019‑20 | 14.0 | 16.4 | 18.4 |
| 2020‑21 | 11.8 | 15.0 | 17.9 |
| 2021‑22 | 10.2 | 14.2 | 17.7 |
| 2022‑23 | 8.8 | 13.8 | 18.0 |
| 2023‑24 | 7.8 | 13.7 | 18.8 |
| 2024‑25 | 6.7 | 13.8 | 19.8 |
| 2025‑26 | 5.6 | 14.1 | 21.1 |
| 2026‑27 | 4.5 | 14.5 | 22.6 |
| 2027‑28 | 3.4 | 15.0 | 24.3 |
| 2028‑29 | 2.4 | 15.7 | 26.2 |
| 2029‑30 | 1.3 | 16.4 | 28.2 |
| 2030‑31 | 0.3 | 17.0 | 30.3 |
| 2031‑32 | ‑0.8 | 17.8 | 32.4 |
| 2032‑33 | ‑1.9 | 18.5 | 34.7 |
| 2033‑34 | ‑2.9 | 19.3 | 37.1 |
| 2034‑35 | ‑4.0 | 20.2 | 39.6 |
| 2035‑36 | ‑5.1 | 20.9 | 42.0 |
| 2036‑37 | ‑6.1 | 21.9 | 44.7 |
| 2037‑38 | ‑7.2 | 22.8 | 47.4 |
| 2038‑39 | ‑8.2 | 23.8 | 50.2 |
| 2039‑40 | ‑9.1 | 24.9 | 53.2 |
| 2040‑41 | ‑10.1 | 26.0 | 56.3 |
| 2041‑42 | ‑10.9 | 27.3 | 59.6 |
| 2042‑43 | ‑11.8 | 28.7 | 63.0 |
| 2043‑44 | ‑12.5 | 30.2 | 66.7 |
| 2044‑45 | ‑13.2 | 31.8 | 70.5 |
| 2045‑46 | ‑13.8 | 33.4 | 74.3 |
| 2046‑47 | ‑14.4 | 35.3 | 78.6 |
| 2047‑48 | ‑14.8 | 37.4 | 83.0 |
| 2048‑49 | ‑15.2 | 39.6 | 87.8 |
| 2049‑50 | ‑15.4 | 42.1 | 92.8 |
| 2050‑51 | ‑15.6 | 44.6 | 97.8 |
| 2051‑52 | ‑15.6 | 47.4 | 103.4 |
| 2052‑53 | ‑15.5 | 50.5 | 109.3 |
| 2053‑54 | ‑15.3 | 53.7 | 115.4 |
| 2054‑55 | ‑15.0 | 57.2 | 121.9 |
Chart 2.5 Net debt — international comparison
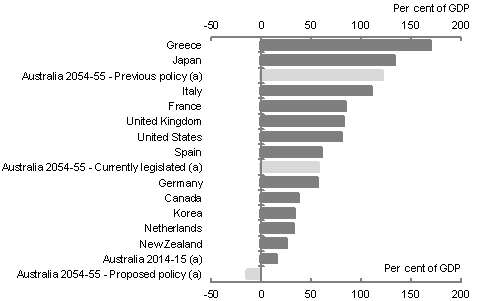
Note: For cross–country comparability, net debt levels reported by national statistical agencies for countries that have adopted the 2008 System of National Accounts (Australia, Canada, and the United States) are adjusted to exclude unfunded pension liabilities of government employees' defined benefit pension plans.
(a) Commonwealth general government net debt only; does not include net debt of states and territories.
Source: Treasury projections for Australia, IMF World Economic Outlook (October 2014) estimates for 2013 for all other countries.
| Country | Per cent of GDP |
|---|---|
| Greece | 170 |
| Japan | 134 |
| Australia 2054‑55 ‑ Previous policy | 122 |
| Italy | 111 |
| France | 85 |
| United Kingdom | 83 |
| United States | 80 |
| Spain | 60 |
| Australia 2054‑55 ‑ Currently legislated | 57 |
| Germany | 56 |
| Canada | 38 |
| Korea | 33 |
| Netherlands | 32 |
| New Zealand | 26 |
| Australia 2014‑15 | 15 |
| Australia 2054‑55 ‑ Proposed policy | ‑15 |
Chart 2.6 Irish gross debt expected at 2007 Budget and outcomes, 2001 to 2013
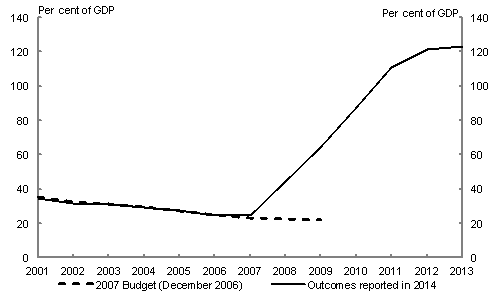
Note: Outcomes and projections for the financial year ending 31 December.
Source: Irish Department of Finance, Budgetary Statistics 2014; Irish Department of Finance, Budget 2007.
| 2007 Budget (December 2006) | Outcomes reported in 2014 | |
|---|---|---|
| 2001 | 35.4 | 34.5 |
| 2002 | 32.2 | 31.8 |
| 2003 | 31.1 | 31.0 |
| 2004 | 29.7 | 29.4 |
| 2005 | 27.4 | 27.2 |
| 2006 | 25.1 | 24.6 |
| 2007 | 23.0 | 24.9 |
| 2008 | 22.4 | 44.2 |
| 2009 | 21.9 | 64.4 |
| 2010 | 87.4 | |
| 2011 | 111.1 | |
| 2012 | 121.7 | |
| 2013 | 123.3 |
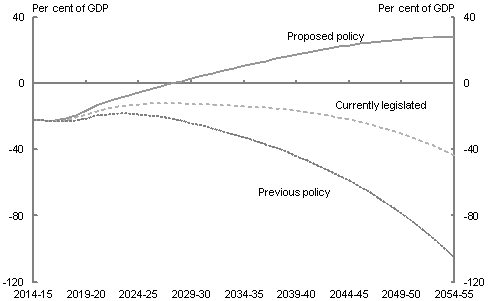
Source: Treasury projections. Projections assume trend economic growth from 2021–22 to 2054–55.
| Proposed policy | Currently legislated | Previous policy | |
|---|---|---|---|
| 2014-15 | -21.6 | -21.8 | -21.8 |
| 2015-16 | -22.3 | -22.6 | -22.7 |
| 2016-17 | -22.2 | -22.8 | -23.1 |
| 2017-18 | -21.5 | -22.5 | -23.4 |
| 2018-19 | -19.2 | -20.9 | -22.3 |
| 2019-20 | -16.4 | -19.0 | -21.0 |
| 2020-21 | -13.5 | -16.9 | -19.7 |
| 2021-22 | -11.0 | -15.3 | -18.7 |
| 2022-23 | -8.9 | -14.1 | -18.3 |
| 2023-24 | -7.1 | -13.4 | -18.4 |
| 2024-25 | -5.4 | -12.9 | -18.7 |
| 2025-26 | -3.6 | -12.5 | -19.3 |
| 2026-27 | -2.0 | -12.3 | -20.2 |
| 2027-28 | -0.3 | -12.3 | -21.3 |
| 2028-29 | 1.3 | -12.4 | -22.6 |
| 2029-30 | 2.9 | -12.6 | -24.1 |
| 2030-31 | 4.4 | -12.7 | -25.5 |
| 2031-32 | 6.0 | -13.0 | -27.1 |
| 2032-33 | 7.5 | -13.3 | -28.9 |
| 2033-34 | 9.0 | -13.6 | -30.7 |
| 2034-35 | 10.4 | -14.0 | -32.7 |
| 2035-36 | 12.0 | -14.3 | -34.6 |
| 2036-37 | 13.4 | -14.8 | -36.8 |
| 2037-38 | 14.8 | -15.4 | -39.1 |
| 2038-39 | 16.2 | -16.0 | -41.4 |
| 2039-40 | 17.5 | -16.7 | -44.0 |
| 2040-41 | 18.7 | -17.5 | -46.5 |
| 2041-42 | 19.9 | -18.4 | -49.4 |
| 2042-43 | 21.0 | -19.4 | -52.4 |
| 2043-44 | 22.0 | -20.6 | -55.6 |
| 2044-45 | 23.0 | -21.9 | -58.9 |
| 2045-46 | 23.9 | -23.2 | -62.3 |
| 2046-47 | 24.7 | -24.8 | -66.1 |
| 2047-48 | 25.5 | -26.5 | -70.1 |
| 2048-49 | 26.1 | -28.3 | -74.3 |
| 2049-50 | 26.7 | -30.4 | -78.8 |
| 2050-51 | 27.2 | -32.5 | -83.2 |
| 2051-52 | 27.5 | -34.9 | -88.2 |
| 2052-53 | 27.7 | -37.5 | -93.5 |
| 2053-54 | 27.8 | -40.4 | -99.1 |
| 2054-55 | 27.7 | -43.4 | -104.9 |
Chart 2.8 Total government spending and taxes by age (2009–10)
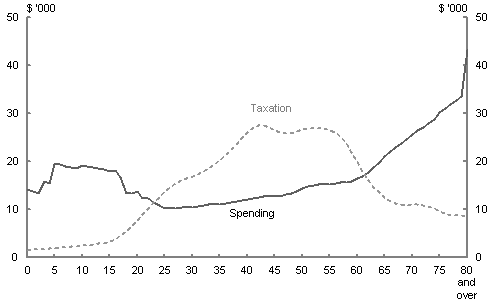
Note: Total government refers to Australian Government and State and Territory governments.
Source: Rice, Temple and McDonald, 2013.
| Government spending (Commonwealth plus State) and taxes by age (2009-10) - $000 | ||
|---|---|---|
| Age | Public spending | Taxes |
| 0 | 14.3 | 1.6 |
| 1 | 13.8 | 1.6 |
| 2 | 13.3 | 1.7 |
| 3 | 15.9 | 1.7 |
| 4 | 15.4 | 1.8 |
| 5 | 19.6 | 1.9 |
| 6 | 19.3 | 2.0 |
| 7 | 19.0 | 2.1 |
| 8 | 18.8 | 2.2 |
| 9 | 18.6 | 2.3 |
| 10 | 19.1 | 2.5 |
| 11 | 19.0 | 2.6 |
| 12 | 18.8 | 2.7 |
| 13 | 18.6 | 2.8 |
| 14 | 18.4 | 3.0 |
| 15 | 17.8 | 3.4 |
| 16 | 18.1 | 3.8 |
| 17 | 16.7 | 4.6 |
| 18 | 13.4 | 5.5 |
| 19 | 13.3 | 6.5 |
| 20 | 13.8 | 7.7 |
| 21 | 12.2 | 8.9 |
| 22 | 12.2 | 10.1 |
| 23 | 11.4 | 11.4 |
| 24 | 10.9 | 12.6 |
| 25 | 10.2 | 13.7 |
| 26 | 10.3 | 14.6 |
| 27 | 10.3 | 15.4 |
| 28 | 10.4 | 16.0 |
| 29 | 10.5 | 16.4 |
| 30 | 10.4 | 16.8 |
| 31 | 10.6 | 17.2 |
| 32 | 10.8 | 17.8 |
| 33 | 10.9 | 18.5 |
| 34 | 11.1 | 19.3 |
| 35 | 11.1 | 20.3 |
| 36 | 11.3 | 21.3 |
| 37 | 11.5 | 22.4 |
| 38 | 11.7 | 23.5 |
| 39 | 11.9 | 24.7 |
| 40 | 12.1 | 26.0 |
| 41 | 12.3 | 26.9 |
| 42 | 12.5 | 27.4 |
| 43 | 12.6 | 27.4 |
| 44 | 12.7 | 27.1 |
| 45 | 12.7 | 26.4 |
| 46 | 12.8 | 26.0 |
| 47 | 13.1 | 25.8 |
| 48 | 13.4 | 25.9 |
| 49 | 13.8 | 26.2 |
| 50 | 14.4 | 26.7 |
| 51 | 14.7 | 26.8 |
| 52 | 15.0 | 27.0 |
| 53 | 15.2 | 26.9 |
| 54 | 15.3 | 26.8 |
| 55 | 15.2 | 26.4 |
| 56 | 15.4 | 26.1 |
| 57 | 15.6 | 25.2 |
| 58 | 15.6 | 23.7 |
| 59 | 15.9 | 21.8 |
| 60 | 16.4 | 19.8 |
| 61 | 16.9 | 17.8 |
| 62 | 17.7 | 16.1 |
| 63 | 18.7 | 14.7 |
| 64 | 19.8 | 13.5 |
| 65 | 21.1 | 12.5 |
| 66 | 22.1 | 11.7 |
| 67 | 23.0 | 11.2 |
| 68 | 23.8 | 11.0 |
| 69 | 24.6 | 10.9 |
| 70 | 25.6 | 11.0 |
| 71 | 26.4 | 11.0 |
| 72 | 27.2 | 10.9 |
| 73 | 28.0 | 10.6 |
| 74 | 28.8 | 10.2 |
| 75 | 30.3 | 9.6 |
| 76 | 31.1 | 9.1 |
| 77 | 32.0 | 8.8 |
| 78 | 32.7 | 8.7 |
| 79 | 33.5 | 8.8 |
| 80 and over | 43.4 | 8.6 |
Chart 2.9 Historical health spending
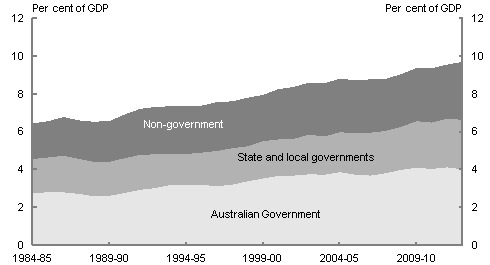
Source: Australian Institute of Health and Welfare health spending database.
| Australian Government | State and local | Non-government | |
|---|---|---|---|
| 1984-85 | 2.8 | 1.8 | 1.9 |
| 1985-86 | 2.8 | 1.8 | 1.9 |
| 1986-87 | 2.8 | 1.9 | 2.1 |
| 1987-88 | 2.7 | 1.8 | 2.0 |
| 1988-89 | 2.6 | 1.8 | 2.1 |
| 1989-90 | 2.6 | 1.8 | 2.2 |
| 1990-91 | 2.8 | 1.8 | 2.3 |
| 1991-92 | 2.9 | 1.9 | 2.4 |
| 1992-93 | 3.0 | 1.8 | 2.5 |
| 1993-94 | 3.2 | 1.6 | 2.5 |
| 1994-95 | 3.2 | 1.7 | 2.5 |
| 1995-96 | 3.2 | 1.7 | 2.5 |
| 1996-97 | 3.1 | 1.9 | 2.6 |
| 1997-98 | 3.2 | 1.9 | 2.5 |
| 1998-99 | 3.4 | 1.9 | 2.6 |
| 1999-00 | 3.5 | 2.0 | 2.4 |
| 2000-01 | 3.7 | 1.9 | 2.7 |
| 2001-02 | 3.7 | 1.9 | 2.7 |
| 2002-03 | 3.7 | 2.1 | 2.7 |
| 2003-04 | 3.7 | 2.0 | 2.8 |
| 2004-05 | 3.9 | 2.1 | 2.8 |
| 2005-06 | 3.7 | 2.2 | 2.8 |
| 2006-07 | 3.7 | 2.3 | 2.8 |
| 2007-08 | 3.8 | 2.2 | 2.8 |
| 2008-09 | 4.0 | 2.3 | 2.8 |
| 2009-10 | 4.1 | 2.5 | 2.8 |
| 2010-11 | 4.0 | 2.4 | 2.9 |
| 2011-12 | 4.1 | 2.6 | 2.9 |
| 2012-13 | 4.0 | 2.6 | 3.1 |
Chart 2.10 Australian Government health spending
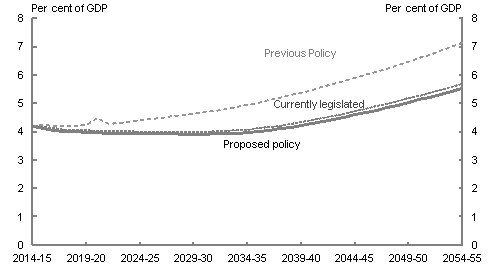
Note: Under the 'previous policy' scenario, health spending in 2020–21 is significantly higher than in the adjacent years owing to guarantee payments under the National Health Reform Agreement.
Source: Treasury projections. Projections assume trend economic growth from 2021–22 to 2054–55.
| Proposed policy | Currently legislated | Previous policy | |
|---|---|---|---|
| 2014-15 | 4.2 | 4.2 | 4.2 |
| 2015-16 | 4.1 | 4.2 | 4.2 |
| 2016-17 | 4.0 | 4.1 | 4.2 |
| 2017-18 | 4.0 | 4.1 | 4.2 |
| 2018-19 | 4.0 | 4.1 | 4.2 |
| 2019-20 | 4.0 | 4.0 | 4.2 |
| 2020-21 | 4.0 | 4.0 | 4.5 |
| 2021-22 | 3.9 | 4.0 | 4.3 |
| 2022-23 | 3.9 | 4.0 | 4.3 |
| 2023-24 | 3.9 | 4.0 | 4.4 |
| 2024-25 | 3.9 | 4.0 | 4.4 |
| 2025-26 | 3.9 | 4.0 | 4.4 |
| 2026-27 | 3.9 | 4.0 | 4.5 |
| 2027-28 | 3.9 | 4.0 | 4.5 |
| 2028-29 | 3.9 | 4.0 | 4.6 |
| 2029-30 | 3.9 | 4.0 | 4.6 |
| 2030-31 | 3.9 | 4.0 | 4.7 |
| 2031-32 | 3.9 | 4.0 | 4.7 |
| 2032-33 | 3.9 | 4.0 | 4.8 |
| 2033-34 | 3.9 | 4.0 | 4.9 |
| 2034-35 | 4.0 | 4.1 | 4.9 |
| 2035-36 | 4.0 | 4.1 | 5.0 |
| 2036-37 | 4.0 | 4.2 | 5.1 |
| 2037-38 | 4.1 | 4.2 | 5.2 |
| 2038-39 | 4.2 | 4.3 | 5.3 |
| 2039-40 | 4.2 | 4.3 | 5.4 |
| 2040-41 | 4.3 | 4.4 | 5.5 |
| 2041-42 | 4.4 | 4.5 | 5.6 |
| 2042-43 | 4.4 | 4.6 | 5.7 |
| 2043-44 | 4.5 | 4.6 | 5.8 |
| 2044-45 | 4.6 | 4.7 | 5.9 |
| 2045-46 | 4.7 | 4.8 | 6.0 |
| 2046-47 | 4.8 | 4.9 | 6.1 |
| 2047-48 | 4.8 | 5.0 | 6.2 |
| 2048-49 | 4.9 | 5.1 | 6.3 |
| 2049-50 | 5.0 | 5.2 | 6.5 |
| 2050-51 | 5.1 | 5.3 | 6.6 |
| 2051-52 | 5.2 | 5.4 | 6.7 |
| 2052-53 | 5.3 | 5.5 | 6.8 |
| 2053-54 | 5.4 | 5.6 | 7.0 |
| 2054-55 | 5.5 | 5.7 | 7.1 |
Chart 2.11 Australian Government health spending per person with and without ageing (real 2014-15 dollars)
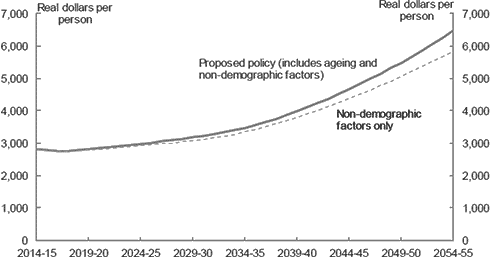
Source: Treasury projections. Projections assume trend economic growth from 2021–22 to 2054–55.
| Proposed policy (includes ageing and non-demographic factors) | Non-demographic factors only | |
|---|---|---|
| 2014-15 | 2800 | 2800 |
| 2015-16 | 2800 | 2800 |
| 2016-17 | 2800 | 2800 |
| 2017-18 | 2800 | 2800 |
| 2018-19 | 2800 | 2800 |
| 2019-20 | 2800 | 2800 |
| 2020-21 | 2800 | 2800 |
| 2021-22 | 2900 | 2800 |
| 2022-23 | 2900 | 2900 |
| 2023-24 | 2900 | 2900 |
| 2024-25 | 3000 | 2900 |
| 2025-26 | 3000 | 2900 |
| 2026-27 | 3100 | 3000 |
| 2027-28 | 3100 | 3000 |
| 2028-29 | 3100 | 3000 |
| 2029-30 | 3200 | 3100 |
| 2030-31 | 3200 | 3100 |
| 2031-32 | 3300 | 3200 |
| 2032-33 | 3300 | 3200 |
| 2033-34 | 3400 | 3300 |
| 2034-35 | 3500 | 3300 |
| 2035-36 | 3600 | 3400 |
| 2036-37 | 3700 | 3500 |
| 2037-38 | 3800 | 3600 |
| 2038-39 | 3900 | 3700 |
| 2039-40 | 4000 | 3800 |
| 2040-41 | 4100 | 3900 |
| 2041-42 | 4200 | 4000 |
| 2042-43 | 4400 | 4100 |
| 2043-44 | 4500 | 4300 |
| 2044-45 | 4700 | 4400 |
| 2045-46 | 4800 | 4500 |
| 2046-47 | 5000 | 4600 |
| 2047-48 | 5200 | 4800 |
| 2048-49 | 5300 | 4900 |
| 2049-50 | 5500 | 5100 |
| 2050-51 | 5700 | 5200 |
| 2051-52 | 5900 | 5400 |
| 2052-53 | 6100 | 5500 |
| 2053-54 | 6300 | 5700 |
| 2054-55 | 6500 | 5900 |
Chart 2.12 Australian Government health spending by program based on age
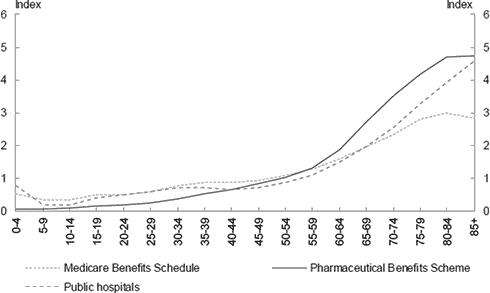
Note: Index of average cost per person in 2012‑13 = 1.
Source: Department of Health.
| Medicare Benefits Schedule | Pharmaceutical Benefits Scheme | Public hospitals | |
|---|---|---|---|
| 0-4 | 0.5 | 0.1 | 0.8 |
| 5-9 | 0.3 | 0.1 | 0.2 |
| 10-14 | 0.4 | 0.1 | 0.2 |
| 15-19 | 0.5 | 0.1 | 0.4 |
| 20-24 | 0.5 | 0.2 | 0.5 |
| 25-29 | 0.6 | 0.3 | 0.6 |
| 30-34 | 0.8 | 0.4 | 0.7 |
| 35-39 | 0.9 | 0.5 | 0.7 |
| 40-44 | 0.9 | 0.7 | 0.7 |
| 45-49 | 0.9 | 0.8 | 0.7 |
| 50-54 | 1.1 | 1 | 0.9 |
| 55-59 | 1.3 | 1.3 | 1.1 |
| 60-64 | 1.6 | 1.9 | 1.5 |
| 65-69 | 1.9 | 2.7 | 2 |
| 70-74 | 2.3 | 3.5 | 2.6 |
| 75-79 | 2.8 | 4.2 | 3.3 |
| 80-84 | 3 | 4.7 | 3.9 |
| 85+ | 2.8 | 4.7 | 4.6 |
Chart 2.13 Australian Government health spending by component
(excludes contributions to the Medical Research Future Fund)
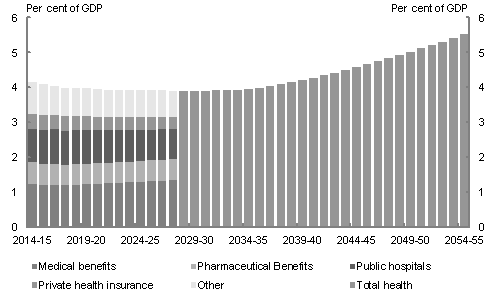
Source: Treasury projections, 'proposed policy' scenario. Projections assume trend economic growth from 2021–22 to 2054–55.
3.9
| X Values | Medical benefits | Pharmaceutical Benefits | Public hospitals | Private health insurance | Other | Total health |
|---|---|---|---|---|---|---|
| 2014-15 | 1.2 | 0.6 | 1.0 | 0.4 | 0.9 | |
| 2015-16 | 1.2 | 0.6 | 1.0 | 0.4 | 0.9 | |
| 2016-17 | 1.2 | 0.6 | 1.0 | 0.4 | 0.8 | |
| 2017-18 | 1.2 | 0.6 | 1.0 | 0.4 | 0.8 | |
| 2018-19 | 1.2 | 0.6 | 1.0 | 0.4 | 0.8 | |
| 2019-20 | 1.2 | 0.6 | 1.0 | 0.4 | 0.8 | |
| 2020-21 | 1.2 | 0.6 | 0.9 | 0.4 | 0.8 | |
| 2021-22 | 1.3 | 0.6 | 0.9 | 0.4 | 0.8 | |
| 2022-23 | 1.3 | 0.6 | 0.9 | 0.4 | 0.8 | |
| 2023-24 | 1.3 | 0.6 | 0.9 | 0.4 | 0.8 | |
| 2024-25 | 1.3 | 0.6 | 0.9 | 0.4 | 0.8 | |
| 2025-26 | 1.3 | 0.6 | 0.9 | 0.4 | 0.8 | |
| 2026-27 | 1.3 | 0.6 | 0.9 | 0.4 | 0.8 | |
| 2027-28 | 1.3 | 0.6 | 0.9 | 0.4 | 0.8 | |
| 2028-29 | 3.9 | |||||
| 2029-30 | ||||||
| 2030-31 | 3.9 | |||||
| 2031-32 | 3.9 | |||||
| 2032-33 | 3.9 | |||||
| 2033-34 | 3.9 | |||||
| 2034-35 | 4.0 | |||||
| 2035-36 | 4.0 | |||||
| 2036-37 | 4.0 | |||||
| 2037-38 | 4.1 | |||||
| 2038-39 | 4.2 | |||||
| 2039-40 | 4.2 | |||||
| 2040-41 | 4.3 | |||||
| 2041-42 | 4.4 | |||||
| 2042-43 | 4.4 | |||||
| 2043-44 | 4.5 | |||||
| 2044-45 | 4.6 | |||||
| 2045-46 | 4.7 | |||||
| 2046-47 | 4.8 | |||||
| 2047-48 | 4.8 | |||||
| 2048-49 | 4.9 | |||||
| 2049-50 | 5.0 | |||||
| 2050-51 | 5.1 | |||||
| 2051-52 | 5.2 | |||||
| 2052-53 | 5.3 | |||||
| 2053-54 | 5.4 | |||||
| 2054-55 | 5.5 |
Chart 2.14 Australian Government Age and Service pensions
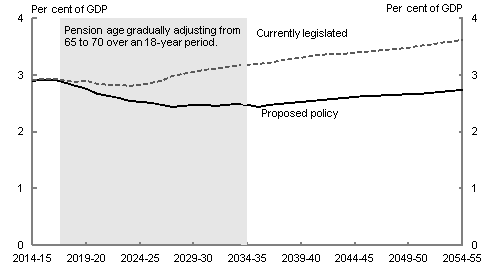
Source: Treasury projections. Projections assume trend economic growth from 2021–22 to 2054–55.
| Proposed policy | Currently legislated | |
|---|---|---|
| 2014-15 | 2.9 | 2.9 |
| 2015-16 | 2.9 | 2.9 |
| 2016-17 | 2.9 | 2.9 |
| 2017-18 | 2.9 | 2.9 |
| 2018-19 | 2.8 | 2.9 |
| 2019-20 | 2.8 | 2.9 |
| 2020-21 | 2.7 | 2.8 |
| 2021-22 | 2.6 | 2.8 |
| 2022-23 | 2.6 | 2.8 |
| 2023-24 | 2.5 | 2.8 |
| 2024-25 | 2.5 | 2.8 |
| 2025-26 | 2.5 | 2.9 |
| 2026-27 | 2.5 | 2.9 |
| 2027-28 | 2.4 | 3.0 |
| 2028-29 | 2.4 | 3.0 |
| 2029-30 | 2.5 | 3.1 |
| 2030-31 | 2.5 | 3.1 |
| 2031-32 | 2.5 | 3.1 |
| 2032-33 | 2.5 | 3.1 |
| 2033-34 | 2.5 | 3.2 |
| 2034-35 | 2.5 | 3.2 |
| 2035-36 | 2.4 | 3.2 |
| 2036-37 | 2.5 | 3.2 |
| 2037-38 | 2.5 | 3.2 |
| 2038-39 | 2.5 | 3.3 |
| 2039-40 | 2.5 | 3.3 |
| 2040-41 | 2.5 | 3.3 |
| 2041-42 | 2.6 | 3.3 |
| 2042-43 | 2.6 | 3.4 |
| 2043-44 | 2.6 | 3.4 |
| 2044-45 | 2.6 | 3.4 |
| 2045-46 | 2.6 | 3.4 |
| 2046-47 | 2.6 | 3.4 |
| 2047-48 | 2.6 | 3.5 |
| 2048-49 | 2.6 | 3.5 |
| 2049-50 | 2.7 | 3.5 |
| 2050-51 | 2.7 | 3.5 |
| 2051-52 | 2.7 | 3.5 |
| 2052-53 | 2.7 | 3.6 |
| 2053-54 | 2.7 | 3.6 |
| 2054-55 | 2.7 | 3.6 |
Chart 2.15 Male life expectancy and age pension age
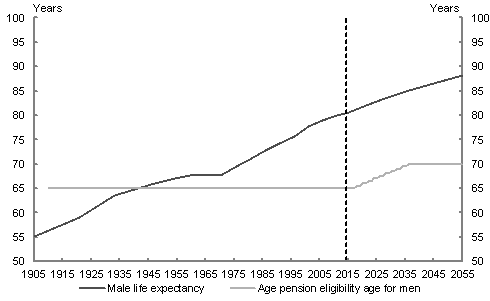
Note: Period life expectancies have been used for this chart to allow comparisons over time. Data is for the financial year ending June 30.
Source: Australian Government Actuary Life Tables, Treasury projections.
| Male life expectancy | Age pension eligibility age for men | |
|---|---|---|
| 1905 | 55.20 | |
| 1906 | ||
| 1907 | ||
| 1908 | ||
| 1909 | ||
| 1910 | 65 | |
| 1911 | 65 | |
| 1912 | 65 | |
| 1913 | 65 | |
| 1914 | 65 | |
| 1915 | 65 | |
| 1916 | 65 | |
| 1917 | 65 | |
| 1918 | 65 | |
| 1919 | 65 | |
| 1920 | 65 | |
| 1921 | 59.15 | 65 |
| 1922 | 65 | |
| 1923 | 65 | |
| 1924 | 65 | |
| 1925 | 65 | |
| 1926 | 65 | |
| 1927 | 65 | |
| 1928 | 65 | |
| 1929 | 65 | |
| 1930 | 65 | |
| 1931 | 65 | |
| 1932 | 65 | |
| 1933 | 63.48 | 65 |
| 1934 | 65 | |
| 1935 | 65 | |
| 1936 | 65 | |
| 1937 | 65 | |
| 1938 | 65 | |
| 1939 | 65 | |
| 1940 | 65 | |
| 1941 | 65 | |
| 1942 | 65 | |
| 1943 | 65 | |
| 1944 | 65 | |
| 1945 | 65 | |
| 1946 | 65 | |
| 1947 | 66.07 | 65 |
| 1948 | 65 | |
| 1949 | 65 | |
| 1950 | 65 | |
| 1951 | 65 | |
| 1952 | 65 | |
| 1953 | 65 | |
| 1954 | 67.14 | 65 |
| 1955 | 65 | |
| 1956 | 65 | |
| 1957 | 65 | |
| 1958 | 65 | |
| 1959 | 65 | |
| 1960 | 65 | |
| 1961 | 67.92 | 65 |
| 1962 | 65 | |
| 1963 | 65 | |
| 1964 | 65 | |
| 1965 | 65 | |
| 1966 | 67.63 | 65 |
| 1967 | 65 | |
| 1968 | 65 | |
| 1969 | 65 | |
| 1970 | 65 | |
| 1971 | 67.81 | 65 |
| 1972 | 65 | |
| 1973 | 65 | |
| 1974 | 65 | |
| 1975 | 65 | |
| 1976 | 69.56 | 65 |
| 1977 | 65 | |
| 1978 | 65 | |
| 1979 | 65 | |
| 1980 | 65 | |
| 1981 | 71.23 | 65 |
| 1982 | 65 | |
| 1983 | 65 | |
| 1984 | 65 | |
| 1985 | 65 | |
| 1986 | 72.74 | 65 |
| 1987 | 65 | |
| 1988 | 65 | |
| 1989 | 65 | |
| 1990 | 65 | |
| 1991 | 74.32 | 65 |
| 1992 | 65 | |
| 1993 | 65 | |
| 1994 | 65 | |
| 1995 | 65 | |
| 1996 | 75.69 | 65 |
| 1997 | 65 | |
| 1998 | 65 | |
| 1999 | 65 | |
| 2000 | 65 | |
| 2001 | 77.64 | 65 |
| 2002 | 65 | |
| 2003 | 65 | |
| 2004 | 65 | |
| 2005 | 65 | |
| 2006 | 79.02 | 65 |
| 2007 | 65 | |
| 2008 | 65 | |
| 2009 | 65 | |
| 2010 | 65 | |
| 2011 | 80.06 | 65 |
| 2012 | 65 | |
| 2013 | 65 | |
| 2014 | 65 | |
| 2015 | 80.60 | 65 |
| 2016 | 65 | |
| 2017 | 65 | |
| 2018 | 66 | |
| 2019 | 66 | |
| 2020 | 66 | |
| 2021 | 66 | |
| 2022 | 67 | |
| 2023 | 67 | |
| 2024 | 67 | |
| 2025 | 82.90 | 67 |
| 2026 | 68 | |
| 2027 | 68 | |
| 2028 | 68 | |
| 2029 | 68 | |
| 2030 | 69 | |
| 2031 | 69 | |
| 2032 | 69 | |
| 2033 | 69 | |
| 2034 | 70 | |
| 2035 | 84.90 | 70 |
| 2036 | 70 | |
| 2037 | 70 | |
| 2038 | 70 | |
| 2039 | 70 | |
| 2040 | 70 | |
| 2041 | 70 | |
| 2042 | 70 | |
| 2043 | 70 | |
| 2044 | 70 | |
| 2045 | 86.60 | 70 |
| 2046 | 70 | |
| 2047 | 70 | |
| 2048 | 70 | |
| 2049 | 70 | |
| 2050 | 70 | |
| 2051 | 70 | |
| 2052 | 70 | |
| 2053 | 70 | |
| 2054 | 70 | |
| 2055 | 88.10 | 70 |
Chart 2.16 Australian Government aged care spending
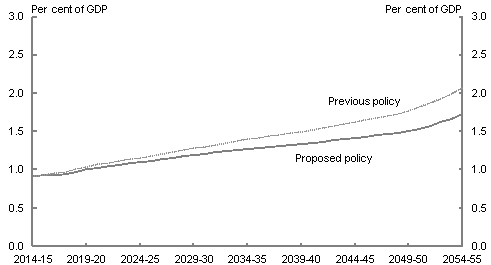
Source: Treasury projections. Projections assume trend economic growth from 2021–22 to 2054–55.
| Proposed policy | Previous policy | |
|---|---|---|
| 2014-15 | 0.9 | 0.9 |
| 2015-16 | 0.9 | 0.9 |
| 2016-17 | 0.9 | 1.0 |
| 2017-18 | 0.9 | 1.0 |
| 2018-19 | 1.0 | 1.0 |
| 2019-20 | 1.0 | 1.0 |
| 2020-21 | 1.0 | 1.1 |
| 2021-22 | 1.0 | 1.1 |
| 2022-23 | 1.1 | 1.1 |
| 2023-24 | 1.1 | 1.1 |
| 2024-25 | 1.1 | 1.2 |
| 2025-26 | 1.1 | 1.2 |
| 2026-27 | 1.1 | 1.2 |
| 2027-28 | 1.2 | 1.2 |
| 2028-29 | 1.2 | 1.3 |
| 2029-30 | 1.2 | 1.3 |
| 2030-31 | 1.2 | 1.3 |
| 2031-32 | 1.2 | 1.3 |
| 2032-33 | 1.2 | 1.3 |
| 2033-34 | 1.3 | 1.4 |
| 2034-35 | 1.3 | 1.4 |
| 2035-36 | 1.3 | 1.4 |
| 2036-37 | 1.3 | 1.4 |
| 2037-38 | 1.3 | 1.5 |
| 2038-39 | 1.3 | 1.5 |
| 2039-40 | 1.3 | 1.5 |
| 2040-41 | 1.3 | 1.5 |
| 2041-42 | 1.4 | 1.5 |
| 2042-43 | 1.4 | 1.6 |
| 2043-44 | 1.4 | 1.6 |
| 2044-45 | 1.4 | 1.6 |
| 2045-46 | 1.4 | 1.6 |
| 2046-47 | 1.4 | 1.7 |
| 2047-48 | 1.5 | 1.7 |
| 2048-49 | 1.5 | 1.7 |
| 2049-50 | 1.5 | 1.8 |
| 2050-51 | 1.5 | 1.8 |
| 2051-52 | 1.6 | 1.9 |
| 2052-53 | 1.6 | 1.9 |
| 2053-54 | 1.7 | 2.0 |
| 2054-55 | 1.7 | 2.1 |
Chart 2.17 Composition of Australian Government payments to individuals
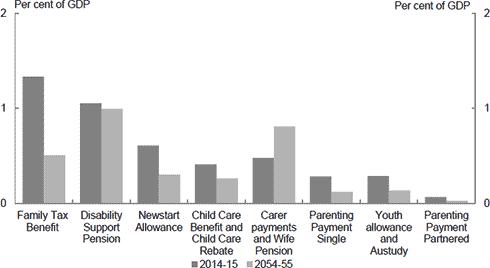
Note: Carer payments = Carer Allowance + Carer Payment.
This chart shows projections under the 'proposed policy' scenario.
Source: Treasury projections.
| 2014-15 | 2054-55 | |
|---|---|---|
| Family Tax Benefit | 1.3 | 0.5 |
| Disability Support Pension | 1.1 | 1.0 |
| Newstart Allowance | 0.6 | 0.3 |
| Child Care Benefit and Child Care Rebate | 0.4 | 0.3 |
| Carer payments and Wife Pension | 0.5 | 0.8 |
| Parenting Payment Single | 0.3 | 0.1 |
| Youth allowance and Austudy | 0.3 | 0.1 |
| Parenting Payment Partnered | 0.1 | 0.0 |
Chart 2.18 Australian Government payments to individuals
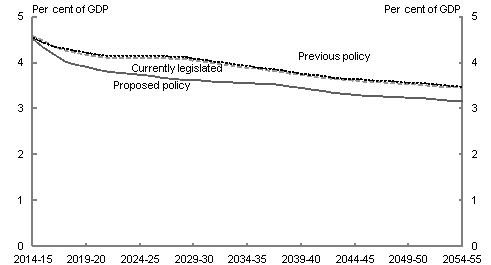
Source: Treasury projections. Projections assume trend economic growth from 2021–22 to 2054–55.
| Proposed policy | Currently legislated | Previous policy | |
|---|---|---|---|
| 2014-15 | 4.5 | 4.6 | 4.5 |
| 2015-16 | 4.3 | 4.5 | 4.4 |
| 2016-17 | 4.2 | 4.3 | 4.4 |
| 2017-18 | 4.0 | 4.2 | 4.3 |
| 2018-19 | 4.0 | 4.2 | 4.3 |
| 2019-20 | 3.9 | 4.2 | 4.2 |
| 2020-21 | 3.8 | 4.1 | 4.2 |
| 2021-22 | 3.8 | 4.1 | 4.2 |
| 2022-23 | 3.8 | 4.1 | 4.2 |
| 2023-24 | 3.8 | 4.1 | 4.1 |
| 2024-25 | 3.7 | 4.1 | 4.1 |
| 2025-26 | 3.7 | 4.1 | 4.1 |
| 2026-27 | 3.7 | 4.1 | 4.1 |
| 2027-28 | 3.6 | 4.1 | 4.1 |
| 2028-29 | 3.6 | 4.1 | 4.1 |
| 2029-30 | 3.6 | 4.0 | 4.1 |
| 2030-31 | 3.6 | 4.0 | 4.1 |
| 2031-32 | 3.6 | 4.0 | 4.0 |
| 2032-33 | 3.6 | 3.9 | 4.0 |
| 2033-34 | 3.6 | 3.9 | 3.9 |
| 2034-35 | 3.5 | 3.9 | 3.9 |
| 2035-36 | 3.5 | 3.9 | 3.9 |
| 2036-37 | 3.5 | 3.8 | 3.9 |
| 2037-38 | 3.5 | 3.8 | 3.8 |
| 2038-39 | 3.5 | 3.8 | 3.8 |
| 2039-40 | 3.4 | 3.7 | 3.8 |
| 2040-41 | 3.4 | 3.7 | 3.7 |
| 2041-42 | 3.4 | 3.7 | 3.7 |
| 2042-43 | 3.3 | 3.6 | 3.7 |
| 2043-44 | 3.3 | 3.6 | 3.6 |
| 2044-45 | 3.3 | 3.6 | 3.6 |
| 2045-46 | 3.3 | 3.6 | 3.6 |
| 2046-47 | 3.3 | 3.6 | 3.6 |
| 2047-48 | 3.3 | 3.6 | 3.6 |
| 2048-49 | 3.2 | 3.5 | 3.6 |
| 2049-50 | 3.2 | 3.5 | 3.6 |
| 2050-51 | 3.2 | 3.5 | 3.5 |
| 2051-52 | 3.2 | 3.5 | 3.5 |
| 2052-53 | 3.2 | 3.5 | 3.5 |
| 2053-54 | 3.2 | 3.5 | 3.5 |
| 2054-55 | 3.2 | 3.4 | 3.5 |
Chart 2.19 Australian Government assistance to those of working age
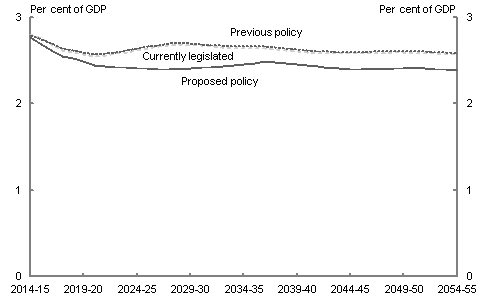
Source: Treasury projections. Projections assume trend economic growth from 2021–22 to 2054–55.
| Proposed policy | Currently legislated | Previous policy | |
|---|---|---|---|
| 2014-15 | 2.8 | 2.8 | 2.8 |
| 2015-16 | 2.7 | 2.8 | 2.7 |
| 2016-17 | 2.6 | 2.7 | 2.7 |
| 2017-18 | 2.6 | 2.6 | 2.6 |
| 2018-19 | 2.5 | 2.6 | 2.6 |
| 2019-20 | 2.5 | 2.6 | 2.6 |
| 2020-21 | 2.4 | 2.5 | 2.6 |
| 2021-22 | 2.4 | 2.6 | 2.6 |
| 2022-23 | 2.4 | 2.6 | 2.6 |
| 2023-24 | 2.4 | 2.6 | 2.6 |
| 2024-25 | 2.4 | 2.6 | 2.6 |
| 2025-26 | 2.4 | 2.6 | 2.7 |
| 2026-27 | 2.4 | 2.7 | 2.7 |
| 2027-28 | 2.4 | 2.7 | 2.7 |
| 2028-29 | 2.4 | 2.7 | 2.7 |
| 2029-30 | 2.4 | 2.7 | 2.7 |
| 2030-31 | 2.4 | 2.7 | 2.7 |
| 2031-32 | 2.4 | 2.7 | 2.7 |
| 2032-33 | 2.4 | 2.7 | 2.7 |
| 2033-34 | 2.4 | 2.6 | 2.7 |
| 2034-35 | 2.5 | 2.6 | 2.7 |
| 2035-36 | 2.5 | 2.6 | 2.7 |
| 2036-37 | 2.5 | 2.6 | 2.7 |
| 2037-38 | 2.5 | 2.6 | 2.7 |
| 2038-39 | 2.5 | 2.6 | 2.6 |
| 2039-40 | 2.5 | 2.6 | 2.6 |
| 2040-41 | 2.4 | 2.6 | 2.6 |
| 2041-42 | 2.4 | 2.6 | 2.6 |
| 2042-43 | 2.4 | 2.6 | 2.6 |
| 2043-44 | 2.4 | 2.6 | 2.6 |
| 2044-45 | 2.4 | 2.6 | 2.6 |
| 2045-46 | 2.4 | 2.6 | 2.6 |
| 2046-47 | 2.4 | 2.6 | 2.6 |
| 2047-48 | 2.4 | 2.6 | 2.6 |
| 2048-49 | 2.4 | 2.6 | 2.6 |
| 2049-50 | 2.4 | 2.6 | 2.6 |
| 2050-51 | 2.4 | 2.6 | 2.6 |
| 2051-52 | 2.4 | 2.6 | 2.6 |
| 2052-53 | 2.4 | 2.6 | 2.6 |
| 2053-54 | 2.4 | 2.6 | 2.6 |
| 2054-55 | 2.4 | 2.6 | 2.6 |
Chart 2.20 Australian Government assistance to families per person (real 2014–15 dollars)

Source: Treasury projections. Projections assume trend economic growth from 2021–22 to 2054–55.
| Proposed policy | Currently legislated | Previous policy | |
|---|---|---|---|
| 2014-15 | 1,182 | 1,204 | 1,182 |
| 2015-16 | 1,144 | 1,186 | 1,164 |
| 2016-17 | 1,100 | 1,185 | 1,186 |
| 2017-18 | 1,077 | 1,211 | 1,232 |
| 2018-19 | 1,104 | 1,241 | 1,262 |
| 2019-20 | 1,133 | 1,273 | 1,296 |
| 2020-21 | 1,161 | 1,306 | 1,329 |
| 2021-22 | 1,191 | 1,338 | 1,362 |
| 2022-23 | 1,220 | 1,371 | 1,395 |
| 2023-24 | 1,249 | 1,403 | 1,428 |
| 2024-25 | 1,277 | 1,435 | 1,460 |
| 2025-26 | 1,307 | 1,467 | 1,493 |
| 2026-27 | 1,335 | 1,499 | 1,525 |
| 2027-28 | 1,363 | 1,530 | 1,557 |
| 2028-29 | 1,393 | 1,563 | 1,591 |
| 2029-30 | 1,423 | 1,596 | 1,624 |
| 2030-31 | 1,451 | 1,627 | 1,656 |
| 2031-32 | 1,480 | 1,659 | 1,688 |
| 2032-33 | 1,510 | 1,693 | 1,723 |
| 2033-34 | 1,539 | 1,725 | 1,756 |
| 2034-35 | 1,569 | 1,758 | 1,789 |
| 2035-36 | 1,599 | 1,792 | 1,824 |
| 2036-37 | 1,630 | 1,827 | 1,859 |
| 2037-38 | 1,662 | 1,862 | 1,895 |
| 2038-39 | 1,694 | 1,899 | 1,932 |
| 2039-40 | 1,728 | 1,936 | 1,971 |
| 2040-41 | 1,763 | 1,976 | 2,011 |
| 2041-42 | 1,799 | 2,017 | 2,052 |
| 2042-43 | 1,837 | 2,059 | 2,096 |
| 2043-44 | 1,876 | 2,104 | 2,141 |
| 2044-45 | 1,917 | 2,150 | 2,188 |
| 2045-46 | 1,960 | 2,198 | 2,236 |
| 2046-47 | 2,004 | 2,248 | 2,287 |
| 2047-48 | 2,050 | 2,299 | 2,340 |
| 2048-49 | 2,097 | 2,352 | 2,394 |
| 2049-50 | 2,146 | 2,407 | 2,450 |
| 2050-51 | 2,197 | 2,464 | 2,507 |
| 2051-52 | 2,249 | 2,522 | 2,566 |
| 2052-53 | 2,302 | 2,582 | 2,627 |
| 2053-54 | 2,357 | 2,643 | 2,689 |
| 2054-55 | 2,412 | 2,705 | 2,752 |
Chart 2.21 Australian Government Spending on Education and Training per person (real 2014–15 dollars)
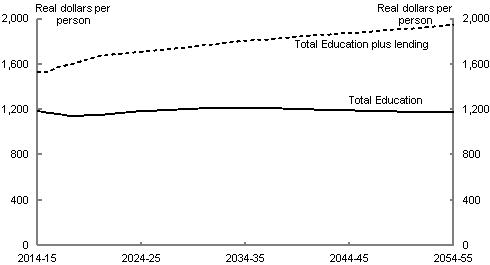
Source: Treasury projections, 'proposed policy' scenario. Projections assume trend economic growth from 2021–22 to 2054–55.
| Total education | Total education plus loans | |
|---|---|---|
| 2014-15 | 1,181 | 1,528 |
| 2015-16 | 1,171 | 1,534 |
| 2016-17 | 1,159 | 1,571 |
| 2017-18 | 1,137 | 1,588 |
| 2018-19 | 1,142 | 1,621 |
| 2019-20 | 1,147 | 1,648 |
| 2020-21 | 1,153 | 1,668 |
| 2021-22 | 1,160 | 1,680 |
| 2022-23 | 1,167 | 1,689 |
| 2023-24 | 1,174 | 1,699 |
| 2024-25 | 1,180 | 1,708 |
| 2025-26 | 1,186 | 1,718 |
| 2026-27 | 1,192 | 1,728 |
| 2027-28 | 1,196 | 1,738 |
| 2028-29 | 1,201 | 1,747 |
| 2029-30 | 1,205 | 1,756 |
| 2030-31 | 1,208 | 1,765 |
| 2031-32 | 1,209 | 1,773 |
| 2032-33 | 1,211 | 1,783 |
| 2033-34 | 1,212 | 1,793 |
| 2034-35 | 1,212 | 1,801 |
| 2035-36 | 1,212 | 1,810 |
| 2036-37 | 1,210 | 1,818 |
| 2037-38 | 1,208 | 1,826 |
| 2038-39 | 1,206 | 1,834 |
| 2039-40 | 1,203 | 1,841 |
| 2040-41 | 1,200 | 1,847 |
| 2041-42 | 1,197 | 1,854 |
| 2042-43 | 1,195 | 1,860 |
| 2043-44 | 1,192 | 1,867 |
| 2044-45 | 1,189 | 1,873 |
| 2045-46 | 1,187 | 1,880 |
| 2046-47 | 1,185 | 1,886 |
| 2047-48 | 1,183 | 1,893 |
| 2048-49 | 1,181 | 1,901 |
| 2049-50 | 1,180 | 1,908 |
| 2050-51 | 1,179 | 1,915 |
| 2051-52 | 1,178 | 1,923 |
| 2052-53 | 1,178 | 1,931 |
| 2053-54 | 1,178 | 1,939 |
| 2054-55 | 1,177 | 1,947 |
Chart 2.22 Total government NDIS spending
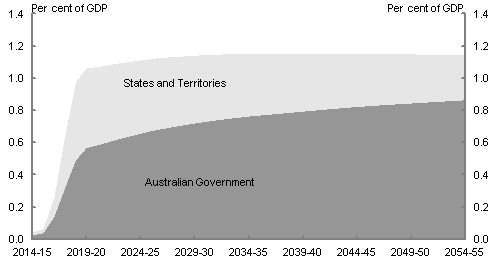
Note: This chart shows projections under the 'proposed policy' scenario. There are no pending measures for this area of spending.
Source: Treasury projections. Projections assume trend economic growth from 2021–22 to 2054–55.
| Australian Government | States and Territories | |
|---|---|---|
| 2014-15 | 0.0 | 0.0 |
| 2015-16 | 0.0 | 0.0 |
| 2016-17 | 0.1 | 0.1 |
| 2017-18 | 0.3 | 0.3 |
| 2018-19 | 0.5 | 0.5 |
| 2019-20 | 0.6 | 0.5 |
| 2020-21 | 0.6 | 0.5 |
| 2021-22 | 0.6 | 0.5 |
| 2022-23 | 0.6 | 0.5 |
| 2023-24 | 0.6 | 0.5 |
| 2024-25 | 0.7 | 0.5 |
| 2025-26 | 0.7 | 0.4 |
| 2026-27 | 0.7 | 0.4 |
| 2027-28 | 0.7 | 0.4 |
| 2028-29 | 0.7 | 0.4 |
| 2029-30 | 0.7 | 0.4 |
| 2030-31 | 0.7 | 0.4 |
| 2031-32 | 0.7 | 0.4 |
| 2032-33 | 0.7 | 0.4 |
| 2033-34 | 0.8 | 0.4 |
| 2034-35 | 0.8 | 0.4 |
| 2035-36 | 0.8 | 0.4 |
| 2036-37 | 0.8 | 0.4 |
| 2037-38 | 0.8 | 0.4 |
| 2038-39 | 0.8 | 0.4 |
| 2039-40 | 0.8 | 0.4 |
| 2040-41 | 0.8 | 0.4 |
| 2041-42 | 0.8 | 0.3 |
| 2042-43 | 0.8 | 0.3 |
| 2043-44 | 0.8 | 0.3 |
| 2044-45 | 0.8 | 0.3 |
| 2045-46 | 0.8 | 0.3 |
| 2046-47 | 0.8 | 0.3 |
| 2047-48 | 0.8 | 0.3 |
| 2048-49 | 0.8 | 0.3 |
| 2049-50 | 0.8 | 0.3 |
| 2050-51 | 0.8 | 0.3 |
| 2051-52 | 0.9 | 0.3 |
| 2052-53 | 0.9 | 0.3 |
| 2053-54 | 0.9 | 0.3 |
| 2054-55 | 0.9 | 0.3 |
Chart 2.23 Projected tax–to–GDP ratio
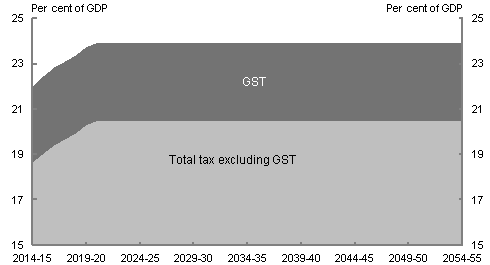
Source: Treasury projections. Projections assume trend economic growth from 2021–22 to 2054–55.
| Total tax excluding GST | GST | |
|---|---|---|
| 2014-15 | 18.7 | 3.3 |
| 2015-16 | 19.0 | 3.4 |
| 2016-17 | 19.4 | 3.4 |
| 2017-18 | 19.6 | 3.4 |
| 2018-19 | 19.9 | 3.4 |
| 2019-20 | 20.3 | 3.4 |
| 2020-21 | 20.5 | 3.4 |
| 2021-22 | 20.5 | 3.4 |
| 2022-23 | 20.5 | 3.4 |
| 2023-24 | 20.5 | 3.4 |
| 2024-25 | 20.5 | 3.4 |
| 2025-26 | 20.5 | 3.4 |
| 2026-27 | 20.5 | 3.4 |
| 2027-28 | 20.5 | 3.4 |
| 2028-29 | 20.5 | 3.4 |
| 2029-30 | 20.5 | 3.4 |
| 2030-31 | 20.5 | 3.4 |
| 2031-32 | 20.5 | 3.4 |
| 2032-33 | 20.5 | 3.4 |
| 2033-34 | 20.5 | 3.4 |
| 2034-35 | 20.5 | 3.4 |
| 2035-36 | 20.5 | 3.4 |
| 2036-37 | 20.5 | 3.4 |
| 2037-38 | 20.5 | 3.4 |
| 2038-39 | 20.5 | 3.4 |
| 2039-40 | 20.5 | 3.4 |
| 2040-41 | 20.5 | 3.4 |
| 2041-42 | 20.5 | 3.4 |
| 2042-43 | 20.5 | 3.4 |
| 2043-44 | 20.5 | 3.4 |
| 2044-45 | 20.5 | 3.4 |
| 2045-46 | 20.5 | 3.4 |
| 2046-47 | 20.5 | 3.4 |
| 2047-48 | 20.5 | 3.4 |
| 2048-49 | 20.5 | 3.4 |
| 2049-50 | 20.5 | 3.4 |
| 2050-51 | 20.5 | 3.4 |
| 2051-52 | 20.5 | 3.4 |
| 2052-53 | 20.5 | 3.4 |
| 2053-54 | 20.5 | 3.4 |
| 2054-55 | 20.5 | 3.4 |
Chart 2.24 Personal income tax rates and the effects of bracket creep
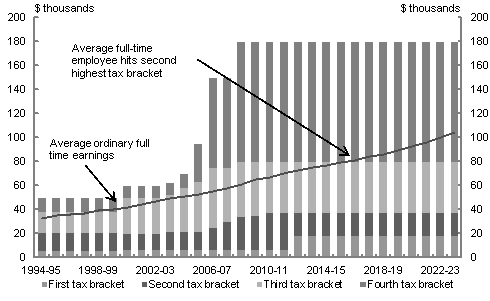
Source: ABS cat. no. 6302.0 and Treasury calculations.
| Average tax rate of full time employee earning Average Weekly Ordinary Time Earnings (AWOTE) |
Full time employee earning (AWOTE) relative to personal income tax thresholds | ||||||||
|---|---|---|---|---|---|---|---|---|---|
| Year | Average annual ordinary full-time earnings (from AWOTE) |
Year | Thresholds | ||||||
| 1st threshold | 2nd threshold | 3rd threshold | 4th threshold | ||||||
| 1994-95 | 1995 | 33,000 | 1994-95 | 1995 | 5,400 | 20,700 | 38,000 | 50,000 | |
| 1995-96 | 1996 | 35,000 | 1995-96 | 1996 | 5,400 | 20,700 | 38,000 | 50,000 | |
| 1996-97 | 1997 | 36,000 | 1996-97 | 1997 | 5,400 | 20,700 | 38,000 | 50,000 | |
| 1997-98 | 1998 | 37,000 | 1997-98 | 1998 | 5,400 | 20,700 | 38,000 | 50,000 | |
| 1998-99 | 1999 | 39,000 | 1998-99 | 1999 | 5,400 | 20,700 | 38,000 | 50,000 | |
| 1999-2000 | 2000 | 40,000 | 1999-2000 | 2000 | 5,400 | 20,700 | 38,000 | 50,000 | |
| 2000-01 | 2001 | 42,000 | 2000-01 | 2001 | 6,000 | 20,000 | 50,000 | 60,000 | |
| 2001-02 | 2002 | 44,000 | 2001-02 | 2002 | 6,000 | 20,000 | 50,000 | 60,000 | |
| 2002-03 | 2003 | 47,000 | 2002-03 | 2003 | 6,000 | 20,000 | 50,000 | 60,000 | |
| 2003-04 | 2004 | 49,000 | 2003-04 | 2004 | 6,000 | 21,600 | 52,000 | 62,500 | |
| 2004-05 | 2005 | 51,000 | 2004-05 | 2005 | 6,000 | 21,600 | 58,000 | 70,000 | |
| 2005-06 | 2006 | 53,000 | 2005-06 | 2006 | 6,000 | 21,600 | 63,000 | 95,000 | |
| 2006-07 | 2007 | 55,000 | 2006-07 | 2007 | 6,000 | 25,000 | 75,000 | 150,000 | |
| 2007-08 | 2008 | 58,000 | 2007-08 | 2008 | 6,000 | 30,000 | 75,000 | 150,000 | |
| 2008-09 | 2009 | 61,000 | 2008-09 | 2009 | 6,000 | 34,000 | 80,000 | 180,000 | |
| 2009-10 | 2010 | 65,000 | 2009-10 | 2010 | 6,000 | 35,000 | 80,000 | 180,000 | |
| 2010-11 | 2011 | 67,000 | 2010-11 | 2011 | 6,000 | 37,000 | 80,000 | 180,000 | |
| 2011-12 | 2012 | 70,000 | 2011-12 | 2012 | 6,000 | 37,000 | 80,000 | 180,000 | |
| 2012-13 | 2013 | 73,000 | 2012-13 | 2013 | 18,200 | 37,000 | 80,000 | 180,000 | |
| 2013-14 | 2014 | 75,000 | 2013-14 | 2014 | 18,200 | 37,000 | 80,000 | 180,000 | |
| 2014-15 | 2015 | 77,000 | 2014-15 | 2015 | 18,200 | 37,000 | 80,000 | 180,000 | |
| 2015-16 | 2016 | 79,000 | 2015-16 | 2016 | 18,200 | 37,000 | 80,000 | 180,000 | |
| 2016-17 | 2017 | 81,000 | 2016-17 | 2017 | 18,200 | 37,000 | 80,000 | 180,000 | |
| 2017-18 | 2018 | 84,000 | 2017-18 | 2018 | 18,200 | 37,000 | 80,000 | 180,000 | |
| 2018-19 | 2019 | 86,000 | 2018-19 | 2019 | 18,200 | 37,000 | 80,000 | 180,000 | |
| 2019-20 | 2020 | 89,000 | 2019-20 | 2020 | 18,200 | 37,000 | 80,000 | 180,000 | |
| 2020-21 | 2021 | 93,000 | 2020-21 | 2021 | 18,200 | 37,000 | 80,000 | 180,000 | |
| 2021-22 | 2022 | 96,000 | 2021-22 | 2022 | 18,200 | 37,000 | 80,000 | 180,000 | |
| 2022-23 | 2023 | 100,000 | 2022-23 | 2023 | 18,200 | 37,000 | 80,000 | 180,000 | |
| 2023-24 | 2024 | 104,000 | 2023-24 | 2024 | 18,200 | 37,000 | 80,000 | 180,000 | |
Note: Chart 2.24 is based on the data provided above.
Chart 2.25 Historical composition of tax
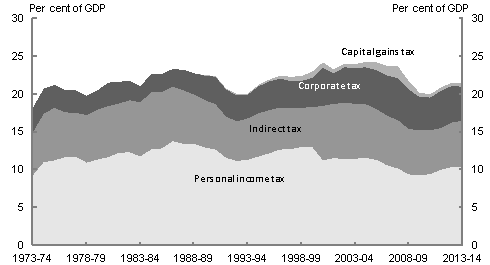
Source: Treasury.
| Personal income tax | Corporate | Indirect tax | Capital gains tax | |
|---|---|---|---|---|
| 1973-74 | 9.2 | 3.2 | 5.7 | 0 |
| 1974-75 | 11 | 3.3 | 6.4 | 0 |
| 1975-76 | 11.2 | 3 | 6.9 | 0 |
| 1976-77 | 11.6 | 2.9 | 5.9 | 0 |
| 1977-78 | 11.7 | 3 | 5.8 | 0 |
| 1978-79 | 10.9 | 2.6 | 6.3 | 0 |
| 1979-80 | 11.3 | 2.5 | 6.6 | 0 |
| 1980-81 | 11.6 | 3.1 | 6.7 | 0 |
| 1981-82 | 12.2 | 2.9 | 6.5 | 0 |
| 1982-83 | 12.3 | 2.6 | 6.9 | 0 |
| 1983-84 | 11.7 | 2.1 | 7.2 | 0 |
| 1984-85 | 12.6 | 2.4 | 7.5 | 0 |
| 1985-86 | 12.8 | 2.4 | 7.5 | 0 |
| 1986-87 | 13.7 | 2.4 | 7.2 | 0 |
| 1987-88 | 13.4 | 2.7 | 7 | 0 |
| 1988-89 | 13.4 | 2.8 | 6.5 | 0 |
| 1989-90 | 12.9 | 3.2 | 6.3 | 0.1 |
| 1990-91 | 12.6 | 3.6 | 6 | 0.1 |
| 1991-92 | 11.5 | 3.6 | 5.4 | 0.1 |
| 1992-93 | 11.1 | 3.4 | 5.2 | 0.2 |
| 1993-94 | 11.3 | 3.1 | 5.5 | 0.1 |
| 1994-95 | 11.7 | 3.6 | 5.7 | 0.2 |
| 1995-96 | 12.1 | 3.8 | 5.7 | 0.3 |
| 1996-97 | 12.6 | 3.8 | 5.5 | 0.4 |
| 1997-98 | 12.7 | 3.5 | 5.5 | 0.6 |
| 1998-99 | 13 | 3.5 | 5.2 | 0.6 |
| 1999-00 | 13 | 3.9 | 5.3 | 0.8 |
| 2000-01 | 11.2 | 5 | 7.2 | 0.8 |
| 2001-02 | 11.5 | 4 | 7.1 | 0.6 |
| 2002-03 | 11.4 | 4.7 | 7.4 | 0.5 |
| 2003-04 | 11.4 | 4.8 | 7.2 | 0.5 |
| 2004-05 | 11.5 | 4.9 | 7.1 | 0.7 |
| 2005-06 | 11.3 | 5.1 | 6.7 | 1.1 |
| 2006-07 | 10.5 | 5.3 | 6.5 | 1.3 |
| 2007-08 | 10.1 | 5.6 | 6.4 | 1.6 |
| 2008-09 | 9.4 | 5.3 | 6 | 1.1 |
| 2009-10 | 9.2 | 4.3 | 6 | 0.6 |
| 2010-11 | 9.4 | 4.3 | 5.8 | 0.5 |
| 2011-12 | 10 | 4.9 | 5.5 | 0.4 |
| 2012-13 | 10.3 | 4.8 | 5.9 | 0.4 |
| 2013-14 | 10.4 | 4.5 | 6.1 | 0.5 |
Chart 2.26 Expenditure on medical care and health expenses as a percentage of total household expenditure by age of reference person
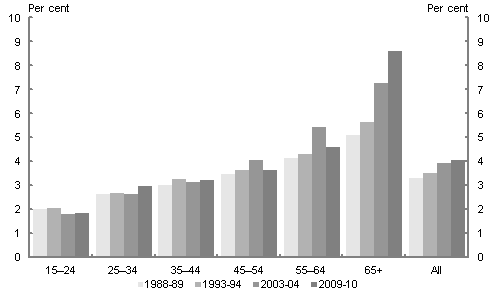
Source: ABS cat. no. 6530.0.
| 1988‑89 | 1993‑94 | 2003‑04 | 2009‑10 | |
|---|---|---|---|---|
| 15–24 | 2.0 | 2.1 | 1.8 | 1.8 |
| 25–34 | 2.7 | 2.7 | 2.6 | 3.0 |
| 35–44 | 3.0 | 3.3 | 3.1 | 3.2 |
| 45–54 | 3.5 | 3.6 | 4.1 | 3.6 |
| 55–64 | 4.2 | 4.3 | 5.5 | 4.6 |
| 65+ | 5.1 | 5.7 | 7.3 | 8.6 |
| All | 3.3 | 3.5 | 3.9 | 4.1 |
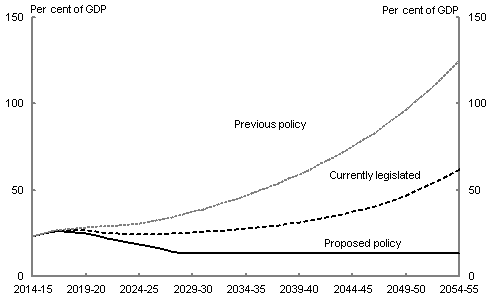
Source: Treasury projections. Projections assume trend economic growth from 2021–22 to 2054–55.
| Proposed policy | Currently legislated | Previous policy | |
|---|---|---|---|
| 2014‑15 | 23.0 | 22.9 | 22.8 |
| 2015‑16 | 24.7 | 24.7 | 24.7 |
| 2016‑17 | 26.1 | 26.2 | 26.5 |
| 2017‑18 | 26.0 | 26.4 | 27.3 |
| 2018‑19 | 25.6 | 26.4 | 27.8 |
| 2019‑20 | 24.9 | 26.3 | 28.4 |
| 2020‑21 | 23.5 | 25.7 | 28.7 |
| 2021‑22 | 22.1 | 25.1 | 28.7 |
| 2022‑23 | 20.9 | 24.8 | 29.3 |
| 2023‑24 | 19.7 | 24.5 | 29.8 |
| 2024‑25 | 18.5 | 24.4 | 30.7 |
| 2025‑26 | 17.2 | 24.4 | 31.7 |
| 2026‑27 | 15.9 | 24.5 | 32.9 |
| 2027‑28 | 14.5 | 24.7 | 34.3 |
| 2028‑29 | 13.2 | 25.1 | 35.8 |
| 2029‑30 | 13.0 | 25.4 | 37.3 |
| 2030‑31 | 13.0 | 25.8 | 39.0 |
| 2031‑32 | 13.0 | 26.2 | 40.8 |
| 2032‑33 | 13.0 | 26.6 | 42.7 |
| 2033‑34 | 13.0 | 27.1 | 44.7 |
| 2034‑35 | 13.0 | 27.7 | 46.8 |
| 2035‑36 | 13.0 | 28.3 | 49.0 |
| 2036‑37 | 13.0 | 28.9 | 51.4 |
| 2037‑38 | 13.0 | 29.7 | 53.9 |
| 2038‑39 | 13.0 | 30.5 | 56.5 |
| 2039‑40 | 13.0 | 31.3 | 59.2 |
| 2040‑41 | 13.0 | 32.3 | 62.1 |
| 2041‑42 | 13.0 | 33.4 | 65.2 |
| 2042‑43 | 13.0 | 34.6 | 68.4 |
| 2043‑44 | 13.0 | 35.9 | 71.7 |
| 2044‑45 | 13.0 | 37.3 | 75.3 |
| 2045‑46 | 13.0 | 38.9 | 79.1 |
| 2046‑47 | 13.0 | 40.6 | 83.0 |
| 2047‑48 | 13.0 | 42.4 | 87.2 |
| 2048‑49 | 13.0 | 44.6 | 91.9 |
| 2049‑50 | 13.0 | 47.0 | 96.7 |
| 2050‑51 | 13.0 | 49.6 | 101.9 |
| 2051‑52 | 13.0 | 52.4 | 107.3 |
| 2052‑53 | 13.0 | 55.3 | 113.0 |
| 2053‑54 | 13.0 | 58.5 | 118.9 |
| 2054‑55 | 13.0 | 61.8 | 125.1 |
Chart 2.28 Net interest payments (2014–15 dollars)
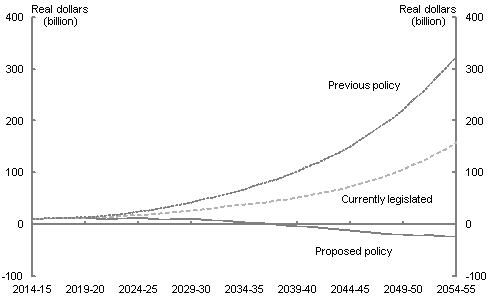
Source: Treasury projections. Projections assume trend economic growth from 2021–22 to 2054–55.
| $billions | |||
|---|---|---|---|
| Proposed policy | Currently legislated | Previous policy | |
| 2014‑15 | 10.8 | 10.7 | 10.7 |
| 2015‑16 | 11.0 | 11.1 | 11.1 |
| 2016‑17 | 11.5 | 11.7 | 11.8 |
| 2017‑18 | 11.8 | 12.2 | 12.6 |
| 2018‑19 | 11.8 | 12.6 | 13.5 |
| 2019‑20 | 11.4 | 12.9 | 14.3 |
| 2020‑21 | 10.9 | 13.4 | 15.7 |
| 2021‑22 | 10.4 | 13.7 | 16.7 |
| 2022‑23 | 11.1 | 15.4 | 19.5 |
| 2023‑24 | 11.0 | 16.6 | 21.7 |
| 2024‑25 | 11.1 | 18.3 | 24.8 |
| 2025‑26 | 10.9 | 20.1 | 28.1 |
| 2026‑27 | 10.6 | 21.8 | 31.5 |
| 2027‑28 | 10.2 | 23.9 | 35.6 |
| 2028‑29 | 9.6 | 26.0 | 39.6 |
| 2029‑30 | 10.1 | 27.8 | 43.6 |
| 2030‑31 | 9.6 | 29.9 | 48.2 |
| 2031‑32 | 8.6 | 31.8 | 52.6 |
| 2032‑33 | 7.6 | 34.0 | 57.6 |
| 2033‑34 | 6.3 | 36.0 | 62.7 |
| 2034‑35 | 5.0 | 38.1 | 68.1 |
| 2035‑36 | 3.7 | 40.9 | 74.5 |
| 2036‑37 | 2.3 | 43.5 | 80.9 |
| 2037‑38 | 0.6 | 46.1 | 87.5 |
| 2038‑39 | ‑ 1.2 | 48.9 | 94.6 |
| 2039‑40 | ‑ 3.0 | 52.0 | 102.1 |
| 2040‑41 | ‑ 4.5 | 56.0 | 111.6 |
| 2041‑42 | ‑ 6.3 | 59.7 | 120.4 |
| 2042‑43 | ‑ 8.2 | 63.6 | 129.9 |
| 2043‑44 | ‑ 10.0 | 67.9 | 140.0 |
| 2044‑45 | ‑ 11.8 | 72.7 | 150.9 |
| 2045‑46 | ‑ 13.3 | 78.7 | 164.3 |
| 2046‑47 | ‑ 15.0 | 84.3 | 176.9 |
| 2047‑48 | ‑ 16.7 | 90.6 | 190.5 |
| 2048‑49 | ‑ 18.3 | 97.9 | 205.6 |
| 2049‑50 | ‑ 19.6 | 105.6 | 221.5 |
| 2050‑51 | ‑ 20.3 | 115.3 | 241.1 |
| 2051‑52 | ‑ 21.2 | 124.5 | 259.6 |
| 2052‑53 | ‑ 21.8 | 134.6 | 279.4 |
| 2053‑54 | ‑ 22.2 | 145.6 | 300.7 |
| 2054‑55 | ‑ 22.3 | 157.6 | 323.6 |
Chart 2.29 Defined benefit unfunded superannuation liabilities
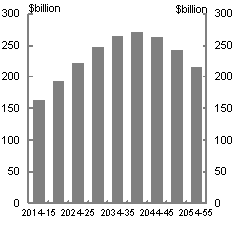
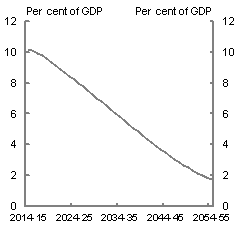
Source: The Australian Government Actuary.
| Defined benefit super liabilities, $billion | |
|---|---|
| 2014‑15 | 163 |
| 2019‑20 | 193 |
| 2024‑25 | 222 |
| 2029‑30 | 247 |
| 2034‑35 | 265 |
| 2039‑40 | 272 |
| 2044‑45 | 264 |
| 2049‑50 | 242 |
| 2054‑55 | 214 |
| Defined benefit super liabilities, per cent of GDP | |
|---|---|
| 2014‑15 | 10.2 |
| 2015‑16 | 10.1 |
| 2016‑17 | 9.9 |
| 2017‑18 | 9.8 |
| 2018‑19 | 9.6 |
| 2019‑20 | 9.4 |
| 2020‑21 | 9.1 |
| 2021‑22 | 8.9 |
| 2022‑23 | 8.7 |
| 2023‑24 | 8.4 |
| 2024‑25 | 8.2 |
| 2025‑26 | 8.0 |
| 2026‑27 | 7.7 |
| 2027‑28 | 7.5 |
| 2028‑29 | 7.3 |
| 2029‑30 | 7.0 |
| 2030‑31 | 6.8 |
| 2031‑32 | 6.5 |
| 2032‑33 | 6.3 |
| 2033‑34 | 6.0 |
| 2034‑35 | 5.8 |
| 2035‑36 | 5.6 |
| 2036‑37 | 5.3 |
| 2037‑38 | 5.1 |
| 2038‑39 | 4.8 |
| 2039‑40 | 4.6 |
| 2040‑41 | 4.4 |
| 2041‑42 | 4.1 |
| 2042‑43 | 3.9 |
| 2043‑44 | 3.7 |
| 2044‑45 | 3.5 |
| 2045‑46 | 3.2 |
| 2046‑47 | 3.0 |
| 2047‑48 | 2.8 |
| 2048‑49 | 2.7 |
| 2049‑50 | 2.5 |
| 2050‑51 | 2.3 |
| 2051‑52 | 2.2 |
| 2052‑53 | 2.0 |
| 2053‑54 | 1.9 |
| 2054‑55 | 1.7 |