Chart 1.2 Australia's historical and projected total fertility rate
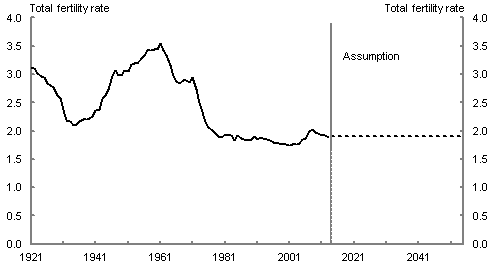
Note: The total fertility rate is the number of children a woman would bear during her lifetime if she experienced the current age–specific fertility rates at each age of her reproductive life.
Source: ABS cat. no. 3105.0.65.001, 3301.0 and Treasury projections.
| History | Assumption | |
|---|---|---|
| 1921 | 3.1 | |
| 1922 | 3.1 | |
| 1923 | 3.0 | |
| 1924 | 3.0 | |
| 1925 | 3.0 | |
| 1926 | 2.8 | |
| 1927 | 2.8 | |
| 1928 | 2.8 | |
| 1929 | 2.6 | |
| 1930 | 2.6 | |
| 1931 | 2.4 | |
| 1932 | 2.2 | |
| 1933 | 2.2 | |
| 1934 | 2.1 | |
| 1935 | 2.1 | |
| 1936 | 2.2 | |
| 1937 | 2.2 | |
| 1938 | 2.2 | |
| 1939 | 2.2 | |
| 1940 | 2.3 | |
| 1941 | 2.4 | |
| 1942 | 2.4 | |
| 1943 | 2.6 | |
| 1944 | 2.6 | |
| 1945 | 2.7 | |
| 1946 | 3.0 | |
| 1947 | 3.1 | |
| 1948 | 3.0 | |
| 1949 | 3.0 | |
| 1950 | 3.1 | |
| 1951 | 3.1 | |
| 1952 | 3.2 | |
| 1953 | 3.2 | |
| 1954 | 3.2 | |
| 1955 | 3.3 | |
| 1956 | 3.3 | |
| 1957 | 3.4 | |
| 1958 | 3.4 | |
| 1959 | 3.4 | |
| 1960 | 3.5 | |
| 1961 | 3.5 | |
| 1962 | 3.4 | |
| 1963 | 3.3 | |
| 1964 | 3.2 | |
| 1965 | 3.0 | |
| 1966 | 2.9 | |
| 1967 | 2.8 | |
| 1968 | 2.9 | |
| 1969 | 2.9 | |
| 1970 | 2.9 | |
| 1971 | 2.9 | |
| 1972 | 2.7 | |
| 1973 | 2.5 | |
| 1974 | 2.3 | |
| 1975 | 2.1 | |
| 1976 | 2.1 | |
| 1977 | 2.0 | |
| 1978 | 1.9 | |
| 1979 | 1.9 | |
| 1980 | 1.9 | |
| 1981 | 1.9 | |
| 1982 | 1.9 | |
| 1983 | 1.9 | |
| 1984 | 1.8 | |
| 1985 | 1.9 | |
| 1986 | 1.9 | |
| 1987 | 1.8 | |
| 1988 | 1.8 | |
| 1989 | 1.8 | |
| 1990 | 1.9 | |
| 1991 | 1.8 | |
| 1992 | 1.9 | |
| 1993 | 1.9 | |
| 1994 | 1.8 | |
| 1995 | 1.8 | |
| 1996 | 1.8 | |
| 1997 | 1.8 | |
| 1998 | 1.8 | |
| 1999 | 1.8 | |
| 2000 | 1.8 | |
| 2001 | 1.7 | |
| 2002 | 1.8 | |
| 2003 | 1.8 | |
| 2004 | 1.8 | |
| 2005 | 1.8 | |
| 2006 | 1.9 | |
| 2007 | 2.0 | |
| 2008 | 2.0 | |
| 2009 | 2.0 | |
| 2010 | 2.0 | |
| 2011 | 1.9 | |
| 2012 | 1.9 | |
| 2013 | 1.9 | |
| 2014 | 1.9 | |
| 2015 | 1.9 | |
| 2016 | 1.9 | |
| 2017 | 1.9 | |
| 2018 | 1.9 | |
| 2019 | 1.9 | |
| 2020 | 1.9 | |
| 2021 | 1.9 | |
| 2022 | 1.9 | |
| 2023 | 1.9 | |
| 2024 | 1.9 | |
| 2025 | 1.9 | |
| 2026 | 1.9 | |
| 2027 | 1.9 | |
| 2028 | 1.9 | |
| 2029 | 1.9 | |
| 2030 | 1.9 | |
| 2031 | 1.9 | |
| 2032 | 1.9 | |
| 2033 | 1.9 | |
| 2034 | 1.9 | |
| 2035 | 1.9 | |
| 2036 | 1.9 | |
| 2037 | 1.9 | |
| 2038 | 1.9 | |
| 2039 | 1.9 | |
| 2040 | 1.9 | |
| 2041 | 1.9 | |
| 2042 | 1.9 | |
| 2043 | 1.9 | |
| 2044 | 1.9 | |
| 2045 | 1.9 | |
| 2046 | 1.9 | |
| 2047 | 1.9 | |
| 2048 | 1.9 | |
| 2049 | 1.9 | |
| 2050 | 1.9 | |
| 2051 | 1.9 | |
| 2052 | 1.9 | |
| 2053 | 1.9 | |
| 2054 | 1.9 | |
| 2055 | 1.9 |
Chart 1.3 Male and female life expectancy, 1905 to 2055
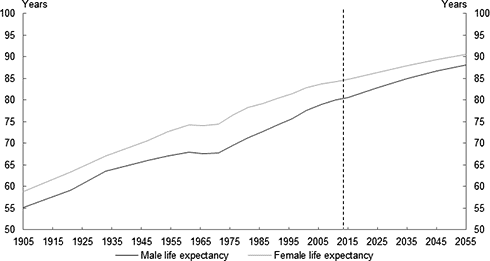
Note: These figures are period life expectancies.
Source: ABS cat. no. 3105.0.65.001 and Treasury projections.
| Male life expectancy | Female life expectancy | |
|---|---|---|
| 1905 | 55.2 | 58.8 |
| 1921 | 59.2 | 63.3 |
| 1933 | 63.5 | 67.1 |
| 1947 | 66.1 | 70.6 |
| 1954 | 67.1 | 72.8 |
| 1961 | 67.9 | 74.2 |
| 1966 | 67.6 | 74.2 |
| 1971 | 67.8 | 74.5 |
| 1976 | 69.6 | 76.6 |
| 1981 | 71.2 | 78.3 |
| 1986 | 72.7 | 79.2 |
| 1991 | 74.3 | 80.4 |
| 1996 | 75.7 | 81.4 |
| 2001 | 77.6 | 82.9 |
| 2006 | 79.0 | 83.7 |
| 2011 | 80.1 | 84.3 |
| 2015 | 80.6 | 84.8 |
| 2025 | 82.9 | 86.4 |
| 2035 | 84.9 | 87.9 |
| 2045 | 86.6 | 89.3 |
| 2055 | 88.1 | 90.5 |
Chart 1.4 Age distribution of Australia's population and migrants
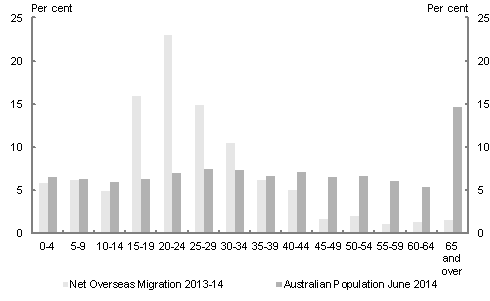
Source: ABS cat. no. 3101.0 and 3412.0.
| Net Overseas Migration 2013-14 | Australian Population June 2014 | |
|---|---|---|
| 0-4 | 5.8 | 6.5 |
| 5-9 | 6.2 | 6.3 |
| 10-14 | 5.0 | 6.0 |
| 15-19 | 16.0 | 6.3 |
| 20-24 | 23.0 | 7.0 |
| 25-29 | 14.9 | 7.5 |
| 30-34 | 10.5 | 7.3 |
| 35-39 | 6.2 | 6.6 |
| 40-44 | 5.0 | 7.1 |
| 45-49 | 1.6 | 6.6 |
| 50-54 | 2.0 | 6.6 |
| 55-59 | 1.0 | 6.1 |
| 60-64 | 1.3 | 5.4 |
| 65 and over | 1.5 | 14.7 |
Chart 1.5 Net overseas migration as a percentage of the population
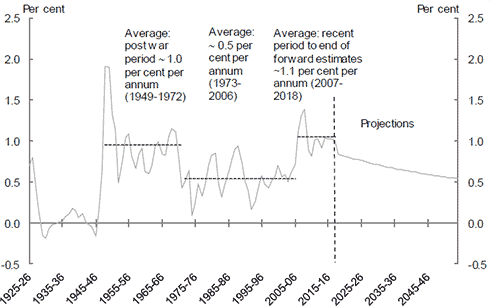
Source: ABS cat. no. 3105.0.65.001, 3101.0 and Treasury projections.
| NOM (per cent) | |
|---|---|
| 1925-26 | 0.7 |
| 1926-27 | 0.8 |
| 1927-28 | 0.5 |
| 1928-29 | 0.2 |
| 1929-30 | -0.2 |
| 1930-31 | -0.2 |
| 1931-32 | -0.1 |
| 1932-33 | 0.0 |
| 1933-34 | 0.0 |
| 1934-35 | 0.0 |
| 1935-36 | 0.0 |
| 1936-37 | 0.1 |
| 1937-38 | 0.1 |
| 1938-39 | 0.2 |
| 1939-40 | 0.2 |
| 1940-41 | 0.1 |
| 1941-42 | 0.1 |
| 1942-43 | 0.0 |
| 1943-44 | 0.0 |
| 1944-45 | 0.0 |
| 1945-46 | -0.2 |
| 1946-47 | 0.2 |
| 1947-48 | 0.6 |
| 1948-49 | 1.9 |
| 1949-50 | 1.9 |
| 1950-51 | 1.3 |
| 1951-52 | 1.1 |
| 1952-53 | 0.5 |
| 1953-54 | 0.8 |
| 1954-55 | 1.0 |
| 1955-56 | 1.1 |
| 1956-57 | 0.8 |
| 1957-58 | 0.7 |
| 1958-59 | 0.8 |
| 1959-60 | 0.9 |
| 1960-61 | 0.6 |
| 1961-62 | 0.6 |
| 1962-63 | 0.7 |
| 1963-64 | 0.9 |
| 1964-65 | 1.0 |
| 1965-66 | 0.8 |
| 1966-67 | 0.8 |
| 1967-68 | 1.0 |
| 1968-69 | 1.2 |
| 1969-70 | 1.1 |
| 1970-71 | 0.8 |
| 1971-72 | 0.4 |
| 1972-73 | 0.5 |
| 1973-74 | 0.6 |
| 1974-75 | 0.1 |
| 1975-76 | 0.2 |
| 1976-77 | 0.5 |
| 1977-78 | 0.3 |
| 1978-79 | 0.5 |
| 1979-80 | 0.7 |
| 1980-81 | 0.8 |
| 1981-82 | 0.9 |
| 1982-83 | 0.5 |
| 1983-84 | 0.3 |
| 1984-85 | 0.5 |
| 1985-86 | 0.6 |
| 1986-87 | 0.8 |
| 1987-88 | 0.9 |
| 1988-89 | 0.9 |
| 1989-90 | 0.7 |
| 1990-91 | 0.5 |
| 1991-92 | 0.4 |
| 1992-93 | 0.2 |
| 1993-94 | 0.3 |
| 1994-95 | 0.4 |
| 1995-96 | 0.6 |
| 1996-97 | 0.5 |
| 1997-98 | 0.4 |
| 1998-99 | 0.5 |
| 1999-00 | 0.6 |
| 2000-01 | 0.7 |
| 2001-02 | 0.6 |
| 2002-03 | 0.6 |
| 2003-04 | 0.5 |
| 2004-05 | 0.6 |
| 2005-06 | 0.7 |
| 2006-07 | 1.1 |
| 2007-08 | 1.3 |
| 2008-09 | 1.4 |
| 2009-10 | 0.9 |
| 2010-11 | 0.8 |
| 2011-12 | 1.0 |
| 2012-13 | 1.0 |
| 2013-14 | 0.9 |
| 2014-15 | 1.0 |
| 2015-16 | 1.0 |
| 2016-17 | 1.0 |
| 2017-18 | 1.0 |
| 2018-19 | 0.8 |
| 2019-20 | 0.8 |
| 2020-21 | 0.8 |
| 2021-22 | 0.8 |
| 2022-23 | 0.8 |
| 2023-24 | 0.8 |
| 2024-25 | 0.8 |
| 2025-26 | 0.8 |
| 2026-27 | 0.8 |
| 2027-28 | 0.7 |
| 2028-29 | 0.7 |
| 2029-30 | 0.7 |
| 2030-31 | 0.7 |
| 2031-32 | 0.7 |
| 2032-33 | 0.7 |
| 2033-34 | 0.7 |
| 2034-35 | 0.7 |
| 2035-36 | 0.7 |
| 2036-37 | 0.7 |
| 2037-38 | 0.7 |
| 2038-39 | 0.6 |
| 2039-40 | 0.6 |
| 2040-41 | 0.6 |
| 2041-42 | 0.6 |
| 2042-43 | 0.6 |
| 2043-44 | 0.6 |
| 2044-45 | 0.6 |
| 2045-46 | 0.6 |
| 2046-47 | 0.6 |
| 2047-48 | 0.6 |
| 2048-49 | 0.6 |
| 2049-50 | 0.6 |
| 2050-51 | 0.6 |
| 2051-52 | 0.6 |
| 2052-53 | 0.6 |
| 2053-54 | 0.5 |
| 2054-55 | 0.5 |
Chart 1.6 Proportion of population aged 65 and over
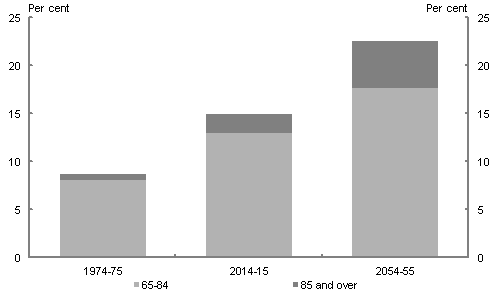
Source: ABS cat. no. 3105.0.65.001, 3101.0 and Treasury projections.
| 65-84 | 85 and over | |
|---|---|---|
| 1975 | 8.1 | 0.6 |
| 2015 | 13.0 | 2.0 |
| 2055 | 17.7 | 4.9 |
Chart 1.7 Number of centenarians
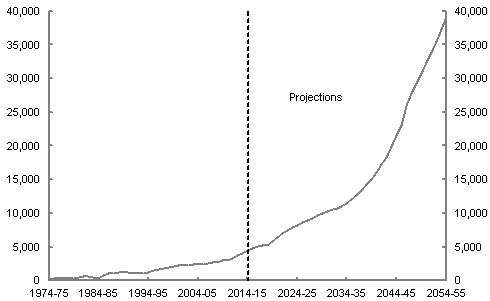
Source: ABS cat. no. 3105.0.65.001, 3101.0 and Treasury projections.
| Number of centenarians | |
|---|---|
| 1974-75 | 122 |
| 1975-76 | 293 |
| 1976-77 | 336 |
| 1977-78 | 297 |
| 1978-79 | 291 |
| 1979-80 | 363 |
| 1980-81 | 443 |
| 1 981-82 |
557 |
| 1982-83 | 664 |
| 1983-84 | 406 |
| 1984-85 | 356 |
| 1985-86 | 839 |
| 1986-87 | 1,041 |
| 1987-88 | 1,129 |
| 1988-89 | 1,222 |
| 1989-90 | 1,316 |
| 1990-91 | 1,268 |
| 1991-92 | 1,077 |
| 1992-93 | 1,012 |
| 1993-94 | 1,115 |
| 1994-95 | 1,254 |
| 1995-96 | 1,521 |
| 1996-97 | 1,720 |
| 1997-98 | 1,823 |
| 1998-99 | 1,893 |
| 1999-00 | 2,113 |
| 2000-01 | 2,281 |
| 2001-02 | 2,281 |
| 2002-03 | 2,304 |
| 2003-04 | 2,351 |
| 2004-05 | 2,402 |
| 2005-06 | 2,414 |
| 2006-07 | 2,579 |
| 2007-08 | 2,724 |
| 2008-09 | 2,754 |
| 2009-10 | 2,943 |
| 2010-11 | 3,052 |
| 2011-12 | 3,297 |
| 2012-13 | 3,755 |
| 2013-14 | 4,046 |
| 2014-15 | 4,493 |
| 2015-16 | 4,820 |
| 2016-17 | 5,011 |
| 2017-18 | 5,170 |
| 2018-19 | 5,285 |
| 2019-20 | 5,836 |
| 2020-21 | 6,460 |
| 2021-22 | 7,009 |
| 2022-23 | 7,411 |
| 2023-24 | 7,823 |
| 2024-25 | 8,217 |
| 2025-26 | 8,602 |
| 2026-27 | 8,946 |
| 2027-28 | 9,300 |
| 2028-29 | 9,622 |
| 2029-30 | 9,989 |
| 2030-31 | 10,329 |
| 2031-32 | 10,496 |
| 2032-33 | 10,740 |
| 2033-34 | 11,033 |
| 2034-35 | 11,462 |
| 2035-36 | 12,068 |
| 2036-37 | 12,698 |
| 2037-38 | 13,387 |
| 2038-39 | 14,208 |
| 2039-40 | 15,093 |
| 2040-41 | 16,011 |
| 2041-42 | 17,190 |
| 2042-43 | 18,257 |
| 2043-44 | 19,855 |
| 2044-45 | 21,487 |
| 2045-46 | 23,103 |
| 2046-47 | 26,012 |
| 2047-48 | 27,867 |
| 2048-49 | 29,279 |
| 2049-50 | 30,799 |
| 2050-51 | 32,326 |
| 2051-52 | 33,814 |
| 2052-53 | 35,576 |
| 2053-54 | 37,267 |
| 2054-55 | 39,185 |
Chart 1.8 Proportion of the Australian population in different age groups in 2014–15 and 2054–55 as a percentage of the total population
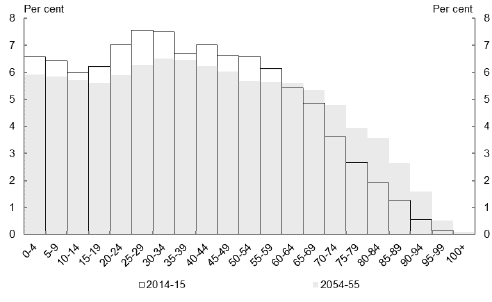
Source: Treasury projections.
| Per cent of total population | ||
|---|---|---|
| 2014-15 | 2054-55 | |
| 0-4 | 6.6 | 5.9 |
| 5-9 | 6.4 | 5.8 |
| 10-14 | 6.0 | 5.7 |
| 15-19 | 6.2 | 5.6 |
| 20-24 | 7.0 | 5.9 |
| 25-29 | 7.6 | 6.3 |
| 30-34 | 7.5 | 6.5 |
| 35-39 | 6.7 | 6.5 |
| 40-44 | 7.0 | 6.2 |
| 45-49 | 6.6 | 6.0 |
| 50-54 | 6.6 | 5.7 |
| 55-59 | 6.1 | 5.6 |
| 60-64 | 5.4 | 5.6 |
| 65-69 | 4.9 | 5.4 |
| 70-74 | 3.6 | 4.8 |
| 75-79 | 2.7 | 3.9 |
| 80-84 | 1.9 | 3.6 |
| 85-89 | 1.3 | 2.7 |
| 90-94 | 0.6 | 1.6 |
| 95-99 | 0.1 | 0.5 |
| 100+ | 0.0 | 0.1 |
Chart 1.9 Number of people aged from 15 to 64 relative to the number of people aged 65 and over
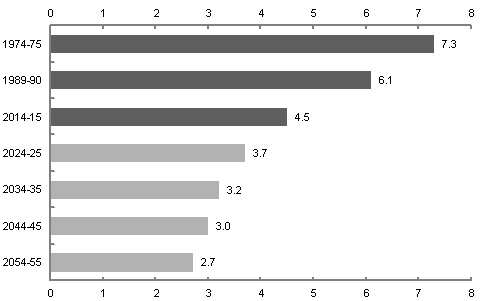
Source: ABS cat. no. 3105.0.65.001, 3101.0 and Treasury projections.
| Year | Number of people aged from 15 to 64 relative to the number of people aged 65 and over |
|---|---|
| 2054-55 | 2.7 |
| 2044-45 | 3.0 |
| 2034-35 | 3.2 |
| 2024-25 | 3.7 |
| 2014-15 | 4.5 |
| 1989-90 | 6.1 |
| 1974-75 | 7.3 |
Chart 1.10 Historical and projected participation rates
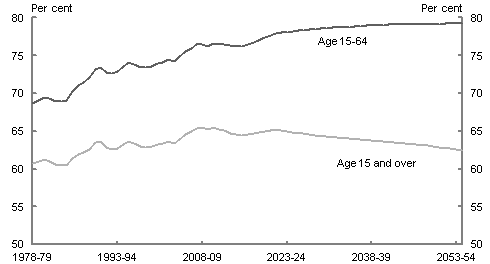
Source: ABS cat. no. 6291.0.55.001 and Treasury projections.
| 15-64 | 15 and over | |
|---|---|---|
| 1978-79 | 68.6 | 60.7 |
| 1979-80 | 69.1 | 61.0 |
| 1980-81 | 69.5 | 61.3 |
| 1981-82 | 69.3 | 61.0 |
| 1982-83 | 69.0 | 60.6 |
| 1983-84 | 69.0 | 60.5 |
| 1984-85 | 69.1 | 60.5 |
| 1985-86 | 70.3 | 61.4 |
| 1986-87 | 71.1 | 62.0 |
| 1987-88 | 71.4 | 62.2 |
| 1988-89 | 72.1 | 62.6 |
| 1989-90 | 73.2 | 63.5 |
| 1990-91 | 73.5 | 63.6 |
| 1991-92 | 72.8 | 62.9 |
| 1992-93 | 72.6 | 62.6 |
| 1993-94 | 72.9 | 62.7 |
| 1994-95 | 73.6 | 63.2 |
| 1995-96 | 74.1 | 63.6 |
| 1996-97 | 73.9 | 63.4 |
| 1997-98 | 73.4 | 63.0 |
| 1998-99 | 73.4 | 62.8 |
| 1999-00 | 73.6 | 63.0 |
| 2000-01 | 74.0 | 63.2 |
| 2001-02 | 74.1 | 63.3 |
| 2002-03 | 74.5 | 63.6 |
| 2003-04 | 74.3 | 63.4 |
| 2004-05 | 74.9 | 63.9 |
| 2005-06 | 75.6 | 64.5 |
| 2006-07 | 76.0 | 65.0 |
| 2007-08 | 76.4 | 65.4 |
| 2008-09 | 76.5 | 65.5 |
| 2009-10 | 76.2 | 65.3 |
| 2010-11 | 76.7 | 65.5 |
| 2011-12 | 76.5 | 65.3 |
| 2012-13 | 76.5 | 65.1 |
| 2013-14 | 76.3 | 64.7 |
| 2014-15 | 76.2 | 64.6 |
| 2015-16 | 76.2 | 64.5 |
| 2016-17 | 76.5 | 64.6 |
| 2017-18 | 76.7 | 64.7 |
| 2018-19 | 77.0 | 64.8 |
| 2019-20 | 77.4 | 64.9 |
| 2020-21 | 77.7 | 65.1 |
| 2021-22 | 77.9 | 65.1 |
| 2022-23 | 78.0 | 65.1 |
| 2023-24 | 78.1 | 65.0 |
| 2024-25 | 78.2 | 64.9 |
| 2025-26 | 78.3 | 64.8 |
| 2026-27 | 78.4 | 64.7 |
| 2027-28 | 78.4 | 64.6 |
| 2028-29 | 78.5 | 64.5 |
| 2029-30 | 78.6 | 64.4 |
| 2030-31 | 78.6 | 64.3 |
| 2031-32 | 78.7 | 64.2 |
| 2032-33 | 78.7 | 64.1 |
| 2033-34 | 78.8 | 64.1 |
| 2034-35 | 78.8 | 64.0 |
| 2035-36 | 78.9 | 64.0 |
| 2036-37 | 78.9 | 63.9 |
| 2037-38 | 79.0 | 63.8 |
| 2038-39 | 79.0 | 63.8 |
| 2039-40 | 79.0 | 63.7 |
| 2040-41 | 79.1 | 63.6 |
| 2041-42 | 79.1 | 63.6 |
| 2042-43 | 79.1 | 63.5 |
| 2043-44 | 79.1 | 63.4 |
| 2044-45 | 79.1 | 63.4 |
| 2045-46 | 79.1 | 63.3 |
| 2046-47 | 79.1 | 63.2 |
| 2047-48 | 79.1 | 63.2 |
| 2048-49 | 79.1 | 63.1 |
| 2049-50 | 79.2 | 63.0 |
| 2050-51 | 79.2 | 62.9 |
| 2051-52 | 79.2 | 62.8 |
| 2052-53 | 79.2 | 62.7 |
| 2053-54 | 79.3 | 62.5 |
| 2054-55 | 79.3 | 62.4 |
Chart 1.11 Participation rates in 1975, 2015 and 2055 by age group
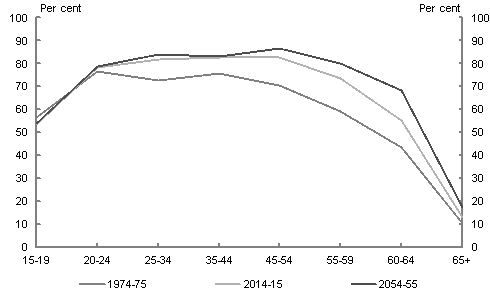
Source: ABS cat. no. 6291.0.55.001 and Treasury projections.
| 1974-75 | 2014-15 | 2054-55 | |
|---|---|---|---|
| 15-19 | 56.4 | 53.6 | 54.1 |
| 20-24 | 76.8 | 78.2 | 79.0 |
| 25-34 | 72.7 | 81.7 | 84.2 |
| 35-44 | 75.6 | 82.6 | 83.2 |
| 45-54 | 70.4 | 82.7 | 86.8 |
| 55-59 | 59.3 | 73.5 | 80.3 |
| 60-64 | 43.6 | 55.2 | 68.2 |
| 65+ | 10.2 | 12.9 | 17.3 |
Chart 1.12 Participation rates of people aged 65 years and over
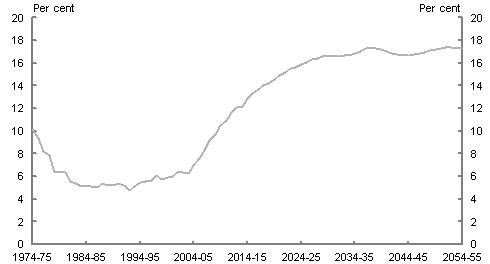
Source: ABS cat. no. 6291.0.55.001 and Treasury projections.
| Participation rate | |
|---|---|
| 1974-75 | 10.2 |
| 1975-76 | 9.4 |
| 1976-77 | 8.2 |
| 1977-78 | 7.9 |
| 1978-79 | 6.4 |
| 1979-80 | 6.3 |
| 1980-81 | 6.3 |
| 1981-82 | 5.6 |
| 1982-83 | 5.4 |
| 1983-84 | 5.1 |
| 1984-85 | 5.1 |
| 1985-86 | 5.1 |
| 1986-87 | 5.0 |
| 1987-88 | 5.4 |
| 1988-89 | 5.2 |
| 1989-90 | 5.2 |
| 1990-91 | 5.4 |
| 1991-92 | 5.2 |
| 1992-93 | 4.8 |
| 1993-94 | 5.1 |
| 1994-95 | 5.5 |
| 1995-96 | 5.6 |
| 1996-97 | 5.6 |
| 1997-98 | 6.1 |
| 1998-99 | 5.7 |
| 1999-00 | 6.0 |
| 2000-01 | 6.0 |
| 2001-02 | 6.4 |
| 2002-03 | 6.4 |
| 2003-04 | 6.3 |
| 2004-05 | 7.0 |
| 2005-06 | 7.6 |
| 2006-07 | 8.3 |
| 2007-08 | 9.1 |
| 2008-09 | 9.7 |
| 2009-10 | 10.5 |
| 2010-11 | 11.0 |
| 2011-12 | 11.7 |
| 2012-13 | 12.1 |
| 2013-14 | 12.2 |
| 2014-15 | 12.9 |
| 2015-16 | 13.3 |
| 2016-17 | 13.7 |
| 2017-18 | 14.0 |
| 2018-19 | 14.2 |
| 2019-20 | 14.6 |
| 2020-21 | 14.9 |
| 2021-22 | 15.2 |
| 2022-23 | 15.5 |
| 2023-24 | 15.7 |
| 2024-25 | 15.9 |
| 2025-26 | 16.0 |
| 2026-27 | 16.3 |
| 2027-28 | 16.4 |
| 2028-29 | 16.6 |
| 2029-30 | 16.6 |
| 2030-31 | 16.6 |
| 2031-32 | 16.6 |
| 2032-33 | 16.7 |
| 2033-34 | 16.7 |
| 2034-35 | 16.9 |
| 2035-36 | 17.0 |
| 2036-37 | 17.3 |
| 2037-38 | 17.4 |
| 2038-39 | 17.3 |
| 2039-40 | 17.2 |
| 2040-41 | 17.1 |
| 2041-42 | 16.9 |
| 2042-43 | 16.8 |
| 2043-44 | 16.7 |
| 2044-45 | 16.7 |
| 2045-46 | 16.7 |
| 2046-47 | 16.9 |
| 2047-48 | 17.0 |
| 2048-49 | 17.1 |
| 2049-50 | 17.2 |
| 2050-51 | 17.3 |
| 2051-52 | 17.4 |
| 2052-53 | 17.4 |
| 2053-54 | 17.3 |
| 2054-55 | 17.3 |
Chart 1.13 Participation rates by net overseas migration assumptions
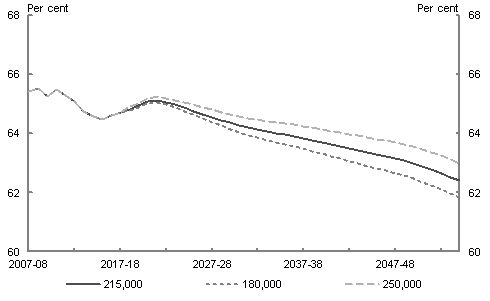
Source: ABS cat. no. 6291.0.55.001 and Treasury projections.
| 180,000 NOM | 215,000 NOM | 250,000 NOM | |
|---|---|---|---|
| 2007-08 | 65.4 | 65.4 | 65.4 |
| 2008-09 | 65.5 | 65.5 | 65.5 |
| 2009-10 | 65.3 | 65.3 | 65.3 |
| 2010-11 | 65.5 | 65.5 | 65.5 |
| 2011-12 | 65.3 | 65.3 | 65.3 |
| 2012-13 | 65.1 | 65.1 | 65.1 |
| 2013-14 | 64.7 | 64.7 | 64.7 |
| 2014-15 | 64.6 | 64.6 | 64.6 |
| 2015-16 | 64.5 | 64.5 | 64.5 |
| 2016-17 | 64.6 | 64.6 | 64.6 |
| 2017-18 | 64.7 | 64.7 | 64.7 |
| 2018-19 | 64.8 | 64.8 | 64.9 |
| 2019-20 | 64.9 | 64.9 | 65.0 |
| 2020-21 | 65.0 | 65.1 | 65.2 |
| 2021-22 | 65.1 | 65.1 | 65.3 |
| 2022-23 | 65.0 | 65.1 | 65.2 |
| 2023-24 | 64.9 | 65.0 | 65.1 |
| 2024-25 | 64.8 | 64.9 | 65.1 |
| 2025-26 | 64.6 | 64.8 | 65.0 |
| 2026-27 | 64.5 | 64.7 | 64.9 |
| 2027-28 | 64.4 | 64.6 | 64.8 |
| 2028-29 | 64.3 | 64.5 | 64.7 |
| 2029-30 | 64.2 | 64.4 | 64.6 |
| 2030-31 | 64.0 | 64.3 | 64.6 |
| 2031-32 | 63.9 | 64.2 | 64.5 |
| 2032-33 | 63.9 | 64.1 | 64.5 |
| 2033-34 | 63.8 | 64.1 | 64.4 |
| 2034-35 | 63.7 | 64.0 | 64.4 |
| 2035-36 | 63.6 | 64.0 | 64.3 |
| 2036-37 | 63.6 | 63.9 | 64.3 |
| 2037-38 | 63.5 | 63.8 | 64.3 |
| 2038-39 | 63.4 | 63.8 | 64.2 |
| 2039-40 | 63.3 | 63.7 | 64.1 |
| 2040-41 | 63.2 | 63.6 | 64.1 |
| 2041-42 | 63.1 | 63.6 | 64.0 |
| 2042-43 | 63.1 | 63.5 | 64.0 |
| 2043-44 | 63.0 | 63.4 | 63.9 |
| 2044-45 | 62.9 | 63.4 | 63.9 |
| 2045-46 | 62.8 | 63.3 | 63.8 |
| 2046-47 | 62.7 | 63.2 | 63.8 |
| 2047-48 | 62.7 | 63.2 | 63.7 |
| 2048-49 | 62.6 | 63.1 | 63.6 |
| 2049-50 | 62.5 | 63.0 | 63.6 |
| 2050-51 | 62.4 | 62.9 | 63.5 |
| 2051-52 | 62.2 | 62.8 | 63.4 |
| 2052-53 | 62.1 | 62.7 | 63.3 |
| 2053-54 | 62.0 | 62.5 | 63.1 |
| 2054-55 | 61.8 | 62.4 | 63.0 |
Chart 1.14 Participation rates of OECD countries 2013, people aged 15 and over
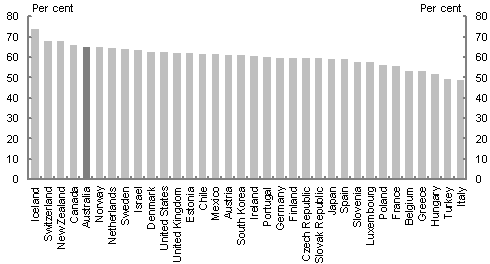
Source: World Bank.
| Participation rate (per cent) | |
|---|---|
| Iceland | 74 |
| Switzerland | 68 |
| New Zealand | 68 |
| Canada | 66 |
| Australia | 65 |
| Norway | 65 |
| Netherlands | 64 |
| Sweden | 64 |
| Israel | 63 |
| Denmark | 63 |
| United States | 63 |
| United Kingdom | 62 |
| Estonia | 62 |
| Chile | 62 |
| Mexico | 62 |
| Austria | 61 |
| South Korea | 61 |
| Ireland | 61 |
| Portugal | 60 |
| Germany | 60 |
| Finland | 60 |
| Czech Republic | 60 |
| Slovak Republic | 60 |
| Japan | 59 |
| Spain | 59 |
| Slovenia | 58 |
| Luxembourg | 58 |
| Poland | 57 |
| France | 56 |
| Belgium | 53 |
Greece   |
53 |
| Hungary | 52 |
| Turkey | 49 |
| Italy | 49 |
Chart 1.15 International comparison of participation rates, 2013
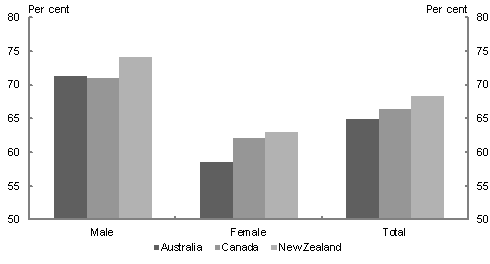
Source: International Labour Organisation.
| Male | Female | Total | |
|---|---|---|---|
| Australia | 71.4 | 58.6 | 64.9 |
| Canada | 71.1 | 62.1 | 66.5 |
| New Zealand | 74.1 | 63.0 | 68.4 |
Chart 1.16 Historical and projected average hours worked
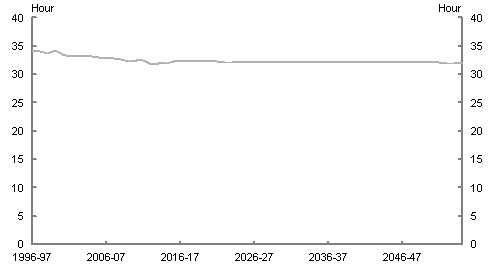
Source: ABS cat. no. 6202.0 and Treasury projections.
| Average Hours Worked | |
|---|---|
| 1996-97 | 34.14 |
| 1997-98 | 34.06 |
| 1998-99 | 33.81 |
| 1999-00 | 34.32 |
| 2000-01 | 33.62 |
| 2001-02 | 33.17 |
| 2002-03 | 33.20 |
| 2003-04 | 33.29 |
| 2004-05 | 33.18 |
| 2005-06 | 33.00 |
| 2006-07 | 32.90 |
| 2007-08 | 32.84 |
| 2008-09 | 32.72 |
| 2009-10 | 32.32 |
| 2010-11 | 32.44 |
| 2011-12 | 32.53 |
| 2012-13 | 31.88 |
| 2013-14 | 31.97 |
| 2014-15 | 32.05 |
| 2015-16 | 32.24 |
| 2016-17 | 32.27 |
| 2017-18 | 32.27 |
| 2018-19 | 32.27 |
| 2019-20 | 32.26 |
| 2020-21 | 32.25 |
| 2021-22 | 32.23 |
| 2022-23 | 32.22 |
| 2023-24 | 32.20 |
| 2024-25 | 32.19 |
| 2025-26 | 32.17 |
| 2026-27 | 32.16 |
| 2027-28 | 32.14 |
| 2028-29 | 32.14 |
| 2029-30 | 32.13 |
| 2030-31 | 32.12 |
| 2031-32 | 32.11 |
| 2032-33 | 32.10 |
| 2033-34 | 32.09 |
| 2034-35 | 32.08 |
| 2035-36 | 32.07 |
| 2036-37 | 32.06 |
| 2037-38 | 32.06 |
| 2038-39 | 32.06 |
| 2039-40 | 32.06 |
| 2040-41 | 32.06 |
| 2041-42 | 32.07 |
| 2042-43 | 32.07 |
| 2043-44 | 32.07 |
| 2044-45 | 32.07 |
| 2045-46 | 32.07 |
| 2046-47 | 32.07 |
| 2047-48 | 32.07 |
| 2048-49 | 32.06 |
| 2049-50 | 32.06 |
| 2050-51 | 32.06 |
| 2051-52 | 32.06 |
| 2052-53 | 32.05 |
| 2053-54 | 32.05 |
| 2054-55 | 32.05 |
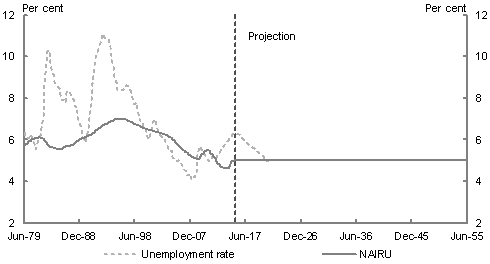
Source: ABS cat. no. 6202.0 and Treasury projections
| NAIRU | Unemployment rate | |
|---|---|---|
| Jun-79 | 5.7 | 6.3 |
| Sep-79 | 5.8 | 6.2 |
| Dec-79 | 5.8 | 6.2 |
| Mar-80 | 5.9 | 6.1 |
| Jun-80 | 5.9 | 6.2 |
| Sep-80 | 6.0 | 6.1 |
| Dec-80 | 6.0 | 6.0 |
| Mar-81 | 6.1 | 5.8 |
| Jun-81 | 6.1 | 5.5 |
| Sep-81 | 6.1 | 5.9 |
| Dec-81 | 6.1 | 6.0 |
| Mar-82 | 6.1 | 6.2 |
| Jun-82 | 6.1 | 6.6 |
| Sep-82 | 6.1 | 7.1 |
| Dec-82 | 6.0 | 8.8 |
| Mar-83 | 5.9 | 9.7 |
| Jun-83 | 5.8 | 10.2 |
| Sep-83 | 5.7 | 10.3 |
| Dec-83 | 5.7 | 9.7 |
| Mar-84 | 5.6 | 9.4 |
| Jun-84 | 5.6 | 9.2 |
| Sep-84 | 5.6 | 8.8 |
| Dec-84 | 5.6 | 8.6 |
| Mar-85 | 5.6 | 8.6 |
| Jun-85 | 5.6 | 8.5 |
| Sep-85 | 5.6 | 8.1 |
| Dec-85 | 5.6 | 7.9 |
| Mar-86 | 5.6 | 8.0 |
| Jun-86 | 5.7 | 7.8 |
| Sep-86 | 5.7 | 8.3 |
| Dec-86 | 5.7 | 8.3 |
| Mar-87 | 5.7 | 8.3 |
| Jun-87 | 5.7 | 8.2 |
| Sep-87 | 5.7 | 8.0 |
| Dec-87 | 5.8 | 7.9 |
| Mar-88 | 5.9 | 7.6 |
| Jun-88 | 5.9 | 7.6 |
| Sep-88 | 6.0 | 7.0 |
| Dec-88 | 6.0 | 6.8 |
| Mar-89 | 6.1 | 6.6 |
| Jun-89 | 6.1 | 6.2 |
| Sep-89 | 6.1 | 6.0 |
| Dec-89 | 6.1 | 5.9 |
| Mar-90 | 6.2 | 6.2 |
| Jun-90 | 6.2 | 6.5 |
| Sep-90 | 6.2 | 7.2 |
| Dec-90 | 6.3 | 7.9 |
| Mar-91 | 6.3 | 8.7 |
| Jun-91 | 6.4 | 9.6 |
| Sep-91 | 6.4 | 9.9 |
| Dec-91 | 6.5 | 10.2 |
| Mar-92 | 6.6 | 10.4 |
| Jun-92 | 6.6 | 10.7 |
| Sep-92 | 6.7 | 10.8 |
| Dec-92 | 6.7 | 11.1 |
| Mar-93 | 6.7 | 10.9 |
| Jun-93 | 6.7 | 10.9 |
| Sep-93 | 6.8 | 10.9 |
| Dec-93 | 6.8 | 10.8 |
| Mar-94 | 6.9 | 10.4 |
| Jun-94 | 6.9 | 9.9 |
| Sep-94 | 6.9 | 9.5 |
| Dec-94 | 7.0 | 9.0 |
| Mar-95 | 7.0 | 8.8 |
| Jun-95 | 7.0 | 8.4 |
| Sep-95 | 7.0 | 8.4 |
| Dec-95 | 7.0 | 8.4 |
| Mar-96 | 7.0 | 8.4 |
| Jun-96 | 7.0 | 8.4 |
| Sep-96 | 7.0 | 8.6 |
| Dec-96 | 7.0 | 8.6 |
| Mar-97 | 6.9 | 8.6 |
| Jun-97 | 6.9 | 8.5 |
| Sep-97 | 6.9 | 8.4 |
| Dec-97 | 6.8 | 8.0 |
| Mar-98 | 6.8 | 7.8 |
| Jun-98 | 6.8 | 7.7 |
| Sep-98 | 6.7 | 7.8 |
| Dec-98 | 6.7 | 7.4 |
| Mar-99 | 6.7 | 7.1 |
| Jun-99 | 6.6 | 6.9 |
| Sep-99 | 6.6 | 6.9 |
| Dec-99 | 6.6 | 6.6 |
| Mar-00 | 6.5 | 6.7 |
| Jun-00 | 6.5 | 6.3 |
| Sep-00 | 6.5 | 6.0 |
| Dec-00 | 6.5 | 6.2 |
| Mar-01 | 6.4 | 6.4 |
| Jun-01 | 6.4 | 6.8 |
| Sep-01 | 6.4 | 6.9 |
| Dec-01 | 6.4 | 7.0 |
| Mar-02 | 6.4 | 6.6 |
| Jun-02 | 6.4 | 6.4 |
| Sep-02 | 6.3 | 6.3 |
| Dec-02 | 6.3 | 6.1 |
| Mar-03 | 6.1 | |
| Jun-03 | 6.3 | 6.0 |
| Sep-03 | 6.2 | 5.9 |
| Dec-03 | 6.2 | 5.7 |
| Mar-04 | 6.2 | 5.5 |
| Jun-04 | 6.1 | 5.4 |
| Sep-04 | 6.1 | 5.5 |
| Dec-04 | 6.0 | 5.1 |
| Mar-05 | 6.0 | 5.1 |
| Jun-05 | 5.9 | 5.0 |
| Sep-05 | 5.8 | 5.0 |
| Dec-05 | 5.7 | 5.0 |
| Mar-06 | 5.6 | 5.0 |
| Jun-06 | 5.6 | 4.8 |
| Sep-06 | 5.5 | 4.7 |
| Dec-06 | 5.5 | 4.5 |
| Mar-07 | 5.4 | 4.5 |
| Jun-07 | 5.4 | 4.3 |
| Sep-07 | 5.3 | 4.3 |
| Dec-07 | 5.3 | 4.4 |
| Mar-08 | 5.2 | 4.1 |
| Jun-08 | 5.1 | 4.2 |
| Sep-08 | 5.1 | 4.2 |
| Dec-08 | 5.1 | 4.4 |
| Mar-09 | 5.1 | 5.3 |
| Jun-09 | 5.1 | 5.7 |
| Sep-09 | 5.2 | 5.7 |
| Dec-09 | 5.3 | 5.6 |
| Mar-10 | 5.4 | 5.3 |
| Jun-10 | 5.4 | 5.3 |
| Sep-10 | 5.5 | 5.1 |
| Dec-10 | 5.5 | 5.1 |
| Mar-11 | 5.5 | 5.0 |
| Jun-11 | 5.4 | 5.0 |
| Sep-11 | 5.3 | 5.2 |
| Dec-11 | 5.2 | 5.2 |
| Mar-12 | 5.1 | 5.1 |
| Jun-12 | 5.0 | 5.1 |
| Sep-12 | 4.9 | 5.3 |
| Dec-12 | 4.8 | 5.3 |
| Mar-13 | 4.7 | 5.5 |
| Jun-13 | 4.7 | 5.6 |
| Sep-13 | 4.7 | 5.7 |
| Dec-13 | 4.6 | 5.8 |
| Mar-14 | 4.6 | 5.9 |
| Jun-14 | 4.6 | 6.0 |
| Sep-14 | 4.7 | 6.1 |
| Dec-14 | 5.0 | 6.2 |
| Mar-15 | 5.0 | 6.3 |
| Jun-15 | 5.0 | 6.3 |
| Sep-15 | 5.0 | 6.3 |
| Dec-15 | 5.0 | 6.2 |
| Mar-16 | 5.0 | 6.3 |
| Jun-16 | 5.0 | 6.3 |
| Sep-16 | 5.0 | 6.2 |
| Dec-16 | 5.0 | 6.1 |
| Mar-17 | 5.0 | 6.0 |
| Jun-17 | 5.0 | 5.9 |
| Sep-17 | 5.0 | 5.8 |
| Dec-17 | 5.0 | 5.8 |
| Mar-18 | 5.0 | 5.7 |
| Jun-18 | 5.0 | 5.7 |
| Sep-18 | 5.0 | 5.6 |
| Dec-18 | 5.0 | 5.6 |
| Mar-19 | 5.0 | 5.5 |
| Jun-19 | 5.0 | 5.4 |
| Sep-19 | 5.0 | 5.4 |
| Dec-19 | 5.0 | 5.3 |
| Mar-20 | 5.0 | 5.3 |
| Jun-20 | 5.0 | 5.2 |
| Sep-20 | 5.0 | 5.1 |
| Dec-20 | 5.0 | 5.1 |
| Mar-21 | 5.0 | 5.0 |
| Jun-21 | 5.0 | 5.0 |
| Sep-21 | 5.0 | 5.0 |
| Dec-21 | 5.0 | 5.0 |
| Mar-22 | 5.0 | 5.0 |
| Jun-22 | 5.0 | 5.0 |
| Sep-22 | 5.0 | 5.0 |
| Dec-22 | 5.0 | 5.0 |
| Mar-23 | 5.0 | 5.0 |
| Jun-23 | 5.0 | 5.0 |
| Sep-23 | 5.0 | 5.0 |
| Dec-23 | 5.0 | 5.0 |
| Mar-24 | 5.0 | 5.0 |
| Jun-24 | 5.0 | 5.0 |
| Sep-24 | 5.0 | 5.0 |
| Dec-24 | 5.0 | 5.0 |
| Mar-25 | 5.0 | 5.0 |
| Jun-25 | 5.0 | 5.0 |
| Sep-25 | 5.0 | 5.0 |
| Dec-25 | 5.0 | 5.0 |
| Mar-26 | 5.0 | 5.0 |
| Jun-26 | 5.0 | 5.0 |
| Sep-26 | 5.0 | 5.0 |
| Dec-26 | 5.0 | 5.0 |
| Mar-27 | 5.0 | 5.0 |
| Jun-27 | 5.0 | 5.0 |
| Sep-27 | 5.0 | 5.0 |
| Dec-27 | 5.0 | 5.0 |
| Mar-28 | 5.0 | 5.0 |
| Jun-28 | 5.0 | 5.0 |
| Sep-28 | 5.0 | 5.0 |
| Dec-28 | 5.0 | 5.0 |
| Mar-29 | 5.0 | 5.0 |
| Jun-29 | 5.0 | 5.0 |
| Sep-29 | 5.0 | 5.0 |
| Dec-29 | 5.0 | 5.0 |
| Mar-30 | 5.0 | 5.0 |
| Jun-30 | 5.0 | 5.0 |
| Sep-30 | 5.0 | 5.0 |
| Dec-30 | 5.0 | 5.0 |
| Mar-31 | 5.0 | 5.0 |
| Jun-31 | 5.0 | 5.0 |
| Sep-31 | 5.0 | 5.0 |
| Dec-31 | 5.0 | 5.0 |
| Mar-32 | 5.0 | 5.0 |
| Jun-32 | 5.0 | 5.0 |
| Sep-32 | 5.0 | 5.0 |
| Dec-32 | 5.0 | 5.0 |
| Mar-33 | 5.0 | 5.0 |
| Jun-33 | 5.0 | 5.0 |
| Sep-33 | 5.0 | 5.0 |
| Dec-33 | 5.0 | 5.0 |
| Mar-34 | 5.0 | 5.0 |
| Jun-34 | 5.0 | 5.0 |
| Sep-34 | 5.0 | 5.0 |
| Dec-34 | 5.0 | 5.0 |
| Mar-35 | 5.0 | 5.0 |
| Jun-35 | 5.0 | 5.0 |
| Sep-35 | 5.0 | 5.0 |
| Dec-35 | 5.0 | 5.0 |
| Mar-36 | 5.0 | 5.0 |
| Jun-36 | 5.0 | 5.0 |
| Sep-36 | 5.0 | 5.0 |
| Dec-36 | 5.0 | 5.0 |
| Mar-37 | 5.0 | 5.0 |
| Jun-37 | 5.0 | 5.0 |
| Sep-37 | 5.0 | 5.0 |
| Dec-37 | 5.0 | 5.0 |
| Mar-38 | 5.0 | 5.0 |
| Jun-38 | 5.0 | 5.0 |
| Sep-38 | 5.0 | 5.0 |
| Dec-38 | 5.0 | 5.0 |
| Mar-39 | 5.0 | 5.0 |
| Jun-39 | 5.0 | 5.0 |
| Sep-39 | 5.0 | 5.0 |
| Dec-39 | 5.0 | 5.0 |
| Mar-40 | 5.0 | 5.0 |
| Jun-40 | 5.0 | 5.0 |
| Sep-40 | 5.0 | 5.0 |
| Dec-40 | 5.0 | 5.0 |
| Mar-41 | 5.0 | 5.0 |
| Jun-41 | 5.0 | 5.0 |
| Sep-41 | 5.0 | 5.0 |
| Dec-41 | 5.0 | 5.0 |
| Mar-42 | 5.0 | 5.0 |
| Jun-42 | 5.0 | 5.0 |
| Sep-42 | 5.0 | 5.0 |
| Dec-42 | 5.0 | 5.0 |
| Mar-43 | 5.0 | 5.0 |
| Jun-43 | 5.0 | 5.0 |
| Sep-43 | 5.0 | 5.0 |
| Dec-43 | 5.0 | 5.0 |
| Mar-44 | 5.0 | 5.0 |
| Jun-44 | 5.0 | 5.0 |
| Sep-44 | 5.0 | 5.0 |
| Dec-44 | 5.0 | 5.0 |
| Mar-45 | 5.0 | 5.0 |
| Jun-45 | 5.0 | 5.0 |
| Sep-45 | 5.0 | 5.0 |
| Dec-45 | 5.0 | 5.0 |
| Mar-46 | 5.0 | 5.0 |
| Jun-46 | 5.0 | 5.0 |
| Sep-46 | 5.0 | 5.0 |
| Dec-46 | 5.0 | 5.0 |
| Mar-47 | 5.0 | 5.0 |
| Jun-47 | 5.0 | 5.0 |
| Sep-47 | 5.0 | 5.0 |
| Dec-47 | 5.0 | 5.0 |
| Mar-48 | 5.0 | 5.0 |
| Jun-48 | 5.0 | 5.0 |
| Sep-48 | 5.0 | 5.0 |
| Dec-48 | 5.0 | 5.0 |
| Mar-49 | 5.0 | 5.0 |
| Jun-49 | 5.0 | 5.0 |
| Sep-49 | 5.0 | 5.0 |
| Dec-49 | 5.0 | 5.0 |
| Mar-50 | 5.0 | 5.0 |
| Jun-50 | 5.0 | 5.0 |
| Sep-50 | 5.0 | 5.0 |
| Dec-50 | 5.0 | 5.0 |
| Mar-51 | 5.0 | 5.0 |
| Jun-51 | 5.0 | 5.0 |
| Sep-51 | 5.0 | 5.0 |
| Dec-51 | 5.0 | 5.0 |
| Mar-52 | 5.0 | 5.0 |
| Jun-52 | 5.0 | 5.0 |
| Sep-52 | 5.0 | 5.0 |
| Dec-52 | 5.0 | 5.0 |
| Mar-53 | 5.0 | 5.0 |
| Jun-53 | 5.0 | 5.0 |
| Sep-53 | 5.0 | 5.0 |
| Dec-53 | 5.0 | 5.0 |
| Mar-54 | 5.0 | 5.0 |
| Jun-54 | 5.0 | 5.0 |
| Sep-54 | 5.0 | 5.0 |
| Dec-54 | 5.0 | 5.0 |
| Mar-55 | 5.0 | 5.0 |
| Jun-55 | 5.0 | 5.0 |
Chart 1.18 Labour productivity growth
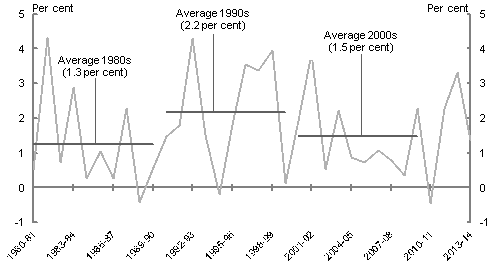
Source: ABS cat. no. 5206.0.
| Productivity growth | 1980s average | 1990s average | 2000s average | |
|---|---|---|---|---|
| 1980-81 | 0.5 | 1.3 | ||
| 1981-82 | 4.3 | 1.3 | ||
| 1982-83 | 0.7 | 1.3 | ||
| 1983-84 | 2.9 | 1.3 | ||
| 1984-85 | 0.3 | 1.3 | ||
| 1985-86 | 1.1 | 1.3 | ||
| 1986-87 | 0.3 | 1.3 | ||
| 1987-88 | 2.3 | 1.3 | ||
| 1988-89 | -0.4 | 1.3 | ||
| 1989-90 | 0.6 | 1.3 | ||
| 1990-91 | 1.5 | 2.2 | ||
| 1991-92 | 1.8 | 2.2 | ||
| 1992-93 | 4.3 | 2.2 | ||
| 1993-94 | 1.5 | 2.2 | ||
| 1994-95 | -0.2 | 2.2 | ||
| 1995-96 | 1.8 | 2.2 | ||
| 1996-97 | 3.5 | 2.2 | ||
| 1997-98 | 3.4 | 2.2 | ||
| 1998-99 | 4.0 | 2.2 | ||
| 1999-00 | 0.1 | 2.2 | ||
| 2000-01 | 1.9 | 1.5 | ||
| 2001-02 | 3.9 | 1.5 | ||
| 2002-03 | 0.5 | 1.5 | ||
| 2003-04 | 2.2 | 1.5 | ||
| 2004-05 | 0.9 | 1.5 | ||
| 2005-06 | 0.7 | 1.5 | ||
| 2006-07 | 1.1 | 1.5 | ||
| 2007-08 | 0.8 | 1.5 | ||
| 2008-09 | 0.4 | 1.5 | ||
| 2009-10 | 2.3 | 1.5 | ||
| 2010-11 | -0.5 | |||
| 2011-12 | 2.3 | |||
| 2012-13 | 3.3 | |||
| 2013-14 | 1.4 |
Chart 1.19 Average annual growth of real GDP and real GDP per person
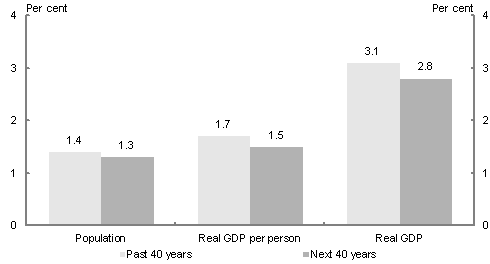
Source: ABS cat. no. 5206.0 and Treasury projections.
| Average annual growth rates | Population | Real GDP per person | Real GDP |
|---|---|---|---|
| Past 40 years | 1.4 | 1.7 | 3.1 |
| Next 40 years | 1.3 | 1.5 | 2.8 |
Chart 1.20 Population, productivity and participation combine to produce GDP per person
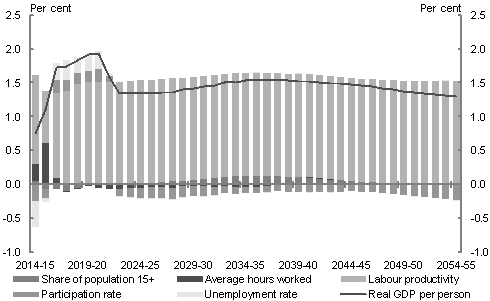
Source: ABS cat. no. 5206.0, 3105.0.65.001, 6202.0 and Treasury projections.
| Financial Year | Share of population 15+ | Participation rate | Unemployment rate | Average hours worked | Labour productivity | Real GDP per person |
|---|---|---|---|---|---|---|
| 2014-15 | 0.1 | -0.2 | -0.4 | 0.2 | 1.3 | 0.8 |
| 2015-16 | -0.1 | -0.1 | -0.1 | 0.6 | 0.8 | 1.1 |
| 2016-17 | -0.1 | 0.2 | 0.3 | 0.1 | 1.3 | 1.8 |
| 2017-18 | -0.1 | 0.2 | 0.3 | 0 | 1.4 | 1.8 |
| 2018-19 | 0 | 0.2 | 0.2 | 0 | 1.5 | 1.9 |
| 2019-20 | 0 | 0.2 | 0.3 | 0 | 1.5 | 2 |
| 2020-21 | 0 | 0.2 | 0.3 | 0 | 1.5 | 2 |
| 2021-22 | 0 | 0.1 | 0 | -0.1 | 1.5 | 1.6 |
| 2022-23 | 0 | -0.1 | 0 | -0.1 | 1.5 | 1.3 |
| 2023-24 | 0 | -0.1 | 0 | 0 | 1.5 | 1.3 |
| 2024-25 | 0 | -0.1 | 0 | 0 | 1.5 | 1.3 |
| 2025-26 | 0 | -0.2 | 0 | 0 | 1.5 | 1.2 |
| 2026-27 | 0 | -0.2 | 0 | 0 | 1.5 | 1.4 |
| 2027-28 | 0 | -0.2 | 0 | 0 | 1.5 | 1.4 |
| 2028-29 | 0.1 | -0.2 | 0 | 0 | 1.5 | 1.4 |
| 2029-30 | 0.1 | -0.1 | 0 | 0 | 1.5 | 1.4 |
| 2030-31 | 0.1 | -0.1 | 0 | 0 | 1.5 | 1.4 |
| 2031-32 | 0.1 | -0.1 | 0 | 0 | 1.5 | 1.5 |
| 2032-33 | 0.1 | -0.1 | 0 | 0 | 1.5 | 1.5 |
| 2033-34 | 0.1 | -0.1 | 0 | 0 | 1.5 | 1.5 |
| 2034-35 | 0.1 | -0.1 | 0 | 0 | 1.5 | 1.5 |
| 2035-36 | 0.1 | -0.1 | 0 | 0 | 1.5 | 1.5 |
| 2036-37 | 0.1 | -0.1 | 0 | 0 | 1.5 | 1.5 |
| 2037-38 | 0.1 | -0.1 | 0 | 0 | 1.5 | 1.5 |
| 2038-39 | 0.1 | -0.1 | 0 | 0 | 1.5 | 1.5 |
| 2039-40 | 0.1 | -0.1 | 0 | 0 | 1.5 | 1.5 |
| 2040-41 | 0.1 | -0.1 | 0 | 0 | 1.5 | 1.5 |
| 2041-42 | 0.1 | -0.1 | 0 | 0 | 1.5 | 1.5 |
| 2042-43 | 0.1 | -0.1 | 0 | 0 | 1.5 | 1.5 |
| 2043-44 | 0.1 | -0.1 | 0 | 0 | 1.5 | 1.5 |
| 2044-45 | 0.1 | -0.1 | 0 | 0 | 1.5 | 1.5 |
| 2045-46 | 0 | -0.1 | 0 | 0 | 1.5 | 1.5 |
| 2046-47 | 0 | -0.1 | 0 | 0 | 1.5 | 1.4 |
| 2047-48 | 0 | -0.1 | 0 | 0 | 1.5 | 1.4 |
| 2048-49 | 0 | -0.1 | 0 | 0 | 1.5 | 1.4 |
| 2049-50 | 0 | -0.1 | 0 | 1.5 | 1.4 | |
| 2050-51 | 0 | -0.2 | 0 | 0 | 1.5 | 1.4 |
| 2051-52 | 0 | -0.2 | 0 | 0 | 1.5 | 1.3 |
| 2052-53 | 0 | -0.2 | 0 | 0 | 1.5 | 1.3 |
| 2053-54 | 0 | -0.2 | 0 | 0 | 1.5 | 1.3 |
| 2054-55 | 0 | -0.2 | 0 | 0 | 1.5 | 1.3 |
Chart 1.21 Components of growth in real GDP per person
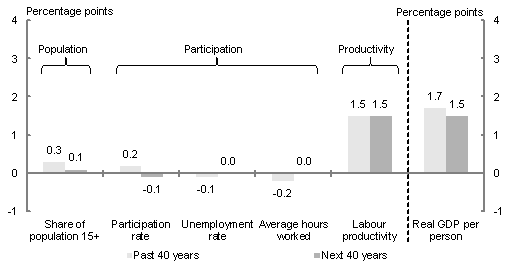
Source: ABS cat. no. 5206.0, 6202.0 and Treasury projections.
| Percentage points contribution, annual average | Share of population 15+ | Participation rate | Unemployment rate | Average hours worked | Labour productivity | Real GDP per person |
|---|---|---|---|---|---|---|
| Past 40 years | 0.3 | 0.2 | -0.1 | -0.2 | 1.5 | 1.7 |
| Next 40 years | 0.1 | -0.1 | 0 | 0 | 1.5 | 1.5 |
Chart 1.22 Nominal GDP growth projections
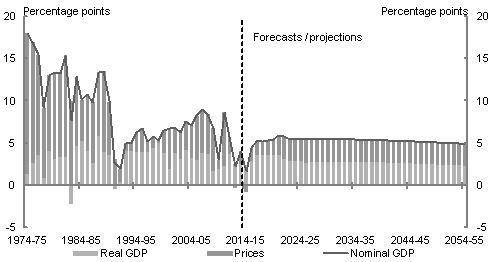
Source: ABS cat. no. 5206 and Treasury projections.
| Per cent | Real GDP | Prices | Nominal GDP |
|---|---|---|---|
| 1974-75 | 1.3 | 16.7 | 18.0 |
| 1975-76 | 2.6 | 14.4 | 17.0 |
| 1976-77 | 3.6 | 11.8 | 15.4 |
| 1977-78 | 0.9 | 8.3 | 9.2 |
| 1978-79 | 4.1 | 9.0 | 13.0 |
| 1979-80 | 3.1 | 10.3 | 13.4 |
| 1980-81 | 3.4 | 9.8 | 13.2 |
| 1981-82 | 3.3 | 12.1 | 15.4 |
| 1982-83 | -2.2 | 9.9 | 7.7 |
| 1983-84 | 4.6 | 8.2 | 12.9 |
| 1984-85 | 5.3 | 4.9 | 10.1 |
| 1985-86 | 4.1 | 6.7 | 10.8 |
| 1986-87 | 2.6 | 7.2 | 9.8 |
| 1987-88 | 5.8 | 7.6 | 13.4 |
| 1988-89 | 3.9 | 9.6 | 13.5 |
| 1989-90 | 3.5 | 6.3 | 9.9 |
| 1990-91 | -0.4 | 3.1 | 2.7 |
| 1991-92 | 0.4 | 1.6 | 2.0 |
| 1992-93 | 4.0 | 1.0 | 5.0 |
| 1993-94 | 4.0 | 1.1 | 5.1 |
| 1994-95 | 3.9 | 2.3 | 6.2 |
| 1995-96 | 4.0 | 2.8 | 6.7 |
| 1996-97 | 3.9 | 1.3 | 5.2 |
| 1997-98 | 4.4 | 1.3 | 5.8 |
| 1998-99 | 5.0 | 0.4 | 5.4 |
| 1999-00 | 3.9 | 2.7 | 6.5 |
| 2000-01 | 1.9 | 4.8 | 6.7 |
| 2001-02 | 3.9 | 3.0 | 6.8 |
| 2002-03 | 3.1 | 3.2 | 6.3 |
| 2003-04 | 4.2 | 3.4 | 7.6 |
| 2004-05 | 3.2 | 3.8 | 7.1 |
| 2005-06 | 3.0 | 5.2 | 8.2 |
| 2006-07 | 3.8 | 5.2 | 8.9 |
| 2007-08 | 3.7 | 4.7 | 8.4 |
| 2008-09 | 1.7 | 5.0 | 6.8 |
| 2009-10 | 2.0 | 1.0 | 3.0 |
| 2010-11 | 2.3 | 6.3 | 8.7 |
| 2011-12 | 3.7 | 2.0 | 5.7 |
| 2012-13 | 2.5 | -0.3 | 2.2 |
| 2013-14 | 2.5 | 1.6 | 4.0 |
| 2014-15 | 2.4 | -0.8 | 1.6 |
| 2015-16 | 2.9 | 1.6 | 4.5 |
| 2016-17 | 3.6 | 1.6 | 5.1 |
| 2017-18 | 3.6 | 1.7 | 5.2 |
| 2018-19 | 3.6 | 1.8 | 5.4 |
| 2019-20 | 3.6 | 1.9 | 5.5 |
| 2020-21 | 3.6 | 2.3 | 5.9 |
| 2021-22 | 3.1 | 2.6 | 5.7 |
| 2022-23 | 2.9 | 2.6 | 5.5 |
| 2023-24 | 2.8 | 2.6 | 5.4 |
| 2024-25 | 2.8 | 2.6 | 5.4 |
| 2025-26 | 2.7 | 2.7 | 5.4 |
| 2026-27 | 2.8 | 2.6 | 5.4 |
| 2027-28 | 2.8 | 2.6 | 5.4 |
| 2028-29 | 2.8 | 2.6 | 5.4 |
| 2029-30 | 2.8 | 2.6 | 5.4 |
| 2030-31 | 2.8 | 2.6 | 5.4 |
| 2031-32 | 2.8 | 2.6 | 5.4 |
| 2032-33 | 2.8 | 2.6 | 5.4 |
| 2033-34 | 2.8 | 2.6 | 5.4 |
| 2034-35 | 2.8 | 2.6 | 5.4 |
| 2035-36 | 2.8 | 2.6 | 5.4 |
| 2036-37 | 2.8 | 2.6 | 5.3 |
| 2037-38 | 2.8 | 2.6 | 5.3 |
| 2038-39 | 2.7 | 2.6 | 5.3 |
| 2039-40 | 2.7 | 2.6 | 5.3 |
| 2040-41 | 2.7 | 2.6 | 5.3 |
| 2041-42 | 2.7 | 2.6 | 5.2 |
| 2042-43 | 2.6 | 2.6 | 5.2 |
| 2043-44 | 2.6 | 2.6 | 5.2 |
| 2044-45 | 2.6 | 2.6 | 5.2 |
| 2045-46 | 2.6 | 2.6 | 5.1 |
| 2046-47 | 2.5 | 2.6 | 5.1 |
| 2047-48 | 2.5 | 2.6 | 5.1 |
| 2048-49 | 2.5 | 2.6 | 5.0 |
| 2049-50 | 2.4 | 2.6 | 5.0 |
| 2050-51 | 2.4 | 2.6 | 5.0 |
| 2051-52 | 2.4 | 2.6 | 5.0 |
| 2052-53 | 2.4 | 2.6 | 4.9 |
| 2053-54 | 2.3 | 2.6 | 4.9 |
| 2054-55 | 2.3 | 2.6 | 4.9 |
Chart 1.23 Average annual growth rates for real GDP and GNI projections
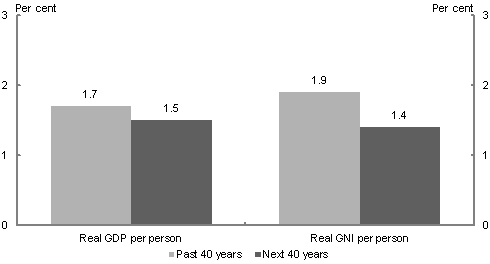
Source: ABS cat no. 5206 and Treasury projections.
| Real GDP per person | Real GNI per person | |
|---|---|---|
| Past 40 years | 1.7 | 1.9 |
| Next 40 years | 1.5 | 1.4 |
Chart 1.24 Sources of growth in real national income per person
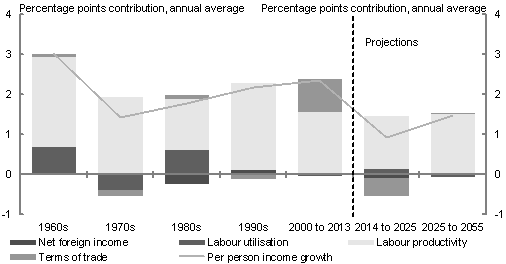
Source: ABS cat. no. 5206.0 and Treasury projections.
| Percentage point contribution, annual average | Per capita income growth | Labour utilisation | Net foreign income | Terms of trade | Labour productivity | Terms of trade |
|---|---|---|---|---|---|---|
| 1960s | 3.0 | 0.6 | 0.0 | 0.0 | 2.2 | 0.0 |
| 1970s | 1.4 | -0.3 | 0.0 | -0.1 | 1.9 | -0.1 |
| 1980s | 1.7 | 0.6 | -0.2 | 0.1 | 1.2 | 0.1 |
| 1990s | 2.1 | 0.0 | 0.1 | -0.1 | 2.1 | -0.1 |
| 2000 to 2013 | 2.3 | 0.0 | 0.0 | 0.8 | 1.5 | 0.8 |
| 2014 to 2025 | 0.9 | 0.1 | 0.0 | -0.4 | 1.3 | -0.4 |
| 2025 to 2055 | 1.4 | 0.0 | 0.0 | 0.0 | 1.5 | 0.0 |
Chart 1.25 Underlying cash balance and output gap
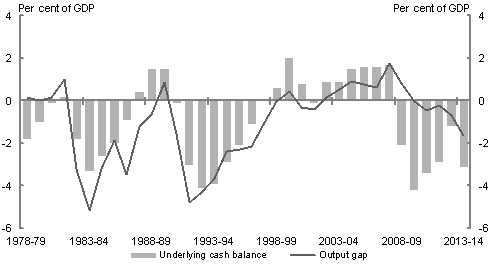
Source: ABS Cat. No. 5206.0 and Treasury
| UCB (% GDP) | Output gap | |
|---|---|---|
| 1978-79 | -1.8 | 0.2 |
| 1979-80 | -1.0 | 0.0 |
| 1980-81 | -0.1 | 0.2 |
| 1981-82 | 0.2 | 1.0 |
| 1982-83 | -1.8 | -3.2 |
| 1983-84 | -3.3 | -5.2 |
| 1984-85 | -2.6 | -3.2 |
| 1985-86 | -2.0 | -1.8 |
| 1986-87 | -0.9 | -3.5 |
| 1987-88 | 0.4 | -1.2 |
| 1988-89 | 1.5 | -0.7 |
| 1989-90 | 1.5 | 0.9 |
| 1990-91 | -0.1 | -1.6 |
| 1991-92 | -3.0 | -4.8 |
| 1992-93 | -4.1 | -4.3 |
| 1993-94 | -3.9 | -3.6 |
| 1994-95 | -2.9 | -2.4 |
| 1995-96 | -2.1 | -2.3 |
| 1996-97 | -1.1 | -2.2 |
| 1997-98 | 0.0 | -1.0 |
| 1998-99 | 0.6 | 0.0 |
| 1999-00 | 2.0 | 0.4 |
| 2000-01 | 0.8 | -0.3 |
| 2001-02 | -0.1 | -0.4 |
| 2002-03 | 0.9 | 0.2 |
| 2003-04 | 0.9 | 0.5 |
| 2004-05 | 1.5 | 0.9 |
| 2005-06 | 1.6 | 0.8 |
| 2006-07 | 1.6 | 0.6 |
| 2007-08 | 1.7 | 1.7 |
| 2008-09 | -2.1 | 0.8 |
| 2009-10 | -4.2 | -0.1 |
| 2010-11 | -3.4 | -0.4 |
| 2011-12 | -2.9 | -0.2 |
| 2012-13 | -1.2 | -0.7 |
| 2013-14 | -3.1 | -1.6 |