Chart C.1 Terms of trade projections
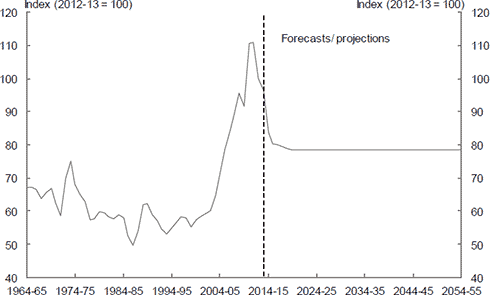
Source: ABS cat. no. 5206.0 and Treasury projections.
| Financial Year | 2015 IGR |
|---|---|
| 1964-65 | 67.0 |
| 1965-66 | 67.0 |
| 1966-67 | 66.6 |
| 1967-68 | 63.9 |
| 1968-69 | 65.5 |
| 1969-70 | 66.8 |
| 1970-71 | 62.6 |
| 1971-72 | 58.6 |
| 1972-73 | 69.8 |
| 1973-74 | 75.0 |
| 1974-75 | 68.2 |
| 1975-76 | 65.1 |
| 1976-77 | 63.0 |
| 1977-78 | 57.3 |
| 1978-79 | 57.7 |
| 1979-80 | 59.9 |
| 1980-81 | 59.4 |
| 1981-82 | 58.4 |
| 1982-83 | 57.6 |
| 1983-84 | 59.0 |
| 1984-85 | 58.0 |
| 1985-86 | 52.5 |
| 1986-87 | 49.7 |
| 1987-88 | 54.0 |
| 1988-89 | 62.0 |
| 1989-90 | 62.2 |
| 1990-91 | 58.9 |
| 1991-92 | 57.1 |
| 1992-93 | 54.7 |
| 1993-94 | 53.2 |
| 1994-95 | 54.9 |
| 1995-96 | 56.7 |
| 1996-97 | 58.3 |
| 1997-98 | 58.0 |
| 1998-99 | 55.2 |
| 1999-00 | 57.4 |
| 2000-01 | 58.4 |
| 2001-02 | 59.3 |
| 2002-03 | 60.1 |
| 2003-04 | 64.6 |
| 2004-05 | 70.8 |
| 2005-06 | 78.4 |
| 2006-07 | 84.1 |
| 2007-08 | 88.8 |
| 2008-09 | 95.6 |
| 2009-10 | 91.7 |
| 2010-11 | 110.6 |
| 2011-12 | 111.1 |
| 2012-13 | 100.0 |
| 2013-14 | 96.6 |
| 2014-15 | 83.6 |
| 2015-16 | 80.3 |
| 2016-17 | 79.9 |
| 2017-18 | 79.4 |
| 2018-19 | 78.8 |
| 2019-20 | 78.5 |
| 2020-21 | 78.5 |
| 2021-22 | 78.5 |
| 2022-23 | 78.5 |
| 2023-24 | 78.5 |
| 2024-25 | 78.5 |
| 2025-26 | 78.5 |
| 2026-27 | 78.5 |
| 2027-28 | 78.5 |
| 2028-29 | 78.5 |
| 2029-30 | 78.5 |
| 2030-31 | 78.5 |
| 2031-32 | 78.5 |
| 2032-33 | 78.5 |
| 2033-34 | 78.5 |
| 2034-35 | 78.5 |
| 2035-36 | 78.5 |
| 2036-37 | 78.5 |
| 2037-38 | 78.5 |
| 2038-39 | 78.5 |
| 2039-40 | 78.5 |
| 2040-41 | 78.5 |
| 2041-42 | 78.5 |
| 2042-43 | 78.5 |
| 2043-44 | 78.5 |
| 2044-45 | 78.5 |
| 2045-46 | 78.5 |
| 2046-47 | 78.5 |
| 2047-48 | 78.5 |
| 2048-49 | 78.5 |
| 2049-50 | 78.5 |
| 2050-51 | 78.5 |
| 2051-52 | 78.5 |
| 2052-53 | 78.5 |
| 2053-54 | 78.5 |
| 2054-55 | 78.5 |
Chart C.2 Nominal GDP projections
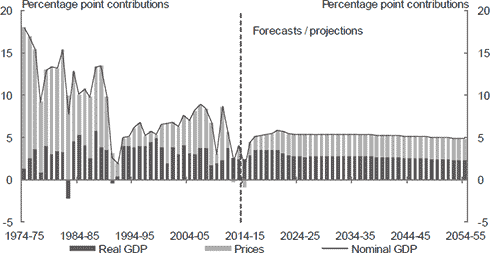
Source: Treasury projections. Projections assume trend economic growth from 2021–22 to 2054–55.
| Per cent | Real GDP | Prices | Nominal GDP |
|---|---|---|---|
| 1974-75 | 1.3 | 16.7 | 18.0 |
| 1975-76 | 2.6 | 14.4 | 17.0 |
| 1976-77 | 3.6 | 11.8 | 15.4 |
| 1977-78 | 0.9 | 8.3 | 9.2 |
| 1978-79 | 4.1 | 9.0 | 13.0 |
| 1979-80 | 3.1 | 10.3 | 13.4 |
| 1980-81 | 3.4 | 9.8 | 13.2 |
| 1981-82 | 3.3 | 12.1 | 15.4 |
| 1982-83 | -2.2 | 9.9 | 7.7 |
| 1983-84 | 4.6 | 8.2 | 12.9 |
| 1984-85 | 5.3 | 4.9 | 10.1 |
| 1985-86 | 4.1 | 6.7 | 10.8 |
| 1986-87 | 2.6 | 7.2 | 9.8 |
| 1987-88 | 5.8 | 7.6 | 13.4 |
| 1988-89 | 3.9 | 9.6 | 13.5 |
| 1989-90 | 3.5 | 6.3 | 9.9 |
| 1990-91 | -0.4 | 3.1 | 2.7 |
| 1991-92 | 0.4 | 1.6 | 2.0 |
| 1992-93 | 4.0 | 1.0 | 5.0 |
| 1993-94 | 4.0 | 1.1 | 5.1 |
| 1994-95 | 3.9 | 2.3 | 6.2 |
| 1995-96 | 4.0 | 2.8 | 6.7 |
| 1996-97 | 3.9 | 1.3 | 5.2 |
| 1997-98 | 4.4 | 1.3 | 5.8 |
| 1998-99 | 5.0 | 0.4 | 5.4 |
| 1999-00 | 3.9 | 2.7 | 6.5 |
| 2000-01 | 1.9 | 4.8 | 6.7 |
| 2001-02 | 3.9 | 3.0 | 6.8 |
| 2002-03 | 3.1 | 3.2 | 6.3 |
| 2003-04 | 4.2 | 3.4 | 7.6 |
| 2004-05 | 3.2 | 3.8 | 7.1 |
| 2005-06 | 3.0 | 5.2 | 8.2 |
| 2006-07 | 3.8 | 5.2 | 8.9 |
| 2007-08 | 3.7 | 4.7 | 8.4 |
| 2008-09 | 1.7 | 5.0 | 6.8 |
| 2009-10 | 2.0 | 1.0 | 3.0 |
| 2010-11 | 2.3 | 6.3 | 8.7 |
| 2011-12 | 3.7 | 2.0 | 5.7 |
| 2012-13 | 2.5 | -0.3 | 2.2 |
| 2013-14 | 2.5 | 1.6 | 4.0 |
| 2014-15 | 2.4 | -0.8 | 1.6 |
| 2015-16 | 2.9 | 1.6 | 4.5 |
| 2016-17 | 3.6 | 1.6 | 5.1 |
| 2017-18 | 3.6 | 1.7 | 5.2 |
| 2018-19 | 3.6 | 1.8 | 5.4 |
| 2019-20 | 3.6 | 1.9 | 5.5 |
| 2020-21 | 3.6 | 2.3 | 5.9 |
| 2021-22 | 3.1 | 2.6 | 5.7 |
| 2022-23 | 2.9 | 2.6 | 5.5 |
| 2023-24 | 2.8 | 2.6 | 5.4 |
| 2024-25 | 2.8 | 2.6 | 5.4 |
| 2025-26 | 2.7 | 2.7 | 5.4 |
| 2026-27 | 2.8 | 2.6 | 5.4 |
| 2027-28 | 2.8 | 2.6 | 5.4 |
| 2028-29 | 2.8 | 2.6 | 5.4 |
| 2029-30 | 2.8 | 2.6 | 5.4 |
| 2030-31 | 2.8 | 2.6 | 5.4 |
| 2031-32 | 2.8 | 2.6 | 5.4 |
| 2032-33 | 2.8 | 2.6 | 5.4 |
| 2033-34 | 2.8 | 2.6 | 5.4 |
| 2034-35 | 2.8 | 2.6 | 5.4 |
| 2035-36 | 2.8 | 2.6 | 5.4 |
| 2036-37 | 2.8 | 2.6 | 5.3 |
| 2037-38 | 2.8 | 2.6 | 5.3 |
| 2038-39 | 2.7 | 2.6 | 5.3 |
| 2039-40 | 2.7 | 2.6 | 5.3 |
| 2040-41 | 2.7 | 2.6 | 5.3 |
| 2041-42 | 2.7 | 2.6 | 5.2 |
| 2042-43 | 2.6 | 2.6 | 5.2 |
| 2043-44 | 2.6 | 2.6 | 5.2 |
| 2044-45 | 2.6 | 2.6 | 5.2 |
| 2045-46 | 2.6 | 2.6 | 5.1 |
| 2046-47 | 2.5 | 2.6 | 5.1 |
| 2047-48 | 2.5 | 2.6 | 5.1 |
| 2048-49 | 2.5 | 2.6 | 5.0 |
| 2049-50 | 2.4 | 2.6 | 5.0 |
| 2050-51 | 2.4 | 2.6 | 5.0 |
| 2051-52 | 2.4 | 2.6 | 5.0 |
| 2052-53 | 2.4 | 2.6 | 4.9 |
| 2053-54 | 2.3 | 2.6 | 4.9 |
| 2054-55 | 2.3 | 2.6 | 4.9 |
Chart C.4 Projected tax–to–GDP ratio
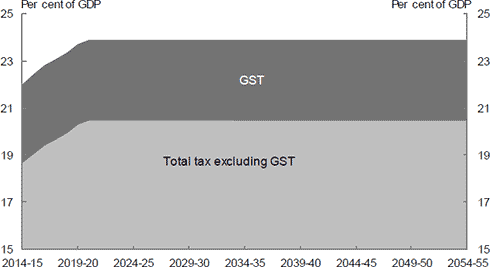
Source: Treasury projections. Projections assume trend economic growth from 2021–22 to 2054–55.
| Total tax excluding GST | GST | |
|---|---|---|
| 2014-15 | 18.7 | 3.3 |
| 2015-16 | 19.0 | 3.4 |
| 2016-17 | 19.4 | 3.4 |
| 2017-18 | 19.6 | 3.4 |
| 2018-19 | 19.9 | 3.4 |
| 2019-20 | 20.3 | 3.4 |
| 2020-21 | 20.5 | 3.4 |
| 2021-22 | 20.5 | 3.4 |
| 2022-23 | 20.5 | 3.4 |
| 2023-24 | 20.5 | 3.4 |
| 2024-25 | 20.5 | 3.4 |
| 2025-26 | 20.5 | 3.4 |
| 2026-27 | 20.5 | 3.4 |
| 2027-28 | 20.5 | 3.4 |
| 2028-29 | 20.5 | 3.4 |
| 2029-30 | 20.5 | 3.4 |
| 2030-31 | 20.5 | 3.4 |
| 2031-32 | 20.5 | 3.4 |
| 2032-33 | 20.5 | 3.4 |
| 2033-34 | 20.5 | 3.4 |
| 2034-35 | 20.5 | 3.4 |
| 2035-36 | 20.5 | 3.4 |
| 2036-37 | 20.5 | 3.4 |
| 2037-38 | 20.5 | 3.4 |
| 2038-39 | 20.5 | 3.4 |
| 2039-40 | 20.5 | 3.4 |
| 2040-41 | 20.5 | 3.4 |
| 2041-42 | 20.5 | 3.4 |
| 2042-43 | 20.5 | 3.4 |
| 2043-44 | 20.5 | 3.4 |
| 2044-45 | 20.5 | 3.4 |
| 2045-46 | 20.5 | 3.4 |
| 2046-47 | 20.5 | 3.4 |
| 2047-48 | 20.5 | 3.4 |
| 2048-49 | 20.5 | 3.4 |
| 2049-50 | 20.5 | 3.4 |
| 2050-51 | 20.5 | 3.4 |
| 2051-52 | 20.5 | 3.4 |
| 2052-53 | 20.5 | 3.4 |
| 2053-54 | 20.5 | 3.4 |
| 2054-55 | 20.5 | 3.4 |
Chart C.5 Total Australian Government taxation receipts, 1973–74 to 2013–14
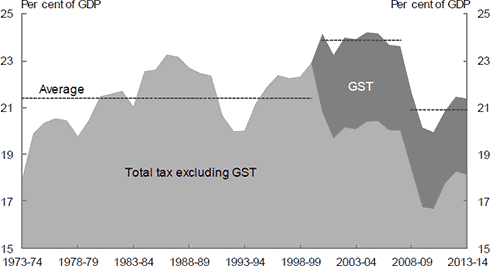
Source: Treasury.
| GST | Total tax less GST | |
|---|---|---|
| 1973-74 | 0.0 | 18.0 |
| 1974-75 | 0.0 | 19.9 |
| 1975-76 | 0.0 | 20.3 |
| 1976-77 | 0.0 | 20.5 |
| 1977-78 | 0.0 | 20.4 |
| 1978-79 | 0.0 | 19.8 |
| 1979-80 | 0.0 | 20.5 |
| 1980-81 | 0.0 | 21.5 |
| 1981-82 | 0.0 | 21.6 |
| 1982-83 | 0.0 | 21.7 |
| 1983-84 | 0.0 | 21.0 |
| 1984-85 | 0.0 | 22.5 |
| 1985-86 | 0.0 | 22.6 |
| 1986-87 | 0.0 | 23.3 |
| 1987-88 | 0.0 | 23.2 |
| 1988-89 | 0.0 | 22.7 |
| 1989-90 | 0.0 | 22.5 |
| 1990-91 | 0.0 | 22.4 |
| 1991-92 | 0.0 | 20.7 |
| 1992-93 | 0.0 | 20.0 |
| 1993-94 | 0.0 | 20.0 |
| 1994-95 | 0.0 | 21.2 |
| 1995-96 | 0.0 | 21.9 |
| 1996-97 | 0.0 | 22.4 |
| 1997-98 | 0.0 | 22.2 |
| 1998-99 | 0.0 | 22.3 |
| 1999-00 | 0.0 | 22.9 |
| 2000-01 | 3.4 | 20.8 |
| 2001-02 | 3.6 | 19.7 |
| 2002-03 | 3.8 | 20.2 |
| 2003-04 | 3.8 | 20.1 |
| 2004-05 | 3.8 | 20.4 |
| 2005-06 | 3.7 | 20.4 |
| 2006-07 | 3.6 | 20.0 |
| 2007-08 | 3.6 | 20.0 |
| 2008-09 | 3.3 | 18.4 |
| 2009-10 | 3.4 | 16.7 |
| 2010-11 | 3.3 | 16.7 |
| 2011-12 | 3.1 | 17.7 |
| 2012-13 | 3.2 | 18.3 |
| 2013-14 | 3.2 | 18.1 |
Chart C.6 Impact of policy changes on Australian Government tax receipts, 1978–79 to 2013–14 (a)
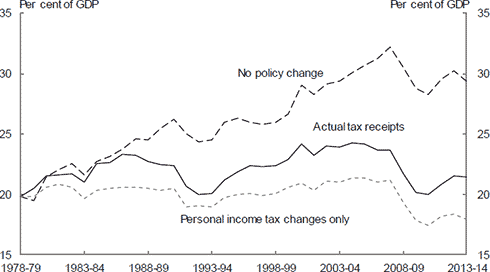
(a) Wholesale Sales Tax (WST) has been included in all three series on the basis of actual collections, as a no–policy–change series for this tax in not available.
(b) The impact of policy changes in this analysis was calculated between pairs of sequential years and then aggregated. As the analysis period increases, there is an increased level of uncertainty with the total policy impact since 1978–79.
Source: ABS cat. no. 5206.0 and Budget Paper No. 1 (various years).
| Actual tax receipts | No policy change | Personal income tax changes only | |
|---|---|---|---|
| 1978-79 | 19.8 | 19.8 | 19.8 |
| 1979-80 | 20.5 | 19.5 | 19.8 |
| 1980-81 | 21.5 | 21.4 | 20.5 |
| 1981-82 | 21.6 | 22.0 | 20.8 |
| 1982-83 | 21.7 | 22.5 | 20.6 |
| 1983-84 | 21.0 | 21.6 | 19.6 |
| 1984-85 | 22.5 | 22.7 | 20.3 |
| 1985-86 | 22.6 | 23.1 | 20.5 |
| 1986-87 | 23.3 | 23.7 | 20.6 |
| 1987-88 | 23.2 | 24.6 | 20.6 |
| 1988-89 | 22.7 | 24.5 | 20.5 |
| 1989-90 | 22.5 | 25.5 | 20.3 |
| 1990-91 | 22.4 | 26.2 | 20.5 |
| 1991-92 | 20.7 | 25.0 | 19.0 |
| 1992-93 | 20.0 | 24.4 | 19.1 |
| 1993-94 | 20.0 | 24.5 | 18.9 |
| 1994-95 | 21.2 | 26.0 | 19.7 |
| 1995-96 | 21.9 | 26.3 | 19.9 |
| 1996-97 | 22.4 | 26.0 | 20.0 |
| 1997-98 | 22.2 | 25.8 | 19.9 |
| 1998-99 | 22.3 | 25.9 | 20.0 |
| 1999-00 | 22.9 | 26.6 | 20.6 |
| 2000-01 | 24.2 | 29.0 | 20.9 |
| 2001-02 | 23.2 | 28.2 | 20.3 |
| 2002-03 | 24.0 | 29.1 | 21.0 |
| 2003-04 | 23.9 | 29.4 | 21.0 |
| 2004-05 | 24.2 | 30.1 | 21.3 |
| 2005-06 | 24.2 | 30.7 | 21.3 |
| 2006-07 | 23.7 | 31.2 | 21.0 |
| 2007-08 | 23.6 | 32.2 | 21.1 |
| 2008-09 | 21.7 | 30.5 | 19.2 |
| 2009-10 | 20.1 | 28.8 | 17.9 |
| 2010-11 | 19.9 | 28.3 | 17.4 |
| 2011-12 | 20.8 | 29.6 | 18.1 |
| 2012-13 | 21.5 | 30.2 | 18.3 |
| 2013-14 | 21.4 | 29.4 | 17.9 |
Chart C.7 Historical real growth in Australian Government health spending by component, 1984–85 to 2012–13
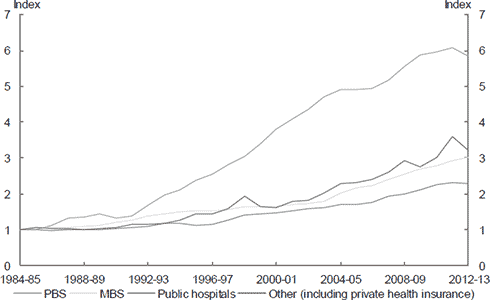
Note: Spend in 1984-85 =1. Other health expenditure includes expenditure on the private health insurance rebate as the rebate commenced in July 1997 and therefore no index can be calculated independently over this time frame.
Source: Department of Health, Australian Institute of Health and Welfare and the Commonwealth Government Budget papers.
| PBS | MBS | Public hospitals | Other (including private health insurance) | |
|---|---|---|---|---|
| 1984-85 | 1.0 | 1.0 | 1.0 | 1.0 |
| 1985-86 | 1.1 | 1.0 | 1.0 | 1.0 |
| 1986-87 | 1.1 | 1.1 | 1.0 | 1.0 |
| 1987-88 | 1.1 | 1.3 | 1.0 | 1.0 |
| 1988-89 | 1.1 | 1.3 | 1.0 | 1.0 |
| 1989-90 | 1.1 | 1.4 | 1.0 | 1.0 |
| 1990-91 | 1.2 | 1.3 | 1.0 | 1.1 |
| 1991-92 | 1.3 | 1.4 | 1.1 | 1.2 |
| 1992-93 | 1.4 | 1.7 | 1.1 | 1.1 |
| 1993-94 | 1.4 | 2.0 | 1.2 | 1.2 |
| 1994-95 | 1.5 | 2.1 | 1.2 | 1.3 |
| 1995-96 | 1.5 | 2.4 | 1.1 | 1.4 |
| 1996-97 | 1.5 | 2.6 | 1.1 | 1.5 |
| 1997-98 | 1.6 | 2.8 | 1.3 | 1.6 |
| 1998-99 | 1.6 | 3.1 | 1.4 | 1.9 |
| 1999-00 | 1.7 | 3.4 | 1.4 | 1.6 |
| 2000-01 | 1.6 | 3.8 | 1.5 | 1.6 |
| 2001-02 | 1.7 | 4.1 | 1.5 | 1.8 |
| 2002-03 | 1.7 | 4.4 | 1.6 | 1.8 |
| 2003-04 | 1.8 | 4.7 | 1.6 | 2.0 |
| 2004-05 | 2.0 | 4.9 | 1.7 | 2.3 |
| 2005-06 | 2.2 | 4.9 | 1.7 | 2.3 |
| 2006-07 | 2.2 | 4.9 | 1.8 | 2.4 |
| 2007-08 | 2.4 | 5.2 | 1.9 | 2.6 |
| 2008-09 | 2.6 | 5.6 | 2.0 | 2.9 |
| 2009-10 | 2.7 | 5.9 | 2.1 | 2.7 |
| 2010-11 | 2.8 | 6.0 | 2.3 | 3.0 |
| 2011-12 | 2.9 | 6.1 | 2.3 | 3.6 |
| 2012-13 | 3.0 | 5.9 | 2.3 | 3.2 |
Chart C.8 Australian Government health spending - income adjustment
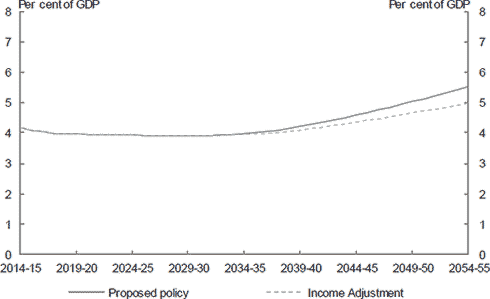
Source: Treasury projections. Projections assume trend economic growth from 2021–22 to 2054–55.
| No Income Adjustment | Income Adjustment | |
|---|---|---|
| 2014-15 | 4.2 | 4.2 |
| 2015-16 | 4.1 | 4.1 |
| 2016-17 | 4.0 | 4.0 |
| 2017-18 | 4.0 | 4.0 |
| 2018-19 | 4.0 | 4.0 |
| 2019-20 | 4.0 | 4.0 |
| 2020-21 | 4.0 | 4.0 |
| 2021-22 | 3.9 | 3.9 |
| 2022-23 | 3.9 | 3.9 |
| 2023-24 | 3.9 | 3.9 |
| 2024-25 | 3.9 | 3.9 |
| 2025-26 | 3.9 | 3.9 |
| 2026-27 | 3.9 | 3.9 |
| 2027-28 | 3.9 | 3.9 |
| 2028-29 | 3.9 | 3.9 |
| 2029-30 | 3.9 | 3.9 |
| 2030-31 | 3.9 | 3.9 |
| 2031-32 | 3.9 | 3.9 |
| 2032-33 | 3.9 | 3.9 |
| 2033-34 | 3.9 | 3.9 |
| 2034-35 | 4.0 | 3.9 |
| 2035-36 | 4.0 | 4.0 |
| 2036-37 | 4.0 | 4.0 |
| 2037-38 | 4.1 | 4.0 |
| 2038-39 | 4.2 | 4.1 |
| 2039-40 | 4.2 | 4.1 |
| 2040-41 | 4.3 | 4.1 |
| 2041-42 | 4.4 | 4.2 |
| 2042-43 | 4.4 | 4.2 |
| 2043-44 | 4.5 | 4.3 |
| 2044-45 | 4.6 | 4.4 |
| 2045-46 | 4.7 | 4.4 |
| 2046-47 | 4.8 | 4.5 |
| 2047-48 | 4.8 | 4.5 |
| 2048-49 | 4.9 | 4.6 |
| 2049-50 | 5.0 | 4.7 |
| 2050-51 | 5.1 | 4.7 |
| 2051-52 | 5.2 | 4.8 |
| 2052-53 | 5.3 | 4.8 |
| 2053-54 | 5.4 | 4.9 |
| 2054-55 | 5.5 | 5.0 |