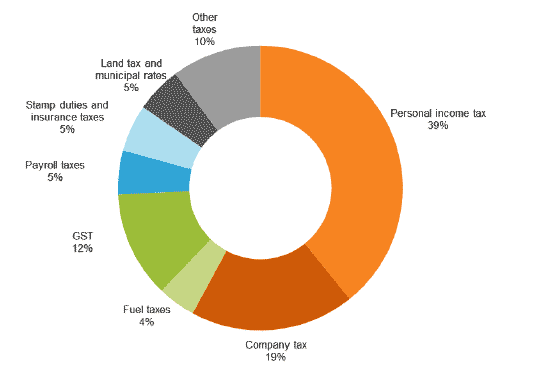
Chart 1 – Composition of Australian taxes

Note: Percentages may not sum to 100 per cent due to rounding.
Source: ABS, Taxation Revenue, 2012-13
This chart shows the composition of Australian taxes at all levels of government in 2012-13.
| Tax | 2012-13 $m | Per cent |
|---|---|---|
| Personal income tax | 162,993 | 39 |
| Company tax | 77,691 | 19 |
| Fuel taxes | 17,839 | 4.3 |
| GST | 50,313 | 12 |
| Payroll taxes | 20,752 | 5 |
| Stamp duties and insurance taxes | 22,189 | 5 |
| Land tax and municipal rates | 21,744 | 5 |
| Other taxes | 42,252 | 10 |
| Total | 415,775 |
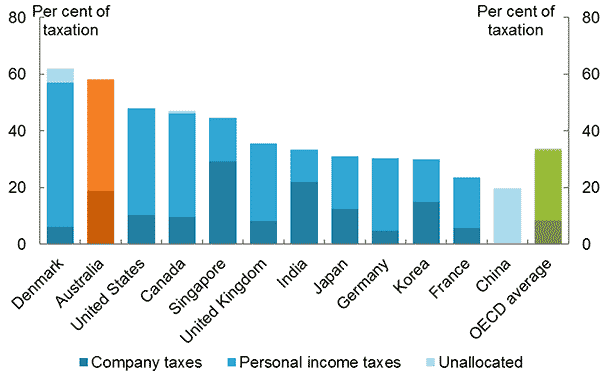
Chart 2 – Income taxes as a percentage of total taxation, selected economies, 2012

Note: Income taxes do not include payroll tax or social security contributions. Statistics for non-OECD and OECD countries may not be directly comparable.
Source: OECD, Revenue Statistics; Treasury estimates using IMF; Government Finance Statistics; and Centre for Monitoring the Indian Economy database.
This chart shows income taxes as a share of total taxation of selected economies in 2012.
| Per cent of taxation | Company taxes | Personal income taxes | Unallocated |
|---|---|---|---|
| Denmark | 6.3 | 50.7 | 4.9 |
| Australia | 18.9 | 39.2 | 0 |
| United States | 10.2 | 37.7 | 0 |
| Canada | 9.5 | 36.6 | 1.1 |
| Singapore | 29.3 | 15.4 | 0 |
| United Kingdom | 8.1 | 27.5 | 0 |
| India | 22 | 11.2 | 0.3 |
| Japan | 12.5 | 18.6 | 0 |
| Germany | 4.8 | 25.6 | 0 |
| Korea | 14.9 | 15 | 0 |
| France | 5.6 | 18 | 0 |
| China | - | - | 19.8 |
| OECD average | 8.5 | 24.5 | 0.6 |
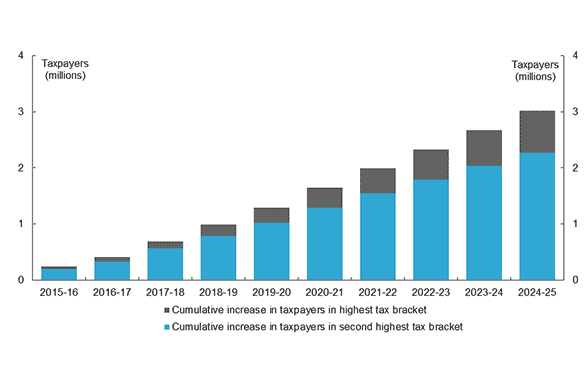
Chart 3 – Estimated cumulative increases in taxpayers in second highest and highest tax brackets, relative to 2014-15

This chart shows the cumulative increases in taxpayers in the second highest and highest tax brackets over the years 2015-16 to 2024-25 relative to 2014-15. By 2024-25 it is expected that approximately three million Australians will move into these two tax brackets.
| Estimated number of taxpayers | Cumulative increase in taxpayers in highest tax bracket (45% tax rate) | Cumulative increase in taxpayers in second highest tax bracket (37% tax rate) |
|---|---|---|
| 2014-15 | - | - |
| 2015-16 | 43,000 | 202,000 |
| 2016-17 | 79,000 | 338,000 |
| 2017-18 | 133,000 | 562,000 |
| 2018-19 | 195,000 | 792,000 |
| 2019-20 | 263,000 | 1,028,000 |
| 2020-21 | 348,000 | 1,296,000 |
| 2021-22 | 441,000 | 1,553,000 |
| 2022-23 | 535,000 | 1,793,000 |
| 2023-24 | 639,000 | 2,034,000 |
| 2024-25 | 751,000 | 2,268,000 |