Chart 3.1 Average and marginal tax rates, 2014-15
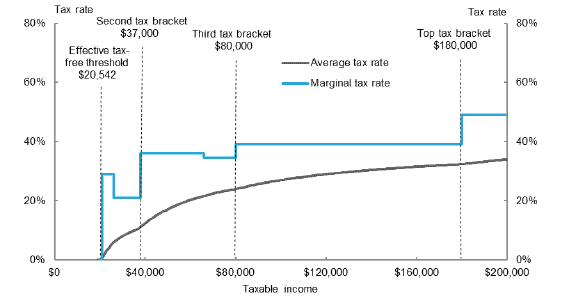
Notes: The rates shown are for a single person with no dependants who does not receive any Australian Government transfer payments. Marginal tax rates take account of the statutory rates shown in Table 3.1, as well as the Medicare levy of 2 per cent, the Temporary Budget Repair Levy (an additional 2 per cent on taxable income in excess of $180,000 per year) and the LITO. The LITO brings the effective tax-free threshold to $20,542. The 10 percentage point increase in marginal tax rates between $20,542 and $25,677 is due to the phase-out of the Medicare levy low-income concession. The 1.5 percentage point increase in marginal tax rates between $37,001 and $66,667 is due to the phase-out of the LITO.
This chart shows the average and marginal rates of tax paid at different levels of taxable income from $0 to $200,000, for a single taxpayer with no dependants and no eligibility for transfer payments. The chart shows that average rates of tax are less than marginal rates of tax at all levels of income. The chart also shows that: marginal tax rates generally increase with taxable income as described in table 3.1; no tax is paid on annual taxable income below $20,542; the phase-out of the Medicare levy low-income concession adds 10 percentage points to the statutory marginal rate of 19 per cent between taxable income of $20,542 and $25,677; and the phase-out of the low-income tax offset adds 1.5 percentage points to the statutory marginal rate of 32.5 per cent (and Medicare levy of 2 per cent) between taxable income of $37,000 and $66,667.
| Taxable Income | Average tax rate | Marginal tax rate |
|---|---|---|
| 0 | 0 | 0 |
| 1000 | 0 | 0 |
| 2000 | 0 | 0 |
| 3000 | 0 | 0 |
| 4000 | 0 | 0 |
| 5000 | 0 | 0 |
| 6000 | 0 | 0 |
| 7000 | 0 | 0 |
| 8000 | 0 | 0 |
| 9000 | 0 | 0 |
| 10000 | 0 | 0 |
| 11000 | 0 | 0 |
| 12000 | 0 | 0 |
| 13000 | 0 | 0 |
| 14000 | 0 | 0 |
| 15000 | 0 | 0 |
| 16000 | 0 | 0 |
| 17000 | 0 | 0 |
| 18000 | 0 | 0 |
| 19000 | 0 | 0 |
| 20000 | 0 | 0 |
| 21000 | 0.006 | 0.29 |
| 22000 | 0.019 | 0.29 |
| 23000 | 0.031 | 0.29 |
| 24000 | 0.042 | 0.29 |
| 25000 | 0.052 | 0.29 |
| 26000 | 0.06 | 0.29 |
| 27000 | 0.065 | 0.21 |
| 28000 | 0.071 | 0.21 |
| 29000 | 0.075 | 0.21 |
| 30000 | 0.08 | 0.21 |
| 31000 | 0.084 | 0.21 |
| 32000 | 0.088 | 0.21 |
| 33000 | 0.092 | 0.21 |
| 34000 | 0.095 | 0.21 |
| 35000 | 0.098 | 0.21 |
| 36000 | 0.102 | 0.21 |
| 37000 | 0.105 | 0.21 |
| 38000 | 0.111 | 0.36 |
| 39000 | 0.118 | 0.36 |
| 40000 | 0.124 | 0.36 |
| 41000 | 0.129 | 0.36 |
| 42000 | 0.135 | 0.36 |
| 43000 | 0.14 | 0.36 |
| 44000 | 0.145 | 0.36 |
| 45000 | 0.15 | 0.36 |
| 46000 | 0.155 | 0.36 |
| 47000 | 0.159 | 0.36 |
| 48000 | 0.163 | 0.36 |
| 49000 | 0.167 | 0.36 |
| 50000 | 0.171 | 0.36 |
| 51000 | 0.175 | 0.36 |
| 52000 | 0.178 | 0.36 |
| 53000 | 0.182 | 0.36 |
| 54000 | 0.185 | 0.36 |
| 55000 | 0.188 | 0.36 |
| 56000 | 0.191 | 0.36 |
| 57000 | 0.194 | 0.36 |
| 58000 | 0.197 | 0.36 |
| 59000 | 0.2 | 0.36 |
| 60000 | 0.202 | 0.36 |
| 61000 | 0.205 | 0.36 |
| 62000 | 0.208 | 0.36 |
| 63000 | 0.21 | 0.36 |
| 64000 | 0.212 | 0.36 |
| 65000 | 0.215 | 0.36 |
| 66000 | 0.217 | 0.36 |
| 67000 | 0.219 | 0.345 |
| 68000 | 0.221 | 0.345 |
| 69000 | 0.222 | 0.345 |
| 70000 | 0.224 | 0.345 |
| 71000 | 0.226 | 0.345 |
| 72000 | 0.228 | 0.345 |
| 73000 | 0.229 | 0.345 |
| 74000 | 0.231 | 0.345 |
| 75000 | 0.232 | 0.345 |
| 76000 | 0.234 | 0.345 |
| 77000 | 0.235 | 0.345 |
| 78000 | 0.237 | 0.345 |
| 79000 | 0.238 | 0.345 |
| 80000 | 0.239 | 0.345 |
| 81000 | 0.241 | 0.39 |
| 82000 | 0.243 | 0.39 |
| 83000 | 0.245 | 0.39 |
| 84000 | 0.247 | 0.39 |
| 85000 | 0.248 | 0.39 |
| 86000 | 0.25 | 0.39 |
| 87000 | 0.251 | 0.39 |
| 88000 | 0.253 | 0.39 |
| 89000 | 0.255 | 0.39 |
| 90000 | 0.256 | 0.39 |
| 91000 | 0.258 | 0.39 |
| 92000 | 0.259 | 0.39 |
| 93000 | 0.26 | 0.39 |
| 94000 | 0.262 | 0.39 |
| 95000 | 0.263 | 0.39 |
| 96000 | 0.264 | 0.39 |
| 97000 | 0.266 | 0.39 |
| 98000 | 0.267 | 0.39 |
| 99000 | 0.268 | 0.39 |
| 100000 | 0.269 | 0.39 |
| 101000 | 0.271 | 0.39 |
| 102000 | 0.272 | 0.39 |
| 103000 | 0.273 | 0.39 |
| 104000 | 0.274 | 0.39 |
| 105000 | 0.275 | 0.39 |
| 106000 | 0.276 | 0.39 |
| 107000 | 0.277 | 0.39 |
| 108000 | 0.278 | 0.39 |
| 109000 | 0.279 | 0.39 |
| 110000 | 0.28 | 0.39 |
| 111000 | 0.281 | 0.39 |
| 112000 | 0.282 | 0.39 |
| 113000 | 0.283 | 0.39 |
| 114000 | 0.284 | 0.39 |
| 115000 | 0.285 | 0.39 |
| 116000 | 0.286 | 0.39 |
| 117000 | 0.287 | 0.39 |
| 118000 | 0.288 | 0.39 |
| 119000 | 0.289 | 0.39 |
| 120000 | 0.29 | 0.39 |
| 121000 | 0.29 | 0.39 |
| 122000 | 0.291 | 0.39 |
| 123000 | 0.292 | 0.39 |
| 124000 | 0.293 | 0.39 |
| 125000 | 0.294 | 0.39 |
| 126000 | 0.294 | 0.39 |
| 127000 | 0.295 | 0.39 |
| 128000 | 0.296 | 0.39 |
| 129000 | 0.297 | 0.39 |
| 130000 | 0.297 | 0.39 |
| 131000 | 0.298 | 0.39 |
| 132000 | 0.299 | 0.39 |
| 133000 | 0.299 | 0.39 |
| 134000 | 0.3 | 0.39 |
| 135000 | 0.301 | 0.39 |
| 136000 | 0.301 | 0.39 |
| 137000 | 0.302 | 0.39 |
| 138000 | 0.303 | 0.39 |
| 139000 | 0.303 | 0.39 |
| 140000 | 0.304 | 0.39 |
| 141000 | 0.305 | 0.39 |
| 142000 | 0.305 | 0.39 |
| 143000 | 0.306 | 0.39 |
| 144000 | 0.306 | 0.39 |
| 145000 | 0.307 | 0.39 |
| 146000 | 0.307 | 0.39 |
| 147000 | 0.308 | 0.39 |
| 148000 | 0.309 | 0.39 |
| 149000 | 0.309 | 0.39 |
| 150000 | 0.31 | 0.39 |
| 151000 | 0.31 | 0.39 |
| 152000 | 0.311 | 0.39 |
| 153000 | 0.311 | 0.39 |
| 154000 | 0.312 | 0.39 |
| 155000 | 0.312 | 0.39 |
| 156000 | 0.313 | 0.39 |
| 157000 | 0.313 | 0.39 |
| 158000 | 0.314 | 0.39 |
| 159000 | 0.314 | 0.39 |
| 160000 | 0.315 | 0.39 |
| 161000 | 0.315 | 0.39 |
| 162000 | 0.316 | 0.39 |
| 163000 | 0.316 | 0.39 |
| 164000 | 0.317 | 0.39 |
| 165000 | 0.317 | 0.39 |
| 166000 | 0.317 | 0.39 |
| 167000 | 0.318 | 0.39 |
| 168000 | 0.318 | 0.39 |
| 169000 | 0.319 | 0.39 |
| 170000 | 0.319 | 0.39 |
| 171000 | 0.32 | 0.39 |
| 172000 | 0.32 | 0.39 |
| 173000 | 0.32 | 0.39 |
| 174000 | 0.321 | 0.39 |
| 175000 | 0.321 | 0.39 |
| 176000 | 0.322 | 0.39 |
| 177000 | 0.322 | 0.39 |
| 178000 | 0.322 | 0.39 |
| 179000 | 0.323 | 0.39 |
| 180000 | 0.323 | 0.39 |
| 181000 | 0.324 | 0.49 |
| 182000 | 0.325 | 0.49 |
| 183000 | 0.326 | 0.49 |
| 184000 | 0.327 | 0.49 |
| 185000 | 0.328 | 0.49 |
| 186000 | 0.328 | 0.49 |
| 187000 | 0.329 | 0.49 |
| 188000 | 0.33 | 0.49 |
| 189000 | 0.331 | 0.49 |
| 190000 | 0.332 | 0.49 |
| 191000 | 0.333 | 0.49 |
| 192000 | 0.333 | 0.49 |
| 193000 | 0.334 | 0.49 |
| 194000 | 0.335 | 0.49 |
| 195000 | 0.336 | 0.49 |
| 196000 | 0.337 | 0.49 |
| 197000 | 0.337 | 0.49 |
| 198000 | 0.338 | 0.49 |
| 199000 | 0.339 | 0.49 |
| 200000 | 0.34 | 0.49 |
Chart 3.2 Who paid individuals income tax, 2011-12
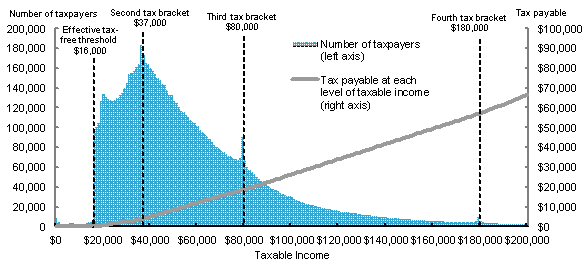
Note: The chart shows the number of tax filers who paid net income tax in thousand dollar taxable income brackets up to $200,000. Tax payable is calculated by applying the individual income tax rate scale, LITO and the Medicare levy to taxable income.
Source: Treasury calculations using administrative data from 2011-12 tax returns for individuals.
This chart shows the number of taxpayers who filed tax returns, and tax payable, in 2011-12 in $1,000 increments of taxable income between $0 and $200,000. The chart further shows the amount of tax paid in 2011-12, taking account of the personal tax rate scale, Medicare Levy and Low Income Tax Offset.
| Taxable income | Number of taxpayers | Notional tax paid |
|---|---|---|
| 1,000 | 8300 | 0 |
| 2,000 | 4474 | 0 |
| 3,000 | 3404 | 0 |
| 4,000 | 3033 | 0 |
| 5,000 | 2724 | 0 |
| 6,000 | 2773 | 0 |
| 7,000 | 3760 | 0 |
| 8,000 | 3248 | 0 |
| 9,000 | 2824 | 0 |
| 10,000 | 2517 | 0 |
| 11,000 | 2216 | 0 |
| 12,000 | 2246 | 0 |
| 13,000 | 3013 | 0 |
| 14,000 | 3760 | 0 |
| 15,000 | 4386 | 0 |
| 16,000 | 4989 | 0 |
| 17,000 | 97595 | 150 |
| 18,000 | 100728 | 300 |
| 19,000 | 105233 | 450 |
| 20,000 | 126493 | 660 |
| 21,000 | 133701 | 910 |
| 22,000 | 130970 | 1160 |
| 23,000 | 129499 | 1395 |
| 24,000 | 127669 | 1560 |
| 25,000 | 127437 | 1725 |
| 26,000 | 128199 | 1890 |
| 27,000 | 129512 | 2055 |
| 28,000 | 132955 | 2220 |
| 29,000 | 134793 | 2385 |
| 30,000 | 140090 | 2550 |
| 31,000 | 145083 | 2755 |
| 32,000 | 153883 | 2960 |
| 33,000 | 154883 | 3165 |
| 34,000 | 157589 | 3370 |
| 35,000 | 161333 | 3575 |
| 36,000 | 164517 | 3780 |
| 37,000 | 183444 | 3985 |
| 38,000 | 173070 | 4340 |
| 39,000 | 165791 | 4695 |
| 40,000 | 164655 | 5050 |
| 41,000 | 160524 | 5405 |
| 42,000 | 156882 | 5760 |
| 43,000 | 154104 | 6115 |
| 44,000 | 150667 | 6470 |
| 45,000 | 148413 | 6825 |
| 46,000 | 144522 | 7180 |
| 47,000 | 143548 | 7535 |
| 48,000 | 138183 | 7890 |
| 49,000 | 133340 | 8245 |
| 50,000 | 132933 | 8600 |
| 51,000 | 127337 | 8955 |
| 52,000 | 124513 | 9310 |
| 53,000 | 120717 | 9665 |
| 54,000 | 117120 | 10020 |
| 55,000 | 116061 | 10375 |
| 56,000 | 112707 | 10730 |
| 57,000 | 110513 | 11085 |
| 58,000 | 107754 | 11440 |
| 59,000 | 105371 | 11795 |
| 60,000 | 104379 | 12150 |
| 61,000 | 101499 | 12505 |
| 62,000 | 97812 | 12860 |
| 63,000 | 95357 | 13215 |
| 64,000 | 93524 | 13570 |
| 65,000 | 91305 | 13925 |
| 66,000 | 88473 | 14280 |
| 67,000 | 85650 | 14635 |
| 68,000 | 82571 | 14970 |
| 69,000 | 80500 | 15285 |
| 70,000 | 79303 | 15600 |
| 71,000 | 77351 | 15915 |
| 72,000 | 75500 | 16230 |
| 73,000 | 73848 | 16545 |
| 74,000 | 71742 | 16860 |
| 75,000 | 71091 | 17175 |
| 76,000 | 69085 | 17490 |
| 77,000 | 68366 | 17805 |
| 78,000 | 67406 | 18120 |
| 79,000 | 69155 | 18435 |
| 80,000 | 90188 | 18750 |
| 81,000 | 67418 | 19135 |
| 82,000 | 60786 | 19520 |
| 83,000 | 57808 | 19905 |
| 84,000 | 55271 | 20290 |
| 85,000 | 53076 | 20675 |
| 86,000 | 50266 | 21060 |
| 87,000 | 48366 | 21445 |
| 88,000 | 45861 | 21830 |
| 89,000 | 44725 | 22215 |
| 90,000 | 42895 | 22600 |
| 91,000 | 41126 | 22985 |
| 92,000 | 39613 | 23370 |
| 93,000 | 38117 | 23755 |
| 94,000 | 37023 | 24140 |
| 95,000 | 35901 | 24525 |
| 96,000 | 34190 | 24910 |
| 97,000 | 33669 | 25295 |
| 98,000 | 32454 | 25680 |
| 99,000 | 31441 | 26065 |
| 100,000 | 31150 | 26450 |
| 101,000 | 29651 | 26835 |
| 102,000 | 28419 | 27220 |
| 103,000 | 27255 | 27605 |
| 104,000 | 26123 | 27990 |
| 105,000 | 25413 | 28375 |
| 106,000 | 24496 | 28760 |
| 107,000 | 23567 | 29145 |
| 108,000 | 23061 | 29530 |
| 109,000 | 22418 | 29915 |
| 110,000 | 21614 | 30300 |
| 111,000 | 21041 | 30685 |
| 112,000 | 20470 | 31070 |
| 113,000 | 19777 | 31455 |
| 114,000 | 19263 | 31840 |
| 115,000 | 19290 | 32225 |
| 116,000 | 18506 | 32610 |
| 117,000 | 17956 | 32995 |
| 118,000 | 17289 | 33380 |
| 119,000 | 16631 | 33765 |
| 120,000 | 16551 | 34150 |
| 121,000 | 15960 | 34535 |
| 122,000 | 15507 | 34920 |
| 123,000 | 15055 | 35305 |
| 124,000 | 14701 | 35690 |
| 125,000 | 14535 | 36075 |
| 126,000 | 14182 | 36460 |
| 127,000 | 13675 | 36845 |
| 128,000 | 13513 | 37230 |
| 129,000 | 13008 | 37615 |
| 130,000 | 12950 | 38000 |
| 131,000 | 12143 | 38385 |
| 132,000 | 12037 | 38770 |
| 133,000 | 11821 | 39155 |
| 134,000 | 11496 | 39540 |
| 135,000 | 11259 | 39925 |
| 136,000 | 10824 | 40310 |
| 137,000 | 10741 | 40695 |
| 138,000 | 10251 | 41080 |
| 139,000 | 10025 | 41465 |
| 140,000 | 9781 | 41850 |
| 141,000 | 9545 | 42235 |
| 142,000 | 9355 | 42620 |
| 143,000 | 9212 | 43005 |
| 144,000 | 8854 | 43390 |
| 145,000 | 8653 | 43775 |
| 146,000 | 8558 | 44160 |
| 147,000 | 8405 | 44545 |
| 148,000 | 8109 | 44930 |
| 149,000 | 8059 | 45315 |
| 150,000 | 8303 | 45700 |
| 151,000 | 7571 | 46085 |
| 152,000 | 7349 | 46470 |
| 153,000 | 7139 | 46855 |
| 154,000 | 6929 | 47240 |
| 155,000 | 6777 | 47625 |
| 156,000 | 6645 | 48010 |
| 157,000 | 6610 | 48395 |
| 158,000 | 6379 | 48780 |
| 159,000 | 6226 | 49165 |
| 160,000 | 6153 | 49550 |
| 161,000 | 5991 | 49935 |
| 162,000 | 5774 | 50320 |
| 163,000 | 5663 | 50705 |
| 164,000 | 5610 | 51090 |
| 165,000 | 5561 | 51475 |
| 166,000 | 5262 | 51860 |
| 167,000 | 5334 | 52245 |
| 168,000 | 5252 | 52630 |
| 169,000 | 5056 | 53015 |
| 170,000 | 5025 | 53400 |
| 171,000 | 5052 | 53785 |
| 172,000 | 4978 | 54170 |
| 173,000 | 4805 | 54555 |
| 174,000 | 4798 | 54940 |
| 175,000 | 4910 | 55325 |
| 176,000 | 4967 | 55710 |
| 177,000 | 5081 | 56095 |
| 178,000 | 5186 | 56480 |
| 179,000 | 5646 | 56865 |
| 180,000 | 9788 | 57250 |
| 181,000 | 6120 | 57715 |
| 182,000 | 4576 | 58180 |
| 183,000 | 4142 | 58645 |
| 184,000 | 4045 | 59110 |
| 185,000 | 3894 | 59575 |
| 186,000 | 3724 | 60040 |
| 187,000 | 3721 | 60505 |
| 188,000 | 3560 | 60970 |
| 189,000 | 3393 | 61435 |
| 190,000 | 3299 | 61900 |
| 191,000 | 3221 | 62365 |
| 192,000 | 3133 | 62830 |
| 193,000 | 3195 | 63295 |
| 194,000 | 3031 | 63760 |
| 195,000 | 2870 | 64225 |
| 196,000 | 2846 | 64690 |
| 197,000 | 2749 | 65155 |
| 198,000 | 2721 | 65620 |
| 199,000 | 2798 | 66085 |
| 200,000 | 2747 | 66550 |
Chart 3.3 Employment status by taxable income, 2014-15
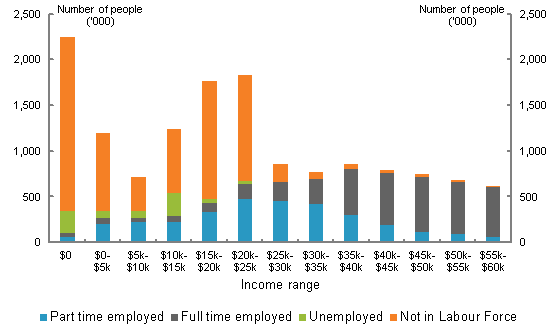
Source: Treasury estimates using Treasury’s version of STINMOD
This stacked column chart has columns at $5,000 increments of taxable income from $0 to $60,000 showing the number of people who are: in part time employment; in full time employment; unemployed; or not in the labour force at each income range.
| Income range | Part time employed | Full time employed | Unemployed | Not in Labour Force |
|---|---|---|---|---|
| $0 | 54,377 | 52,603 | 242,780 | 1,898,230 |
| $0-$5,000 | 203,476 | 58,887 | 83,358 | 847,345 |
| $5,000-$10,000 | 223,882 | 41,423 | 80,591 | 367,419 |
| $10,000-$15,000 | 226,442 | 67,873 | 251,899 | 699,219 |
| $15,000-$20,000 | 334,473 | 96,084 | 49,672 | 1,289,202 |
| $20,000-$25,000 | 474,249 | 161,544 | 31,551 | 1,163,065 |
| $25,000-$30,000 | 456,407 | 200,935 | 9,670 | 192,042 |
| $30,000-$35,000 | 416,590 | 280,293 | 0 | 72,891 |
| $35,000-$40,000 | 300,467 | 504,213 | 0 | 55,047 |
| $40,000-$45,000 | 186,335 | 575,998 | 0 | 25,804 |
| $45,000-$50,000 | 113,438 | 608,221 | 0 | 26,363 |
| $50,000-$55,000 | 97,058 | 564,721 | 0 | 23,126 |
| $55,000-$60,000 | 59,125 | 547,801 | 0 | 15,517 |
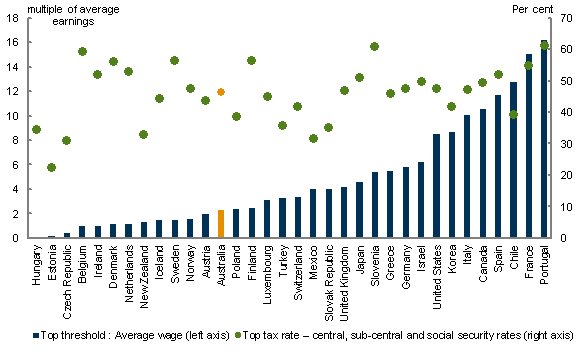
Chart 3.4 Top marginal tax rates comparison, OECD countries, 2013
Source: OECD 2014, Tax Database — Personal Income Tax Rates, OECD, Paris, viewed 24 November 2014.
Note: Numbers for Australia are for 2013-14. Australia’s top marginal tax rate for 2014-15 has increased to 49 per cent (45 per cent top statutory personal income tax rate plus 2 per cent Medicare levy plus 2 per cent Temporary Budget Repair Levy).
This chart shows the top marginal individuals’ income tax rates for all OECD countries in 2013, taking account of central government and sub-central government individuals’ income tax rates where applicable. It also shows the income threshold from which that top marginal individuals’ income tax rate takes effect, as a multiple of average earnings. Australia’s top marginal tax rate is 46.5 per cent, which is around the average for all OECD countries, however Australia’s top marginal tax rate applies from a relatively low threshold when compared to other OECD countries.
| Top tax rate - central, sub-central and social security rates (per cent) | Top threshold as a multiple of average earnings | |
|---|---|---|
| Hungary | 34.5 | 0 |
| Estonia | 22.6 | 0.2 |
| Czech Republic | 31.1 | 0.4 |
| Belgium | 59.5 | 1 |
| Ireland | 52 | 1 |
| Denmark | 56.2 | 1.2 |
| Netherlands | 53.1 | 1.2 |
| New Zealand | 33 | 1.3 |
| Iceland | 44.4 | 1.5 |
| Sweden | 56.7 | 1.5 |
| Norway | 47.8 | 1.6 |
| Austria | 43.7 | 2 |
| Australia | 46.5 | 2.3 |
| Poland | 38.8 | 2.4 |
| Finland | 56.6 | 2.5 |
| Luxembourg | 45 | 3.1 |
| Turkey | 35.8 | 3.3 |
| Switzerland | 41.8 | 3.4 |
| Mexico | 31.7 | 4 |
| Slovak Republic | 35.1 | 4 |
| United Kingdom | 47 | 4.2 |
| Japan | 51.1 | 4.6 |
| Slovenia | 61.1 | 5.4 |
| Greece | 46 | 5.5 |
| Germany | 47.5 | 5.8 |
| Israel | 50 | 6.2 |
| United States | 47.7 | 8.5 |
| Korea | 41.9 | 8.7 |
| Italy | 47.3 | 10.1 |
| Canada | 49.5 | 10.6 |
| Spain | 52 | 11.7 |
| Chile | 39.5 | 12.8 |
| France | 54.9 | 15.1 |
| Portugal | 61.3 | 16.2 |
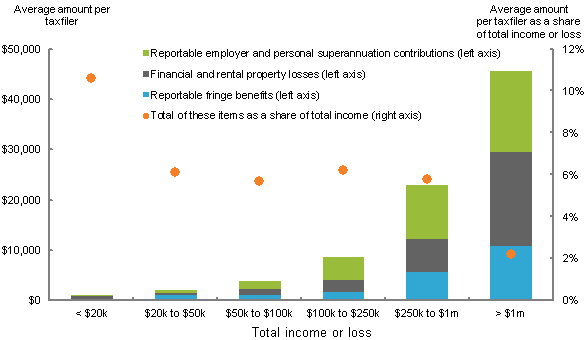
Chart 3.5 Use of concessions and losses, by total income, 2011-12
Source: Treasury estimates based on ATO 2014, Taxation Statistics 2011-12, ATO, Canberra.
This chart shows the extent to which certain concessions and losses were used in different income ranges in 2011-12. The chart shows that the use of reportable fringe benefits, reportable and personal superannuation contributions, and financial and property losses increased in dollar terms as total income increased.
The chart also shows that the use of these items as a proportion of total income is around 6 per cent for total incomes between $20,000 and $1,000,000. However this proportion increases significantly for total incomes below $20,000 and deceases significantly for taxable income over $1,000,000.
| Total income, 2011-12 | Reportable fringe benefits (average amount per taxfiler, left axis) | Financial and rental property losses (average amount per taxfiler, left axis) | Reportable employer and personal superannuation contributions (left axis) | Total of these items as a share of total income (right axis) (per cent) |
|---|---|---|---|---|
| < $20,000 | 247 | 582 | 141 | 10.6 |
| $20,000 to $50,000 | 1033 | 536 | 556 | 6.1 |
| $50,000 to $100,000 | 1195 | 1047 | 1760 | 5.7 |
| $100,000 to $250,000 | 1791 | 2250 | 4539 | 6.2 |
| $250,000 to $1m | 5698 | 6506 | 10743 | 5.8 |
| > $1m | 10923 | 18654 | 15982 | 2.2 |
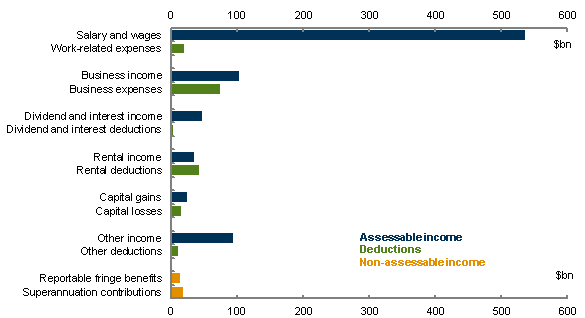
Chart 3.6 Major sources of income and deductions, 2011-12
Source: ATO 2014, Taxation Statistics 2011-12, ATO, Canberra.
Notes: ‘Business income’ and ‘business deductions’ are income earned and deductions incurred by individuals carrying on a business (for example, as a sole trader). ‘Other income’ includes distributions from partnerships and trusts; taxable Australian Government transfer payments; and allowances, benefits, earnings and tips. ‘Other deductions’ includes charitable donations and the cost of managing tax affairs. ‘Superannuation contributions’ includes reportable employer superannuation contributions and personal superannuation contributions, but not superannuation guarantee contributions. ‘Reportable fringe benefits’ does not fully reflect remuneration in the form of fringe benefits as, among other things, it does not include fringe benefits below the $2,000 threshold (that are not required to be reported) or fringe benefits that are exempt from tax.
This chart shows the major sources of assessable income, non-assessable income and deductions reported in Australia’s individual income tax returns in 2011-12. Salary and wages is by far the largest source of assessable income, followed by business income and other income. Business expenses are the largest source of deductions, followed by rental deductions and work related expenses.
| $bn | |
|---|---|
| Salary and wages | 535.6 |
| Work-related expenses | 19.4 |
| Business income | 101.7 |
| Business expenses | 74.5 |
| Dividend and interest income | 46.3 |
| Dividend and interest deductions | 2.5 |
| Rental income | 34.0 |
| Rental deductions | 41.9 |
| Capital gains | 24.1 |
| Capital losses | 14.9 |
| Other income | 93.5 |
| Other deductions | 10.8 |
| Reportable fringe benefits | 13.2 |
| Superannuation contributions | 17.1 |