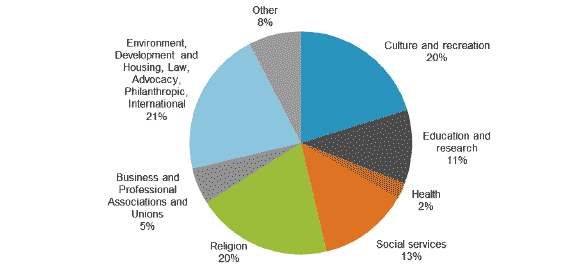
Chart 7.1 Share of NFP organisations by activity, 2012-13

Source: ABS 2014, Australian National Accounts: Non-Profit Institutions Satellite Account, 2012-13, cat. no. 5256.0, ABS, Canberra.
The chart shows the proportion of not-for-profit organisations classified by activity. Health accounts for the smallest proportion of organisations, while Environment, Development and Housing, Law, Advocacy, Philanthropic, International accounts for the largest proportion of not-for-profit organisations.
| Percentage | |
|---|---|
| Culture and recreation | 20 |
| Education and research | 11 |
| Health | 2 |
| Social services | 13 |
| Religion | 20 |
| Business and Professional Associations and Unions | 5 |
| Environment, Development and Housing, Law, Advocacy, Philanthropic, International | 21 |
| Other | 8 |
Chart 7.2 Shares of total gross value added by activity

Source: ABS 2014, Australian National Accounts: Non-Profit Institutions Satellite Account, 2012-13, cat. no. 5256.0, ABS, Canberra.
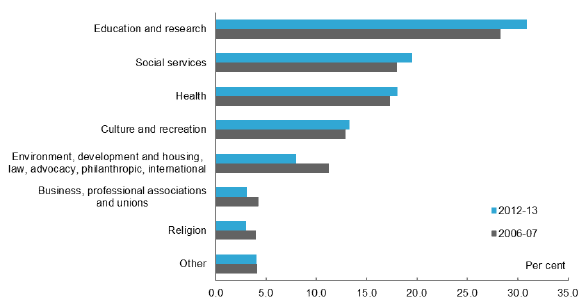
The chart shows the share of gross value added by activity in the not-for-profit sector for 2006-07 and 2012-13. Gross value added measures the value of output produced by not-for-profit organisations less the cost of goods and services used up in their processes of production. These shares have remained broadly stable, with education and research comprising the largest share of gross value added in the not-for-profit sector.
| 2006-07 | 2012-13 | |
|---|---|---|
| Culture and recreation | 12.9 | 13.2 |
| Education and research | 28.3 | 30.9 |
| Health | 17.3 | 18.0 |
| Social services | 18.0 | 19.5 |
| Religion | 4.0 | 3.1 |
| Business, Professional Associations and Unions | 4.2 | 3.1 |
| Environment, Development and Housing, Law, Advocacy, Philanthropic, International | 11.2 | 8.0 |
| Other | 4.1 | 4.1 |
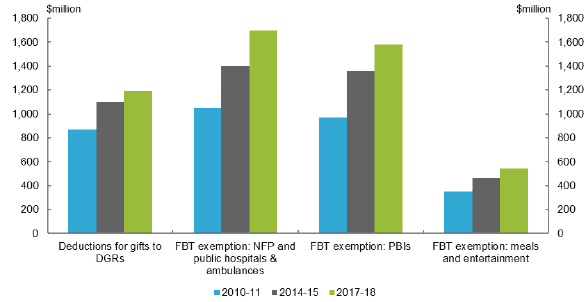
Chart 7.3 Estimated revenue forgone for selected Commonwealth tax concessions

Source: Australian Government 2015, Tax Expenditures Statement 2014, Australian Government, Canberra.
The chart shows the estimated revenue forgone in 2010-11, 2014-15 and 2017-18 for four tax concessions given to the not-for-profit sector. These are: capped exemptions from paying Fringe Benefits Tax for public and non-profit hospitals and public ambulance services, and for public benevolent institutions; an uncapped exemption for these organisations for meals and entertainment facility leasing expenses; and personal income tax deductions for gifts to Deductible Gift Recipients.
| Estimated revenue forgone for selected Commonwealth tax concessions | 2010‑11 $m |
2014‑15 $m |
2017‑18 $m |
|---|---|---|---|
| Deductions for gifts to DGRs | 870 | 1,100 | 1,190 |
| FBT exemption: NFP and public hospitals & ambulances | 1,050 | 1,400 | 1,700 |
| FBT exemption: PBIs | 970 | 1,360 | 1,580 |
| FBT exemption: meals and entertainment | 350 | 465 | 545 |