Key points
This chapter outlines the path of our economy before accounting for domestic carbon pricing, taking into account other forces at work on the economy.
The Australian economy will continue to grow, generating jobs and income. Nonetheless, the Australian economy is expected to undergo substantial structural change over the next 40 years, driven by demographic pressures, a sustained high terms of trade, and changes in consumer preferences and technology.
Real gross national income (GNI) per person is expected to grow at an annual rate of 1.2 per cent to 2050. While aggregate growth is projected to be strong, growth across sectors and industries will vary.
Over the next decade, the services sector grows the strongest in absolute terms, while mining and related sectors grow the most in percentage terms, owing to the high terms of trade.
The manufacturing sector grows at a slower rate than the rest of the economy — around ½ per cent annually to 2020 — as Australia's economy continues the long-term shift towards services.
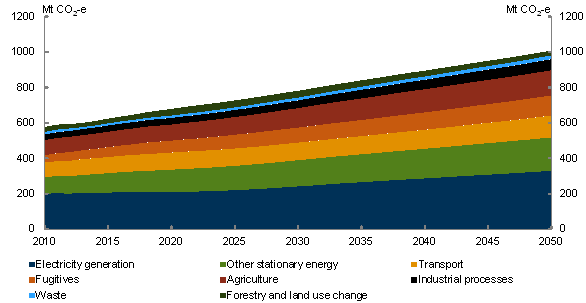
The medium global action scenario shows that, in the absence of a carbon price, Australia's emissions are expected to grow to 679 Mt CO2-e by 2020 (22 per cent above 2000 levels), and to 1,008 Mt CO2-e (82 per cent above 2000 levels) by 2050.
Electricity sector emissions are projected to grow by over 60 per cent by 2050, driven by a doubling in energy demand. Growth in electricity demand is largely satisfied by increased renewables over the next ten years, but new coal-fired power plants make up the majority of new baseload capacity thereafter.
Even in the absence of a carbon price, household electricity prices are projected to grow significantly over the next ten years, partly driven by higher gas prices and increased costs of new generation capacity, and partly by rising network charges.
Transport emissions continue to grow, but at a slower rate primarily due to higher and rising oil prices.
The Australian economy continues to prosper without a carbon price while other countries take action. However, Australia's prosperity also depends on the actions of other countries that are likely to take measures to penalise countries that do not assist in global mitigation efforts.
The analysis in this report has been updated from the 2008 modelling to incorporate new policies such as the enhanced Renewable Energy Target, updated population projections and international mitigation action.
4.1 Introduction
The global action scenarios tell a story of an Australian economy that will continue to grow, generating jobs and income growth. It is also a story of ongoing and substantial structural transformation driven by demographic change, the high terms of trade, uneven productivity growth across industries, and continued trend changes in consumer preferences. While aggregate growth is projected to be strong, growth across sectors and industries varies, with the strongest percentage growth in mining and related sectors over the coming decade.
If Australia does not act on climate change, growth boosts Australia's real gross national income (GNI) per person by over 63 per cent from 2009-10 to 20501, excluding the likely costs from climate change itself.2 GNI growth per person moderates to an average of 1.2 per cent per year reflecting a falling terms of trade, and slowing labour force growth.
By 2050, Australia's population is projected to increase by 62 per cent to be 36.3 million. Australia's ageing population drives slower economic growth while creating increased demand for health and aged care services. Ageing of the population is projected to slow annual real GDP growth per person by 0.3 percentage points.
International action on climate change has a small negative impact on the Australian economy, through reduced demand for our exports relative to a baseline where global emissions continue to grow strongly, particularly energy exports such as coal and gas. If the world acts to achieve a 550 ppm stabilisation goal, Australia's GNI growth is expected to be reduced by less than 0.03 of a percentage point per year over the period to 2050, or equivalently the level of Australian GNI in 2050 is reduced by around 1.2 per cent relative to a baseline where global emissions continue to grow strongly.
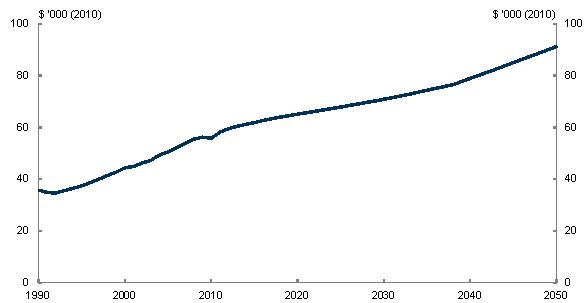
In the medium global action scenario with a 550 ppm target, Australians will be significantly wealthier in 2020 and 2050 than today. Real GNI per person is projected to increase from today's levels of $56,000 to around $65,000 per person in 2020 and around $91,000 per person in 2050 (in 2010 dollars).
While the ageing population slows economic growth, movements in the terms of trade drive national income growth. Improvements in the terms of trade have provided more than half of Australia's GNI growth since the mining boom started in 2004.
Chart 4.1: Australian real GNI per person
Medium global action scenario
Note: All years in this publication are Australian financial years, ending 30 June of the year quoted.
Source: ABS and Treasury estimates from MMRF.
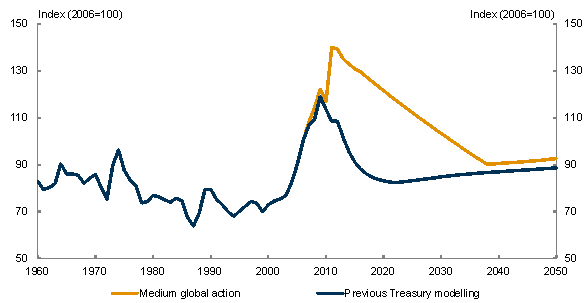
Terms of trade projections have changed significantly since the previous modelling, now peaking in 2010-11, almost 30 per cent higher than the previous projection. While they gradually unwind, they remain historically high for a considerable time, in contrast to previous modelling, reflecting higher non-rural commodity prices due to stronger demand for Australia's resources and more persistent supply constraints.
Chart 4.2: Real GNI growth by source, 1970 to 2010 and 2010 to 2050
Medium global action scenario
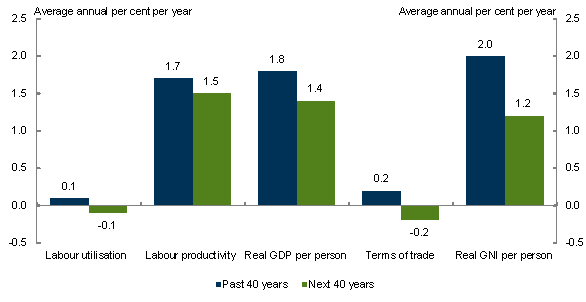
Note: Labour utilisation includes contributions from share of population aged 15 and over, participation rate, unemployment rate and average hours worked. Terms of trade include the contribution from net income transfers.
Source: ABS, Treasury and Treasury estimates from MMRF.
Growth in different industries is important for emissions as some activities are more emission intensive than others. In recent years, energy and emission-intensive industries have influenced Australia's living standards more than their share of production would suggest. This reflects their export share and high world prices.
These global action scenarios assume other countries that constrain their own carbon emissions do not restrict trade with Australia. In these scenarios, Australia would benefit initially from not pricing carbon. Increases in the cost of producing emission-intensive goods in other countries that take action on climate change would raise demand for Australian emission-intensive goods. However, these scenarios are unlikely to eventuate as other countries are likely to take measures to penalise high-income countries like Australia that are seen to free ride on the emission reduction efforts of others.
A sensitivity analysis was undertaken to examine the effect of other countries imposing a border tax adjustment (BTA) on Australia. Each of Australia's trading partners who act on climate change was assumed to apply a border tax on Australian exports to reflect their carbon content, and a subsidy on their own exports to Australia. A BTA on Australian trade leads to a slight improvement in gross world product compared with the medium global action scenario, as it partially brings Australia into the global mitigation effort. For Australia, such a border tax adjustment would reduce GNI per person, by around 0.3 per cent in 2020, compared to the medium global action scenario.
Box 4.1: Australia's terms of trade and exchange rate
Australia has experienced a sustained increase in the terms of trade throughout the past decade as world demand for non-rural commodities, supported by Asia's rapid industrialisation and urbanisation, has outstripped supply. As a result, Australia's commodity prices and terms of trade rose sharply through the 2000s, except during the global financial crisis (GFC).
Supply has responded slowly to these high prices, despite increasing investment, reflecting long lead times for new resource projects. These supply constraints, coupled with recent weather disruptions, underlie forecasts of a further rise in Australia's terms of trade in 2010-11. As a result, the terms of trade are almost 30 per cent higher in 2010-11 than in the previous modelling. This results in the projected level of Australia's GNI per person in the global action scenarios being around 4½ per cent higher in 2020 than in the 2008 climate change mitigation modelling (Australian Government, 2008).
As world commodity producers increase supply in response to current high prices and rates of return, commodity prices are expected to gradually fall. Hence, Australia's terms of trade are projected to decline by slightly more than 20 per cent over a 15 year period after peaking in 2010-11, and continue falling until 2038. This projected fall in the terms of trade is now more gradual than assumed in the previous modelling due to persistent supply constraints and stronger global demand. After 2038, Australia's terms of trade improve gradually as export prices rise and import prices remain modest, reflecting likely patterns of global productivity growth.
Australia's exchange rate increased from an average of around 60 US cents in the period between the Asian financial crisis and 2004, to an average of 80 US cents during the first stage of the mining boom. The exchange rate has risen further after the GFC, reflecting high commodity prices, and consistent with the 2011-12 Budget, is assumed to be 107 US cents in 2011-12. Over the projection period, the exchange rate moves to maintain Australia's external balance, responding to movements in the terms of trade, trade volumes and income flows.
Chart 4.3: Terms of trade
Source: ABS and Treasury estimates from MMRF.
4.2 Emissions
Without a carbon price, Australia's emissions are expected to reach 679 Mt CO2-e in 2020 (22 per cent above 2000 levels) in the medium global action scenario and 664 Mt CO2-e in 2020 (20 per cent above 2000 levels) in the ambitious global action scenario. Emissions are projected to continue to increase, reaching 1,008 Mt CO2-e (82 per cent above 2000 levels) by 2050 in the medium global action scenario and 951 Mt CO2-e in 2050 (71 per cent above 2000 levels) in the ambitious global action scenario.
Chart 4.4: Australia's emissions
Medium global action scenario
Source: Treasury estimates from MMRF.
Australia's abatement task is significant. To meet the unconditional 5 per cent reduction target by 2020, 159 Mt CO2-e of abatement is required by 2020. This excludes abatement from the Carbon Farming Initiative (CFI) of 7 Mt CO2-e in 2020. Without a domestic carbon price, CFI abatement is exported or used in voluntary markets and therefore cannot be counted towards Australia's abatement task.
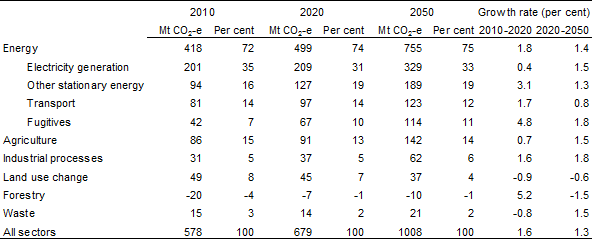
Australia's emissions mainly flow from energy production, which is dominated by the use of black and brown coal. Stationary energy is the largest source of emissions, at around half of total emissions, of which more than two thirds come from electricity generation. Stationary energy sector emissions grew by almost 50 per cent (97 Mt CO2-e) from 1990 to 2010 and are projected in the medium global action scenario to grow to 518 Mt CO2-e by 2050.
The strongest emissions growth in this sector is from electricity generation, which is projected to increase by around 130 Mt CO2-e by 2050. Demand for electricity continues to rise as the population grows, and reliance on black and brown coal continues.
Table 4.1: Emissions by source
Medium global action scenario
Note: All years in this publication are Australian financial years, ending 30 June of the year quoted.
Source: Treasury estimates from MMRF.
Agriculture and changes in land use, unlike in most OECD economies, contribute significantly to Australia's emissions. Emissions from agriculture are expected to grow broadly in line with growth in agricultural output. Output growth reflects ongoing productivity growth and strong world demand for Australian agricultural goods. By 2050, emissions from agriculture are projected to be just over 140 Mt CO2-e.
Fugitive emissions include liberated gas previously trapped within coal seams, emissions released in producing and processing oil and gas, and gas leakage through transmission and distribution. Emissions from the fugitives sector grow strongly and more than double to 114 Mt CO2-e by 2050. Continued world demand for Australia's fossil fuels, coal and gas, drives this growth although it is partly offset by rising gas prices and global mitigation efforts.
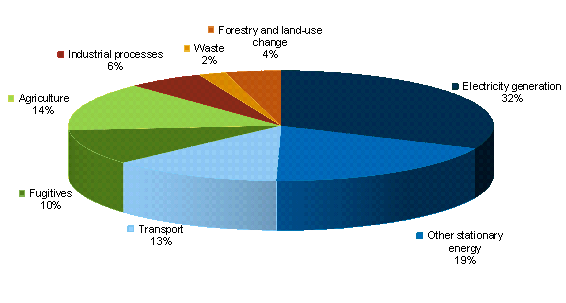
Chart 4.5: Share of cumulative emissions — 2009-10 to 2050
Medium global action scenario
Source: Treasury estimates from MMRF.
The emission intensity of energy-intensive industries is expected to fall slightly to 2050, largely reflecting continual improvements in energy efficiency. As the economy shifts towards the services sectors, the aggregate emission intensity of output is also expected to fall.
Australia's emissions per person are one of the highest in the OECD and amongst the highest in the world. However, they are broadly comparable to similar resource rich economies, such as Canada. In 2009-10, Australia's emissions per person were 26 t CO2-e and are expected to increase slightly to 2050, without domestic carbon pricing.
4.3 The macroeconomy
4.3.1 Consumption and investment
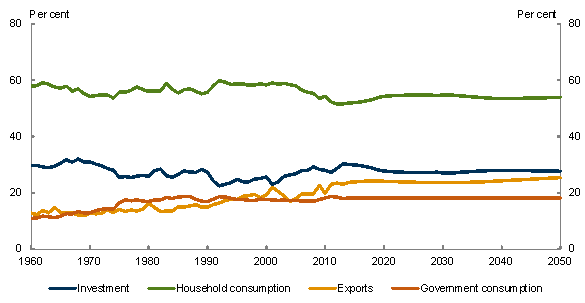
Under the medium global action scenario, household consumption remains roughly constant as a share of nominal GDP. Household consumption expenditure increases by more than 160 per cent from 2009-10 to 2050. As Australian per person income rises, household preferences continue to shift to demand more services. Total government consumption (including federal, state and local) is assumed to be broadly constant as a share of nominal GDP.
Chart 4.6: Consumption, investment and export shares of nominal GDP
Medium global action scenario
Note: MMRF estimates after 2010 are spliced onto historical ABS data.
Source: ABS and Treasury estimates from MMRF.
Investment's share of nominal GDP increases in the near term as investment, particularly in mining and related construction, responds to strong global demand for Australia's mineral resources. The massive forward pipeline of mining investment reflects record profitability and the prospect of continued strong demand for commodities. Some $430 billion in resources investment is either underway or planned as at April 2011, up from around $380 billion in October 2010 (ABARES, 2011b). Mining investment in 2009-10 has trebled from its 2004 level and is expected to remain at high levels.
Investment's share of GDP gradually falls in the second half of the 2010s, as the terms of trade decline, increased global supply pushes mining commodity prices down, and current projects are completed. Thereafter, investment's share of GDP remains broadly flat.
4.3.2 Exports
With rising incomes in developing economies and the world's economic geography shifting from West to East, Asia's rising middle class will spend a larger share of its income on more energy-intensive goods, higher value food products and services. Increasing consumer purchasing power and changing spending patterns will strengthen demand for Australia's exports, beyond mining, and substantially change Australia's pattern of trade.
China is already Australia's largest export market, and China and India are projected to be the first and second largest export markets by 2050 — positions held until recently by Japan and the European Union.
Export shares shift between sectors by 2050, with services exports becoming as important as mining and related manufacturing. Australia's exports continue to diversify to 2050.
Australia's exports are more emission intensive than total Australian production. This emission intensity remains high until 2020, then falls gradually as productivity, including in energy use and other emission-intensive inputs, continues to improve. There is a compositional shift to relatively low-emission exports, such as tourism and education services, as demand from the emerging Asian middle class increases.
Box 4.2: Energy price assumptions
World real prices for oil and coal in the global action scenarios are higher than in previous modelling (CPRS-5) and are expected to remain strong. World gas prices have fallen recently but are expected to grow strongly over the next 25 years.
Coal prices have risen dramatically in recent years. Rapidly increasing demand, particularly from China and India, and a sluggish supply response have driven these rises. Current contractual arrangements indicate prices will continue to remain at elevated levels into 2011-12. Real coal prices then fall through to 2028 in the global action scenarios, as increased supply comes on line and demand growth moderates in response to global mitigation action. Coal prices are expected to stabilise around the level implied by the long-term marginal cost of extraction, which itself is influenced by mitigation action.
Oil prices have risen in recent years and are expected to remain at elevated levels. A range of factors contribute to the rise including: growing demand from developing economies; a fall in spare production capacity; allowances for carbon pricing; and political uncertainty affecting major producers. Prices will continue to be buoyed in the longer term by strong economic demand and rising costs of production. These factors will be partly offset by increases in supply of natural gas liquids and 'unconventional' oil from oil sands and oil shale. However, many unconventional sources have higher greenhouse emission factors, which raise their marginal cost of extraction in a carbon constrained world.
Global gas prices have fallen recently due to weak demand and substantially increased supply capacity. They are expected to recover in the short term as demand picks up, particularly in a carbon constrained world. In the longer term, gas prices will be less affected by long-term contracts and move more in line with prices in spot markets. This narrows the price gap between oil and gas in the projections.
Chart 4.7: Energy commodity prices
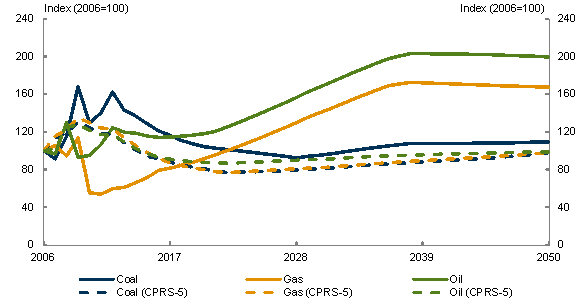
Note: The current projections reflect the medium global action scenario and are based on 2010 Australian dollars.
Source: Treasury estimates from MMRF.
4.4 Trends at the sectoral level
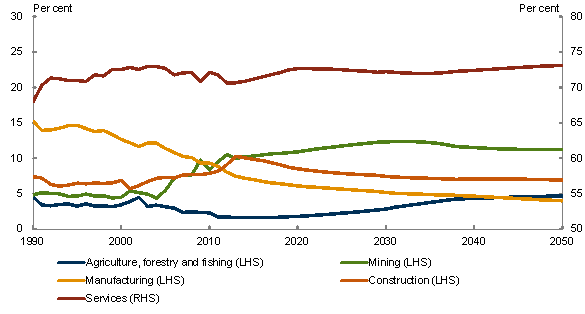
Australia's economy is expected to continue its long-term trend towards services and relative decline of manufacturing. Sustained higher terms of trade, driven by Asia's urbanisation and industrialisation, will heavily influence this trend. Stronger demand for Australia's energy and mineral resources remain supportive of commodity prices and continued strength in mining returns draws capital and labour from the rest of the economy. Sustained elevation of the real exchange rate shifts domestic demand towards imports and reduces the competitiveness of exports and import-competing activities, accelerating the decline of manufacturing.
Other supply and demand side factors drive sectoral trends.
On the supply side, near-term rates of productivity growth are based on historical patterns for each industry. For instance, productivity growth in the communications industry is projected to be almost twice the economy-wide average, while productivity growth in other services sectors, such as public administration, is expected to be below average. Over time, industry productivity growth rates converge, reflecting uncertainty about the persistence of historical differences over long timeframes.
On the demand side, consumers continue to adopt new technologies, reshaping the economy. For example, ongoing improvements in information and communication technology, including the National Broadband Network, will considerably change how Australia does business, improve services in education and health, and offer potential to improve productivity.
Australia's services sector, which is currently around two thirds of the economy, expands to meet growing domestic demand and demand from the increasingly rich middle classes in Asia. The services sector, which includes education, tourism, business services, utilities, transport, and retail and wholesale trade, accounts for most of production and employment, and continues to grow slightly faster than the rest of the economy. Under the medium global action scenario, services sector output increases by about 38 per cent between now and 2020, and employment increases more than 16 per cent.
Chart 4.8: Nominal value added shares
Medium global action scenario
Note: Shares are of total gross value added. MMRF estimates after 2010 are spliced onto historical ABS data.
Source: ABS and Treasury estimates from MMRF.
Mining comprises a small share of employment, but has been making an increasing contribution to output recently because of the high prices for mining commodities, particularly coal and iron ore. Investment generated by the current elevated level of commodity prices leads to continuing strong output growth to 2020, as new supply comes on line. As the terms of trade fall from current high levels, growth moderates from 2020 to 2050. Mining output is expected to increase by around 75 per cent by 2020, with employment increasing around 16 per cent.
Higher commodity prices draw capital and labour to the mining sector, where the rate of return is higher. Very strong commodity prices have put upward pressure on the exchange rate, reducing the competitiveness of other trade-exposed industries not benefiting from higher commodity prices, such as manufacturing. Over time, prices fall as more supply comes on line, and the exchange rate falls, assisting those other industries.
Agriculture has higher average productivity growth relative to mining and manufacturing, although the fixed amount of agricultural land limits expansion in production. This supply-side constraint coupled with strong world demand result in increased world agricultural prices over time, raising agriculture's share of total value added. Agricultural output increases by 11 per cent by 2020, with employment increasing by 9 per cent.
Manufacturing is one sector from which resources are drawn towards the higher rates of return in the mining sector. The high real exchange rate and competition from relatively inexpensive Asian manufactures put more pressure on manufacturing.
Despite this, manufacturing output continues to grow over the next decade, albeit at a slow rate. Manufacturing subsectors related to mining and construction perform more strongly than others. Some parts of the manufacturing sector experience absolute falls in output. Continued productivity growth and weak demand growth lead to manufacturing employment falling by 16 per cent by 2020. As the terms of trade decline and the exchange rate falls, pressure on manufacturing eases.
Construction output grows strongly, by 52 per cent by 2020 and with employment increasing by 24 per cent, as the mining boom draws heavily on it. Engineering construction, led by large projects in the LNG, iron ore and coal sectors, continues to increase strongly. In line with mining activity, construction growth moderates over 2020 to 2050, relative to the 2010s, as supply outstrips demand and falling commodity prices flow through to economic activities.
4.4.1 Goods processing industries
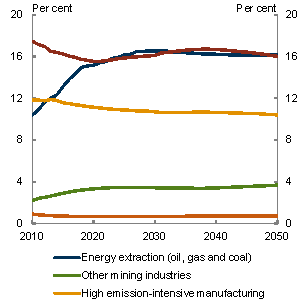
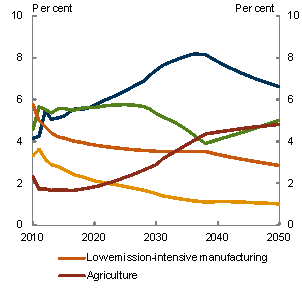
The goods processing sectors include energy extraction (oil, gas and coal), other mining, high emission-intensive manufacturing, low emission-intensive manufacturing and agriculture. They produce around 43 per cent of emissions and around 20 per cent of value added output. Under the medium global action scenario, their share of output falls over the next decade, continuing the long-term trend towards a more services-oriented Australian economy. Their share of total emissions is expected to continue to increase up to the middle of the 2030s. In particular, the energy extraction sector grows strongly in the next decade and its share of emissions increases in step with output, due to expansion of both coal mining and gas, particularly for export as LNG.
Chart 4.9: Goods processing industries
Medium global action scenario
Emission shares
Value added shares
Source: Treasury estimates from MMRF.
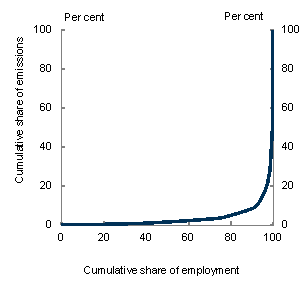
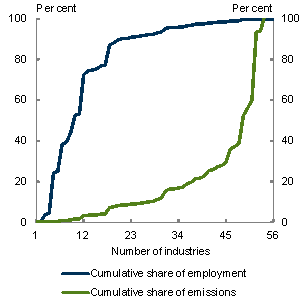
It is important to note that the distribution of emissions does not match the distribution of jobs in the economy. Emissions are concentrated in relatively few industries. Indeed, industries that employ more than 90 per cent of the workforce account for less than 10 per cent of emissions. The charts below show employment shares plotted against emission shares in two different ways, with industries ordered in terms of increasing emission intensity.
This means that the majority of the economy will be largely unaffected by structural changes that flow from carbon pricing.
Chart 4.10: Cumulative shares of emissions and employment, by industry — 2009-10
Medium global action scenario
Source: Treasury estimates from MMRF.
4.4.2 Electricity generation sector
Electricity generation accounts for around a third of Australia's current emissions. In 2010-11, around 70 per cent Australia's electricity generation comes from coal, and a further 20 per cent from gas fired power plants. Coal fired power plants account for almost 90 per cent of electricity sector emissions, and around 30 per cent of Australia's total emissions.
Given the importance of the electricity sector, Treasury engaged two consultants to provide electricity sector modelling (SKM MMA, part of the Sinclair Knight Merz Group) and ROAM Consulting). The two sets of results in this section outline different electricity sector projections. Both sets of results are plausible outcomes within the reasonable bounds of uncertainty.
Electricity demand
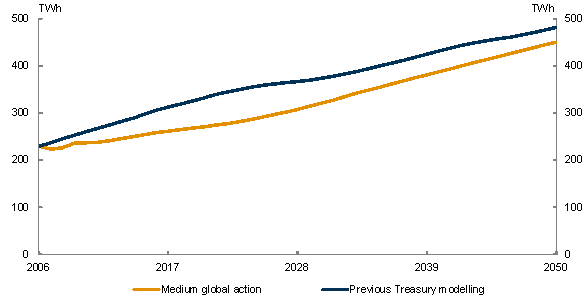
In the global action scenarios, energy demand is projected to almost double by 2050, driven by population and economic growth.
Chart 4.11: Electricity generation (sent out)
Source: Treasury estimates from MMRF, SKM MMA and ROAM.
Differences in the electricity demand profiles between the ambitious global action scenarios and the medium global action scenarios are only marginal as a result of offsetting global demand factors. In the ambitious global action scenario, global output growth is slightly slower, and so demand for some Australian exports slows. Offsetting this, mitigation action taken by the rest of the world creates additional demand for electricity-intensive Australian products and output in these industries grows slightly faster.
Short-term projections for electricity demand in the global action scenarios are lower than in previous Treasury climate change mitigation modelling, reflecting different demand growth outcomes and stronger improvements in energy efficiency. Beyond 2020, growth in electricity demand is stronger, largely reflecting stronger population growth.
Demand growth differs among the states due to the electricity intensity of their industry structure. In particular, stronger economic growth in Western Australia and Queensland results in faster growth in electricity demand than the national average. In contrast, demand growth in Tasmania and South Australia is modest.
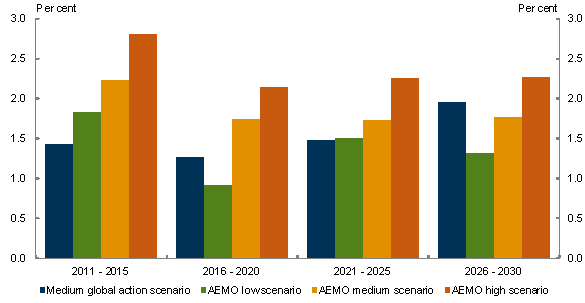
Growth in electricity generation is at the lower end of the range previously published by the Australia Energy Market Operator (KPMG Econtech, 2010). Key differences relate to different views about improvements in energy efficiency and higher electricity prices.
Chart 4.12: Average annual growth in generation
Comparison with AEMO projections
Source: Treasury estimates from MMRF; and AEMO.
Transformation of the electricity generation sector
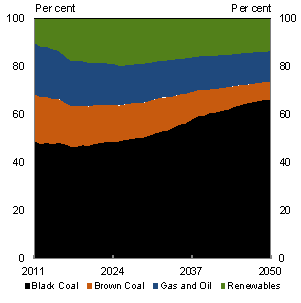
Growth in electricity demand to 2020 is mostly satisfied by an increase in renewable generation, driven by the large-scale renewable energy target (LRET). Without a carbon price, total renewable generation reaches around 15 to 20 per cent of total generation by 2020. This includes renewable generation driven by the small-scale renewable energy scheme (SRES).
The Government's 20 per cent renewable target is not met in ROAM modelling. This is because, without a carbon price, the higher relative cost of renewable generation drives electricity retailers to pay the penalty price of the LRET. This limits investment in additional renewable generation.
After 2020, growth in generation from new coal-fired power plants largely satisfies growth in demand. Notwithstanding the introduction of emission standards for new generators, stronger improvements in the technological efficiency of brown coal assumed in the ROAM modelling results in brown coal forming a growing share of the generation fleet after 2030.
Chart 4.13: Generation fuel mix
Medium global action scenario
SKM MMA
Source: SKM MMA; and ROAM.
ROAM
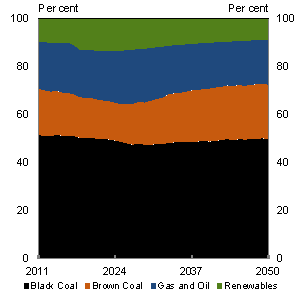
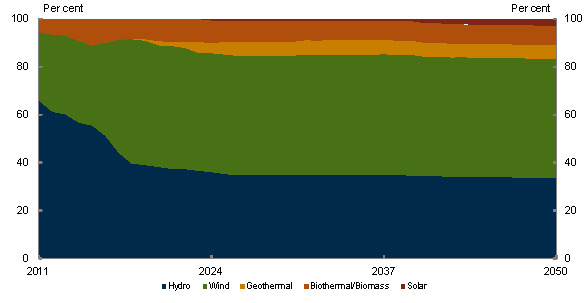
Hydroelectric generation grows only marginally, as most of Australia's hydroelectric potential is already exploited. Other renewables, particularly wind, increase their share of generation initially in response to incentives created under the LRET scheme. However, without new policies, renewables comprise a declining share from the late 2020s owing to the cost advantage of fossil fuel technology.
Chart 4.14: Renewable technology generation
Medium global action scenario
Source: SKM MMA; and ROAM.
Gas-fired generation capacity grows by around 10 percentage points to around 35 per cent by 2050. Part of this increase reflects the role of peaking gas generation as a back-up for wind baseload generation. However, the use of gas for baseload generation is partly constrained by rising east coast gas prices, which reduces its competitiveness.
New investment
Around $20 billion of investment in new generation capacity is projected over the next ten years, growing to $100 billion to 2050. This includes between $13 billion and $29 billion in renewables, $23 billion in gas and $55 billion in coal generation.
Electricity generation emissions
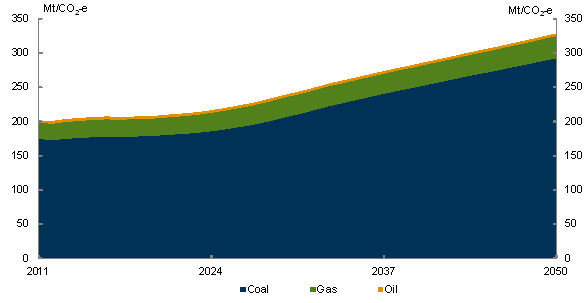
Annual electricity emissions rise by over 60 per cent by 2050. The emission intensity of electricity generation improves by nearly 14 per cent by 2050 due to technical efficiency improvements, investment in renewable technology to meet the LRET and the Cleaner Future for Power Stations commitment.
Chart 4.15: Emissions by energy source
Medium global action scenario
Source: Treasury estimates from MMRF.
Wholesale electricity prices
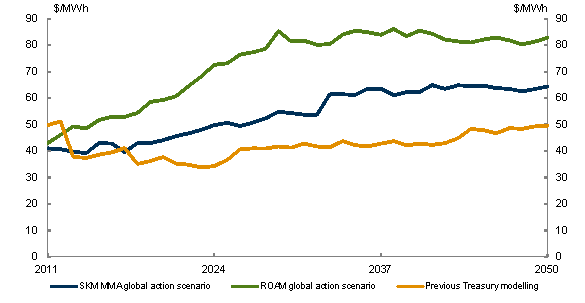
Wholesale electricity prices are projected to be higher, even without a carbon price. Prices grow relatively strongly to 2030, mainly driven by rising gas prices and higher capital costs for new electricity generation plants that enter the market to meet growing demand. Wholesale prices are also higher than previously modelled.
While both SKM MMA and ROAM project rising wholesale prices, the extent of these increases differs. This is largely driven by different views of the costs for new electricity generation plant. ROAM generally assumes higher costs for new coal-fired capacity than SKM MMA, and this flows through to higher wholesale prices.
Climate change policy uncertainty is also likely to have a negative impact on the economy. However, quantifying these effects is itself subject to uncertainty. The modelling includes some of the short-term effects of policy uncertainty, to the extent that these have impacted on near-term investment plans. However, over time, continued uncertainty is likely to place far greater upward pressure on electricity prices than is incorporated into the modelled global action scenarios. For example, previous studies have estimated that continued uncertainty could raise wholesale electricity prices by between $1 and $7 per MWh by 2020.3 The longer that uncertainty prevails, the higher the costs of uncertainty.
Chart 4.16: Wholesale electricity prices
Note: Prices in 2010 dollars.
Source: SKM MMA, ROAM and previous Treasury modelling. Average of medium and ambitious global action scenarios.
Household electricity prices
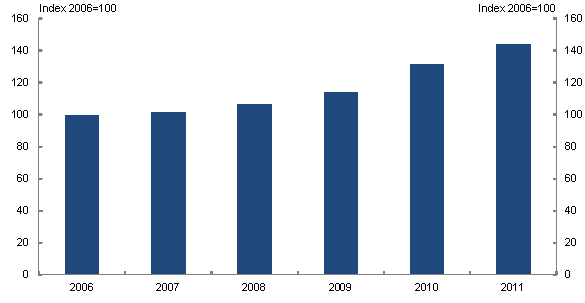
Over the past five years, real household electricity prices have risen by over 40 per cent.
Chart 4.17: Growth in real household electricity prices
Note: Data is four quarters to June except 2011 which is three quarters to end-March.
Source: ABS, 2011a.
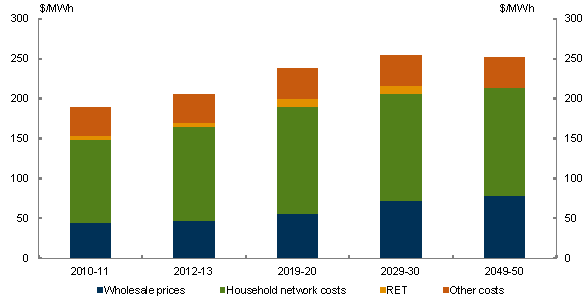
Household electricity prices are projected to increase by a further 16 per cent over the next five years, partly from higher wholesale prices but also from rising network charges. The costs from the Renewable Energy Target will remain a small proportion of overall electricity costs but are expected to grow as the target increases.
Chart 4.18: Household electricity prices
Medium global action scenario
Note: Prices in 2010 dollars.
Source: Average of SKM MMA and ROAM.
4.4.3 Transport
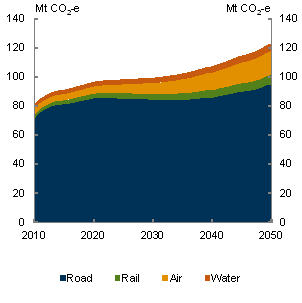
Transport is important to a large country like Australia. In 2010, transport accounted for around 14 per cent of all emissions. The transport sector comprises road, rail freight, rail passenger, air and water transport.
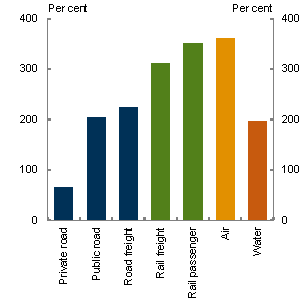
Activity in air, rail freight and rail passenger transport is projected to increase more than four-fold to 2050, driven by growing incomes and economic activity. Rising oil prices are also expected to drive some substitution from road to rail.
Road transport activity will continue to grow as the economy expands. From 2010 to 2050, vehicle travel is expected to treble. Private transport activity grows broadly in line with population growth. Road freight transport grows faster than aggregate economic activity, reflecting the importance of road freight to the mining sector.
Chart 4.19: Transport activity and emissions
Medium global action scenario
Increase in activity
2010 to 2050
Emissions
Source: Treasury estimates from MMRF and CSIRO.
Road transport4
Road transport is the largest transport sector, accounting for over 85 per cent of total transport emissions.5
Even without a carbon price, substantial changes are projected in the road transport sector. High and rising oil prices combined with government transport policies are expected to move motorists and businesses into more fuel efficient vehicles and alternative transport fuels. This drives fuel efficiency and lowers emission intensity of the transport sector over time, which in turn reduces growth in emissions.
Conventional fuels remain the major transport fuels although alternative fuels grow as a share of fuel used. Over the next decade, diesel becomes the dominant fuel used. Diesel consumption rises as diesel engine technology becomes more cost competitive relative to petrol. There is a shift back to petrol from 2030 onwards due to the increased economic viability of petrol-hybrid vehicles and faster improvements in fuel efficiency. From 2020, biodiesel blends begin to displace conventional diesel, and synthetic diesels are also used over time, although in much smaller quantities than biofuels.6
Chart 4.20: Road transport fuel mix
Medium global action scenario
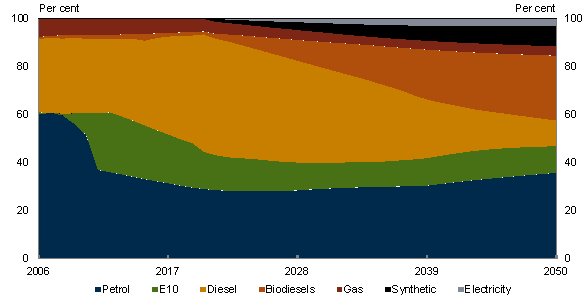
Note: Bio-diesels are B20, pure biodiesel and biomass-to-liquid. Synthetic diesels are coal-to-liquid and gas-to-liquid.
Source: CSIRO.
The early reduction in conventional petrol use is a result of E10 adoption, driven by the NSW Biofuels Act.
Limited technological change in the existing vehicle fleet occurs in the near term. This reflects the rate of turnover of vehicles in the fleet, which creates a lag between the availability and uptake of new transport technologies.
From 2020, hybrid vehicle uptake is rapid, becoming the dominant transport choice from 2035. In 2050, hybrid vehicles account for over half of road travel. There is also some limited uptake of electric and plug-in hybrid vehicles (3 per cent and 4 per cent respectively) by 2050.
The fuel efficiency benefits of smaller passenger and light commercial vehicles mean that these vehicles form a greater share of their respective markets over time.
Chart 4.21: Road transport technology mix
Medium global action scenario
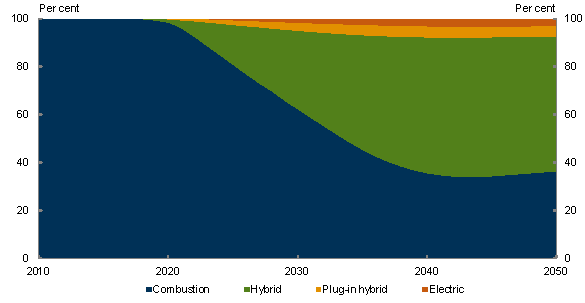
Source: CSIRO.
4.4.4 Land sector and legacy waste
Aggregate emissions from the land sector (agriculture, land use change, forestry) and legacy waste are expected to grow over the projection period, primarily driven by strong growth in agricultural output.
Emissions from agriculture are projected to grow by around 65 per cent between 2012-13 and 2050 in the global action scenarios. Output of livestock and cropping, and hence emissions, is driven by export demand.
Sequestration from forestry plantations is expected to decline in the medium global action scenario as the current stock of trees mature and harvesting starts.
Emissions from legacy waste decrease over time as this waste decomposes.
Land use change emissions are driven by deforestation. Baseline land clearing rates are generally assumed to continue at the same level as occurred on average between 2001 and 2006 for all states.7 The exceptions are Queensland and New South Wales, where land clearing reforms reduce deforestation.
Table 4.2: Emissions from land and legacy waste
(MtCO2-e per year)

Source: Treasury estimates from MMRF, ABARES and DCCEE.
Carbon Farming Initiative
The Carbon Farming Initiative (CFI) helps to lower domestic emissions. However, without a domestic carbon pricing mechanism, this does not contribute to meeting Australia's abatement challenge. Without a domestic carbon pricing mechanism in place, credits created under the CFI would be either sold to foreign purchasers or used in the domestic voluntary market (for example, by firms seeking to be carbon neutral). If CFI credits are exported, then the purchasing country is entitled to count the abatement, not Australia. If CFI credits are used and cancelled in the voluntary market, the Government has committed that this abatement would be in addition to meeting our targets.
In both the global action and policy scenarios, abatement in the land and legacy waste sectors is largely driven by the CFI. The CFI provides an incentive for abatement from livestock, crops, savannah fire management, legacy waste, avoided deforestation and managed regrowth, and carbon plantations that satisfy the CFI criteria. Amongst other things, the CFI requires that abatement be additional and permanent.
The CFI enables the sectors listed to generate abatement credits which can be sold internationally. The modelling assumes that CFI credits are sold at the prevailing world carbon price and this price determines the level of abatement in the global action scenarios. As a result, there is greater abatement from the CFI in the ambitious global action scenario than in the medium global action scenario.
Aside from indirect impacts (abatement driven by rising electricity and fuel prices), no additional abatement is modelled in the domestic policy scenarios from these sectors as they are assumed to be excluded from the carbon pricing mechanism.
Agricultural abatement
Although agricultural sector emissions grow substantially, the level of abatement remains modest to 2050, even with the higher carbon prices of the ambitious global action scenario. It is assumed that non-price barriers to the uptake of abatement opportunities reduce abatement, such as technology and information constraints. Additionally, the cost of an additional unit of abatement from agriculture rises with increases in abatement, as cheaper forms of abatement are exhausted. Hence, the carbon prices in the ambitious global action scenario, which are around double those in the medium global action scenario, result in an increase in abatement of just over 25 per cent.
Forestry and land use change abatement
Reforestation activities covered by the CFI are projected to cumulatively sequester around over 860 Mt CO2-e by 2050 in the ambitious global action scenario, significantly higher than the 72 Mt CO2-e in the medium global action scenario.
The variation in area of reforestation between the medium and ambitious global action scenario is driven by a 'tipping point' carbon price at which specific areas of land become economically viable. The decision to invest in plantings takes into account the value of other possible uses of the land and that the CFI requires land to be 'locked up' for 100 years as part of the permanence requirement.
Given the world carbon prices projected in the medium global action scenario carbon prices, only a very limited area of planting is economically viable. The higher carbon prices in the ambitious global action scenario drive a much larger plantation area and, consequently, sequestration increases significantly. With the higher carbon price, 80,000 hectares of additional plantations are added each year on average over the first ten years, and to 2050 the area of plantations increases by 130,000 hectares per year on average.
The forestry abatement estimates are lower than the previous modelling estimates as they now incorporate a broader range of factors such as water interception and pricing, estimation of Kyoto compliant land, environmental restrictions and the risk of reversal buffer under the CFI policy.
Avoided deforestation and managed regrowth provide a significant share of the abatement from the CFI. Abatement from these land use change activities is constrained by permanence requirements and strong growth in agricultural commodity prices which results in rising opportunity costs of avoided deforestation.
Legacy waste
Despite the high uptake of abatement opportunities in the legacy waste sector, abatement falls over time as the stock of legacy waste declines. Proportionally, uptake is in fact high in the legacy waste sector. In the medium global action scenario, nearly half of baseline legacy waste emissions are captured by 2050, and this rises to two thirds in the ambitious global action scenario.
Table 4.3: Abatement from the CFI
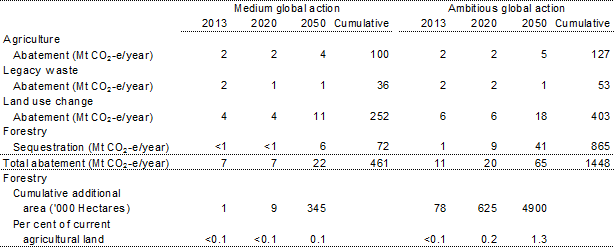
Source: ABARES; and DCCEE.
Chart 4.22: Cumulative abatement from the CFI
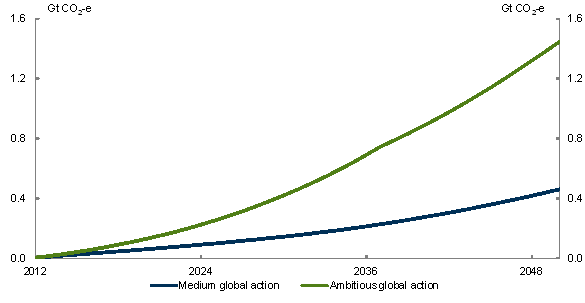
Source: ABARES; and DCCEE.
4.5 State analysis
Differences in economic growth across the states and territories are largely due to industrial structures and population growth rates. These reflect the impact of the mining boom with resources continuing to shift to more resource intensive states.
South Australia and Tasmania experience slower average growth in gross state product (GSP), largely reflecting slower population growth. Queensland, Western Australia and the Northern Territory have rising shares of the national population, while New South Wales, South Australia, Tasmania and the Australian Capital Territory have falling national shares. The population share for Victoria remains relatively stable.
Table 4.4: Gross state product
Annual average growth rates — medium global action scenario

Source: Treasury estimates from MMRF
4.6 Households
Overall, households spend most of their budget on housing, food and recreation. Direct energy consumption represents around 7 per cent of the household budget, comprising transport, electricity, gas and household fuels. Households also consume energy indirectly, through use of public transport and energy embodied in the manufacture, transport and disposal of goods and services over their lifecycle.
Chart 4.23: Aggregate household spending, 2012-13
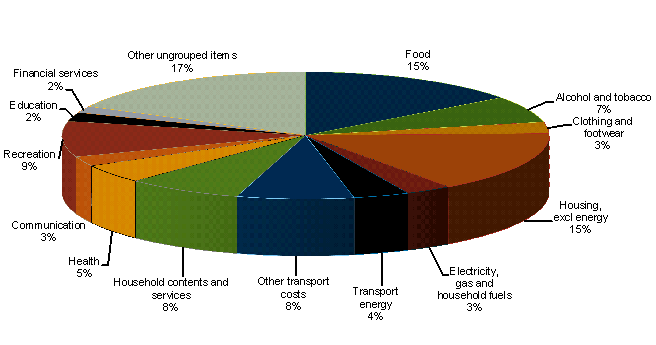
Note: Spending shares are based on aggregate spending for all households included in the Household Expenditure Survey sample. Figures may not add to 100 per cent due to rounding.
Source: Treasury.
Income, household composition and location affect household spending patterns. Spending shares on energy have increased since previous modelling as stationary energy prices have risen more than other prices.
4.6.2 Distributional analysis
Low income household spending on stationary energy is proportionately higher than for middle and higher income households. Low income households in the first quintile spend around 9 per cent of their total budget on energy, and 6 per cent on stationary energy.
Chart 4.24: Median spending on energy as a percentage of all spending
By equivalised disposable income quintile in 2012-13
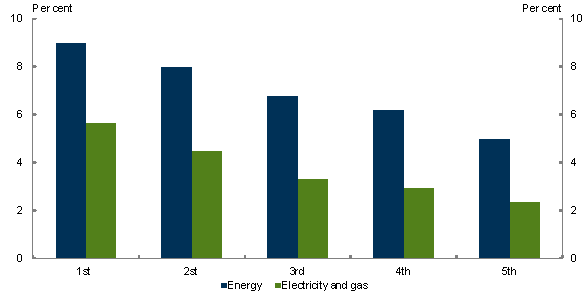
Source: Treasury.
The proportion of spending on energy varies markedly with household size, partly due to economies of scale and government transfer payments supplementing the incomes of families with children. Households with two people appear to spend a similar proportion of their total budget on energy as households with one person. In contrast, spending on stationary energy is a higher proportion of the household budget for single-person households.
Chart 4.25: Median spending on energy as a percentage of all spending
By household size 2012-13
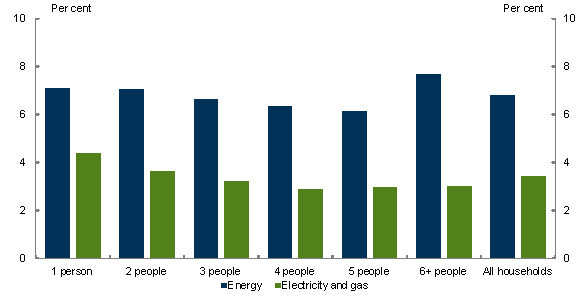
Note: The picture for households with six or more people appears to differ from the trend for smaller households. However, conclusions about their spending patterns are limited due to their small sample size in the Household Expenditure Survey.
Source: Treasury.
Low income households receiving government transfers as their principal source of income spend a higher proportion of their budget on energy than other households (particularly on stationary energy). These households include a high proportion of single and couple pensioners, and the majority of couple allowees with and without children, and single allowees and Parenting Payment Single recipients.
Table 4.5: Median spending on energy as a percentage of all spending

Note: * indicates that the sample size is too small to derive reliable estimates.
Source: Treasury.
1 All years in this publication are Australian financial years, ending 30 June of the year quoted.
2 Current scientific advice is that rising global emissions would eventually result in catastrophic changes to the world's environment. The analysis presented here does not include the economic impacts of a rise in global emissions. As such the modelling provides information on only one element necessary for evaluating climate change policy: the costs of taking action. To form policy judgements, this modelling analysis needs to be combined with a detailed analysis of the economic and social impacts of climate change itself and the benefits of reducing global emissions, analysis that has been provided elsewhere.
3 See for example Deloitte, 2011 and Nelson et al, 2011.
4 The medium global action and ambitious global action scenarios are very similar. For simplicity, results are presented for the medium global action scenario.
5 Only direct emissions from fuel use are attributed to the transport sector. Emissions from the production of fuels are included in the direct emissions of other sectors (for example, the refinery or electricity generation sectors).
6 CO2 emissions from the combustion of biofuels are not counted in the National Greenhouse Gas Accounts as these emissions are equivalent to the carbon sequestered through growth of feed stocks.
7 Abstracting from the impacts of the Carbon Farming Initiative.