Kerrie Bremner1
A net tax threshold (NTT) is the maximum amount of private income a family or person can have before their income tax liability exceeds their government cash benefits entitlement. This study compares NTTs and disposable incomes for different family types for the 1996-97 and 2006-07 financial years and discusses changes to the tax and cash transfer systems that have impacted on the 2006-07 outcomes. Also examined is the distribution of Australian families who are above or below their net tax threshold with analysis by family type, number of children, and State; a comparison is made between 1996-97 and 2005-06.
Introduction
Governments are often criticised for not giving large tax cuts to low-income earners. However, many low-income earners pay very little tax, if any at all, and would not be able to benefit from tax cuts. For this reason, an increase to family payments or benefits is often a more effective vehicle to target assistance to low-income earners than the tax system. In 2005-06 an estimated 38 percent of Australian families will receive more money in benefits from the Australian Government than they will pay in income taxes.
The Australian system of cash benefits and family payments is tightly targeted and aims to provide assistance to those in need whilst keeping the cost affordable. Therefore most government payments are income and asset tested. The personal income tax system is progressive and includes many tax offsets. Also included in the tax system is the Medicare levy.
A net tax threshold (NTT) is the private income at which income tax liability first exceeds cash benefit entitlements. NTTs provide a useful measure of the interaction between cash transfers and income tax. During the period of this study there have been many changes in the government programmes that determine NTTs. These have included:
- increases in the value of family payments;
- reductions in marginal rates of income tax;
- increases in income tax thresholds;
- liberalisation of income tests for family payments, pensions, and allowances; and
- the introduction of, and increases in, the value of several tax offsets.
Some of the policy reforms that have implemented these changes include: The New Tax System (TNTS) in 2000, the More Help for Families package announced in the 2004-05 Budget, the Extra Assistance for Families package announced in the lead-up to the 2004 Election, and the Welfare to Work package announced in the 2005-06 Budget, together with cuts to personal income tax.
Since 1996-97, real earnings have grown and unemployment has declined. Recent analysis by the National Centre for Social and Economic Modelling shows that, between 1997-98 and 2004-05, the real disposable incomes of low-income families will have grown by an average of $87 per week (McNamara, Lloyd, Toohey and Harding 2004). Household income distribution statistics published by the Australian Bureau of Statistics (2005) show that the real equivalent disposable income of low-income families improved by 9 percent between 2002-03 and 2003-04, largely because of changes in family payments.
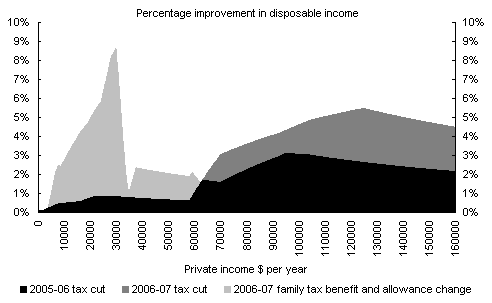
Changes in pensions and allowances can also improve living standards for low-income families. Chart 1 depicts the percentage gains in disposable income a single-income couple with two children aged 3 and 8 would make in 2006-07 as a result of the changes announced in the 2005-06 Budget. At the lower incomes it is the enhancement to Newstart Allowance, not tax cuts, which gives the family the biggest gains in disposable income and provides incentive to work.
Chart 1: Effects of 2005-06 Budget on the disposable income
of a single-income couple
Background on net tax thresholds
Definition
A family’s NTT is the amount of private income they can have before income tax paid exceeds cash benefits received from the Australian Government. In this study NTTs have been calculated on a family basis rather than for the individual.
The family has been chosen as the unit of analysis because the calculation of NTTs for partnered individuals is problematic. Typically government cash transfers received by couples have income tests that take into account the incomes of both partners. This means that for a partnered person the NTT will depend on the level of their partner’s income. The situation becomes even more difficult when family payments are involved, as a decision would need to be made as to who is the recipient of the payments for the purposes of calculating individual NTTs.
NTTs differ for different family types because of the different entitlements that are targeted at people in different circumstances. For example, the amount of Family Tax Benefit Part A a family is entitled to is determined by the number of dependants and their ages. The tax system also contains elements where different people are treated differently, for example the Senior Australians Tax Offset is available only to people of a certain age. Even two families who look the same in structure, for example same age and number of children, can have different NTTs as a result of different income splits between the income recipients. Therefore a decision has to be made about the split of income for partnered couples when calculating NTTs.
Methodology
The STINMOD Model
Due to the complexity of both the cash benefits system and the tax system it is easier and more reliable to utilise a micro simulation model to calculate NTTs. The model used in this study for both the hypothetical scenarios and the distributional study was a Treasury-modified version of STINMOD (designated STINMOD* in this paper).
STINMOD* is a static micro simulation model which was developed by the National Centre for Social and Economic Modelling (NATSEM). The model is a computer program which replicates the rules of government expenditure and revenue programmes. These rules can then be applied to single hypothetical families or to population samples which contain sufficient demographic data, including labour force status, age, housing and financial detail about individuals and families. The population samples used for this study are based on ABS Surveys of Income and Housing Costs. The survey datasets need to be brought forward in time to represent the current year or a year in the near future. So the surveys have been reweighted, incomes uprated, and variables adjusted and imputed as necessary to fit the requirements of the model and to represent the selected time period (see Bremner et al, 2002).
Only Commonwealth cash benefits and the personal income tax system are taken into account in this study. Because of data constraints, and modelling difficulties, State benefits and State taxes, including the GST, are not modelled. Programmes modelled include Family and Community Services (FaCS) pensions and allowances, family payments, Rent Assistance, Pharmaceutical Allowance, Department of Veterans’ Affairs (DVA) payments, personal income tax, tax offsets including the Mature Age Worker Tax Offset, and the Medicare levy.
Because of the complexity of some government programmes and the limited information provided on survey files, not all elements of Australian Government programmes are modelled in STINMOD*. For example Remote Area Allowance, Abstudy, Double Orphan Pension, Bereavement Allowance, and Mobility Allowance are not modelled. Child Care Benefit and Higher Education Contribution Scheme policy rules are programmed into STINMOD* and can be used for hypothetical scenarios but, because of limited information on the survey data, are not included in the distributional analysis undertaken
for this study. Although many government payments have assets tests, only income tests are modelled, once again because of insufficient detail in the survey data.
Hypothetical cameos
Cameos
A hypothetical cameo is not based on survey data—its characteristics are made up by the researcher to examine the theoretical impacts of policy settings.
Twenty different hypothetical families were examined, with their disposable income and NTT calculated for both 1996-97 and 2006-07. The cameos chosen included both young and old, singles and couples with and without children. Families with children have two, one aged 3 years and the other 8 years. Various income splits were selected for the couple scenarios, with private incomes being specified as a percentage of AWOTE (average weekly ordinary time earnings for full-time employees). Three different senior single cameos were modelled, one with zero private income, one with wage income, and one with investment income. A senior Australian with income from wages is entitled to the Mature Age Worker Tax Offset in the 2006-07 year.
Table 1: Hypothetical families modelled
|
As percentage of AWOTE
|
||||
|
Description
|
Children
|
Income of head
|
Spouse’s income
|
Income split
|
| Single person |
|
67%
|
|
100
|
| Single person |
|
100%
|
|
100
|
| Single person |
|
167%
|
|
100
|
| Sole parent |
2
|
0%
|
|
100
|
| Sole parent |
2
|
67%
|
|
100
|
| Couple |
|
133%
|
0%
|
100:0
|
| Couple |
|
167%
|
0%
|
100:0
|
| Couple |
|
100%
|
33%
|
75:25
|
| Couple |
|
100%
|
67%
|
60:40
|
| Couple |
2
|
100%
|
0%
|
100:0
|
| Couple |
2
|
133%
|
0%
|
100:0
|
| Couple |
2
|
167%
|
0%
|
100:0
|
| Couple |
2
|
100%
|
33%
|
75:25
|
| Couple |
2
|
100%
|
67%
|
60:40
|
| Couple |
2
|
167%
|
100%
|
62.5:37.5
|
| Senior single |
|
0%
|
|
100
|
| Senior single |
|
33% (wages)
|
|
100
|
| Senior single |
|
33% (investment)
|
|
100
|
| Senior couple |
|
33% (investment)
|
33% (investment)
|
50:50
|
| Pensioner couple |
|
0%
|
0%
|
50:50
|
Calculation
The details of the hypothetical families are run through STINMOD* in order to calculate their disposable incomes. Both a 1996-97 policy and a 2006-07 policy version of STINMOD* were used in the study, with the parameters being financial year averages. The parameters and AWOTE used for 2006-07 were forecast. The policy changes announced in the 2005-06 Budget were included in the 2006-07 version of STINMOD*.
The calculation of a family’s NTT is an incremental process. Income was increased by a dollar at a time, in accordance with the family’s income split in the case of couples, and then the family was run through STINMOD*. This continued until the family’s government cash benefits were equal to their tax paid. For example a couple with a 75:25income split would have an extra 75cents added to the head’s income and 25cents added to the spouse’s income for each run of STINMOD* until the NTT was reached.
After the disposable income and NTT calculations were made all dollar amounts were then expressed in 2005-06 dollars.
Results
The real disposable incomes of the families modelled have all risen since 1996-97. The increase in the real NTTs has been even more substantial for many of the families.
Table 2: Real disposable income for hypothetical families, 1996-97 and 2006-07

Table 3: Real net tax thresholds for hypothetical families, 1996-97 and 2006-07
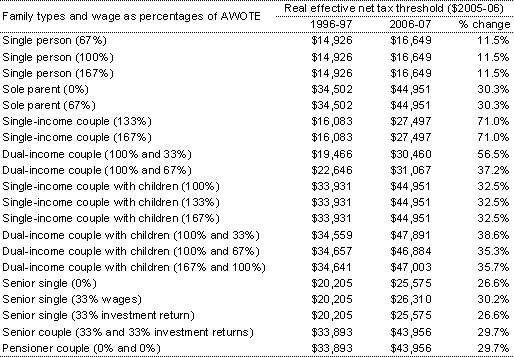
The single-income couple families with children have enjoyed the greatest increases in disposable income with each having an increase of over 28 percent. In 2006-07, the dual-income couple cameos modelled still have slightly higher disposable incomes than the single-income couples with the same total private income: $61,286 and $73,195 as opposed to $59,815 and $69,941 respectively.
As shown in Table 3, the sole parent and single-income couples with children cameos show a real NTT of $44,951 in 2006-07, an increase of 30.3 percent for sole parents and 32.5 percent for single-income families. Current tax and family assistance policy treats sole parents and single-income families alike, which is reflected in their 2006-07 NTTs.
Single-income couples with no children have had a 71 percent increase in their real NTT since 1996-97, with dual-income couples also fairing well. Both single and couple seniors have also had substantial increases in both their disposable income and NTT.
The substantial reforms to the family payments system in recent years are reflected in the families with children cameos, which all show significant increases in both their disposable incomes and NTTs. Policy changes which have contributed to the increases achieved by seniors include the introduction of the Senior Australians Tax Offset (SATO), increased pensions under The New Tax System, and the Mature Aged Worker Tax Offset. Senior Australians who are eligible for SATO will now pay no tax on annual incomes of up to $21,968 for singles and up to $36,494 for couples. These amounts could be higher again if they are eligible for the Mature Age Worker Tax Offset. Also contributing to the increases in disposable incomes and NTTs are the tax cuts over this period.
Distributional analysis
Population
In the above analysis NTTs were calculated for some representative hypothetical family types. Distributional analysis of NTTs is undertaken by applying the NTT concept to representative samples of Australian families for both 1996-97 and 2005-06. Modified unit record data from ABS Surveys of Income and Housing Costs are used by STINMOD* to represent the Australian population for these two financial years. Because of sampling and non-sampling errors in the survey data and assumptions underlying the modifications made to the original data, the population may differ somewhat to the actual.
Calculation
The sample data sets are run through STINMOD* and government benefits receivable and income tax payable are calculated for each of the families in the data. Each family’s position in relation to their NTT is then determined by subtracting income tax and dividend imputation credits from cash benefits received. If a family receives more government cash benefits than they pay in tax then they are said to be in a positive net tax position, otherwise they will be in a negative net tax position. The negative net tax payer families also include those whose government cash benefits are equal to their income tax payable — typically both components of the NTT calculation are zero in the equality case. In 2005-06 there were an estimated 544,400 families (5 percent of all families) who had a net tax gap equal to zero, compared with 454,400 families (also 5 percent of all families) in 1996-97.
Four family types are analysed — couples without dependants, couples with dependants, sole parents and single people. Demographic changes between 1996-97 and 2005-06, such as changes in average family size, can distort the results somewhat.
Results
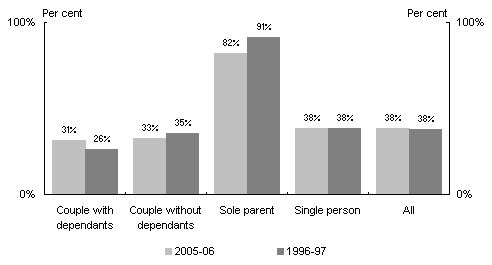
In 2005-06 an estimated 38 percent of families in the population receive more cash benefits than they pay in tax. As shown in Chart 2 the distribution of these families is not equally dispersed between family types, particularly in the case of sole parents where 82 percent receive more cash benefits than they pay in tax.
In 1996-97, there were also 38 percent of families who received more in benefits than they paid in tax; however the 1996-97 distribution of families with a positive net tax gap differed somewhat to that in 2005-06. In 1996-97 a higher proportion of sole parents had positive net tax gaps, 91 percent compared with 82 percent in 2005-06. The increase in the proportion of couple families with dependants who are in a positive net tax position is largely the result of increases in family payments.
Chart 2: Proportion of families in a positive net tax position
by family type
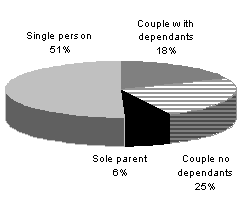
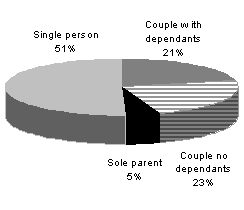
The proportion of different family types in the population differed only slightly between 1996-97 and 2005-06, with a marginal 3 percent decrease in the proportion of couples with dependants and a slight increase in the proportion of sole parents and couples without dependants (Chart 3).
|
Chart 3: Distribution of family types, 2005-06 and 1996-97 |
|
|
Proportion of different family types |
Proportion of different family types |
|
|
|
The proportion of families in the population with a positive net tax gap does not tell us anything about the size of this gap. Although the population percentage of families with a positive net tax gap was the same in 1996-97 and 2005-06, there has been an estimated 11 per cent increase in the average real amount of the net tax gap. Table 4 below shows estimates of the average real positive net tax gap broken down by family type for both 1996-97 and 2005-06. The average amount has increased across all family types.
It is interesting to note that although the proportion of sole parents in the population who have a positive net tax gap has decreased between 1996-97 and 2005-06, the real average dollar amount of the gap has increased by 17 percent. Increased employment by sole parents is the likely cause of the decrease in the proportion of those with positive net tax gaps, with family payment reforms causing an increase in the average net tax gap amount.
The increase in the average gap for single people is largely a result of policy initiatives targeted at senior Australians such as increases to pensions and SATO.
Table 4: Estimated average positive net tax gap for population groups

Tables 5 and 6 contain estimates for 2005-0
6 and 1996-97 of the net tax position of couples with children and sole parents broken down by whether they have two or fewer children aged under 16, or more than two. The results clearly show that families with more than two children are more likely to have a positive gap than those with two or fewer. The proportion of families with a positive gap with three or more children has increased from 39 percent in 1996-97 to 51 percent in 2005-06.
Table 5: Net tax position by number of children, 2005-06

Table 6: Net tax position by number of children, 1996-97

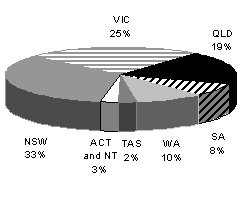
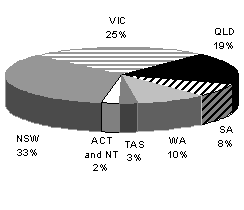
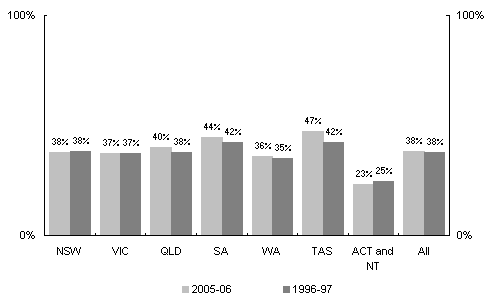
Also of interest is the distribution of families in positive net tax positions by State (Chart 4). Both Tasmania and South Australia have a slightly larger proportion of families with positive gaps compared to the other States and Territories. The ACT and the NT have the lowest proportion. There is no noticeable variation in proportions between 1996-97 and 2005-06 (Chart 5).
Chart 4: Proportion of families in a positive net tax position
by State/Territory
|
Chart 5: Proportion of families in different States and Territories |
|
|
2005-06 |
1996-97 |
|
|
|
Conclusion
The real dollar amount of both NTTs and disposable incomes increased substantially between 1996-97 and 2005-06 for all the cameos modelled in this study. The increases were particularly noticeable for couples with children. This is largely a result of the recent policy emphasis on assisting Australian families with children. The distributional analysis further supported the large impact the family policies have had on families with children, particularly larger families.
References
Australian Bureau of Statistics 2005, ‘Household income and income distribution, Australia, 2003-04’ (Cat. No 6523.0), August.
ACOSS 2004, ‘Analysis of NATSEM Research on low income families’, ACOSS Information Paper, October.
Bremner K, Beer G, Lloyd R and Lambert S 2002, Creating a basefile for STINMOD, Technical Paper No 27, National Centre for Social and Economic Modelling, June.
McNamara J, Lloyd R, Toohey M and Harding A 2004, Prosperity for all? How low income families have fared in the boom times, National Centre for Social and Economic Modelling, October.
1 The author is from Tax Analysis Division, the Australian Treasury. This article has benefited from comments and suggestions provided by Phil Gallagher and Simon Lambert. The views in this article are those of the author and not necessarily those of the Australian Treasury.
