Inquiry into superannuation and standards of living in retirement
Submission by the Commonwealth Treasury
The following article is an abstract taken from a submission made by the Treasury to the Senate Select Committee on Superannuation. The Committee is currently inquiring into superannuation and standards of living in retirement. The terms of reference for the inquiry are broad and cover the adequacy of the tax arrangements for superannuation and related policy to address the retirement income and aged and health care needs of Australians. To date, the Committee has received 89 submissions for consideration and is expected to report by 26 September 2002.
The full version of the submission, including a detailed appendix, can be accessed on the Treasury website at the following address: http://rim.treasury.gov.au.
This submission discusses the key features of Australia's retirement income system, and the policy and institutional context within which it functions. Reflecting Treasury's core portfolio responsibilities, the main focus of the submission is on the implications for retirement incomes of the current superannuation framework and the taxation regime applying to superannuation. The submission discusses the determinants of retirement living standards and issues associated with their measurement, and also presents the results of quantitative analysis of the adequacy of retirement incomes under the combination of the current Superannuation Guarantee and Age Pension arrangements.
Introduction
Treasury's role
In conjunction with the Department of Family and Community Services, the Treasury is responsible for advising the Government on broad retirement incomes policy, with a view to improving the current and future welfare of Australians. Within the context of retirement income policy, the Treasury has direct portfolio responsibility for providing advice on superannuation and taxation policy, including on appropriate taxation policy for superannuation.
Scope of the submission
The terms of reference for the Committee's inquiry are:
The adequacy of the tax arrangements for superannuation and related policy to address the retirement income and aged and health care needs of Australians.
This submission discusses the key features of Australia's retirement income system, and the policy and institutional context within which it functions. Reflecting Treasury's core portfolio responsibilities, the main focus of the submission is on the implications for retirement incomes of the current superannuation framework and the taxation regime applying to superannuation. The submission discusses the determinants of retirement living standards and issues associated with their measurement, and also presents the results of quantitative analysis of the adequacy of retirement incomes under the combination of the current Superannuation Guarantee and Age Pension arrangements. The submission does not endeavour to address specific issues associated with the aged and health care needs of older Australians, these issues falling more directly within the portfolio responsibilities of the Department of Health and Aged Care.
This submission is divided into four chapters. Chapter 1 contains a discussion of the key determinants of retirement living standards and issues around their measurement. Chapter 2 outlines the main features of the policy and institutional context in which the retirement income system functions, including the three pillars policy, the concessional taxation regime applying to superannuation and the broader economic and fiscal policy context. Chapter 3 presents the results of quantitative modelling of the adequacy of retirement incomes under hypothetical cases involving the Superannuation Guarantee and the Age Pension, as well as aggregate (whole of population) modelling of adequacy. Chapter 4 summarises the results of research undertaken by the Treasury highlighting the concessionality of the taxation arrangements applying to superannuation in Australia.
Summary of main points
- A number of determinants will impact on the level of retirement incomes of Australians. Such determinants include compulsory superannuation arrangements, length of time spent in the workforce, the means-tested Age Pension, the ability to accumulate additional private savings (both inside and outside of superannuation), and other factors such as superannuation fund returns and fees and charges. Government policy can affect, directly or indirectly, most of these determinants.
- In this context, Government initiatives such as the Senior Australians Tax Offset, the extension of eligibility for the Commonwealth Seniors Health Card, and legislating to link the Age Pension to 25 per cent of Male Total Average Weekly Earnings will directly benefit the living standards of Australians in retirement.
- At a broad level, the incomes and living standards of Australians, including retirees, will be enhanced by policies aimed at maximising sustainable economic growth along with economic and social participation. As a result, analyses or proposals in the retirement incomes area that do not have regard to this broader context are of limited use in informing policy.
- The adequacy of overall retirement incomes is commonly assessed using a replacement rate concept - that is, the ratio of an individual's income or spending power after retirement to that before retirement. The Government has not set an explicit replacement rate target for Australia's retirement income system. Research by the Association of Superannuation Funds of Australia (ASFA) has indicated that the average net replacement rate from public income maintenance schemes in nine OECD countries is 53 per cent.1
- Analysis undertaken by Treasury's Retirement and Income Modelling (RIM) Unit indicates that current policy will deliver substantially higher replacement rates for senior Australians, as a group, over the longer term. The Superannuation Guarantee (SG) system in conjunction with the Age Pension is projected to provide a spending replacement rate for an individual on median earnings of 72 per cent after 30 years of contributions and 77 per cent after 40 years.2 These replacement rates are conservative in that no allowance is made for superannuation contributions above the SG or for additional private savings outside of superannuation. Replacement rates for women with interrupted careers are also calculated.
- Aggregate projections for the entire Australian population also show average potential replacement rates for all workers rising to 71 per cent by 2050. These projections are based on the full diversity in labour force participation of the population.
- The submission also contains an analysis of the tax concessionality of superannuation which demonstrates that for persons in all tax brackets receiving SG employer contributions only, superannuation is a tax preferred investment over a working lifetime.
Chapter 1: Determinants and measures of living standards in retirement
The level of income which people have available to them in retirement will be a key determinant of their retirement living standard. Most people's income in retirement will be funded from a combination of superannuation assets, other private savings and a full or part-rate Age Pension. In combination with the taxation system, these income sources will endow retirees with a particular level of spending capacity.
Any assessment of the adequacy of retirement incomes therefore needs to have regard, as far as possible, to all of the various income sources available to retirees. At a
minimum, no discussion of adequacy can be considered complete without incorporating the contribution from both superannuation and the Age Pension. However, the living standards and wellbeing of retirees will also be affected by factors outside of the retirement income system. These include tangible factors such as home ownership and the level of public services and government benefits and subsidies, as well as less tangible considerations such as family relationships and social contact.
The ability of Australians to accumulate private retirement savings will be influenced by various factors. These factors include, for example, Government policy in relation to compulsory superannuation, the period of participation in the workforce, the level of remuneration, investment returns on retirement savings (particularly superannuation assets) and the level of fees and charges imposed by superannuation providers.
Labour force experience has a major impact on the ability of individuals to save and hence on their retirement incomes. This experience varies across the community. While some people experience periods of 40 years or more in stable full-time employment, others experience long periods of unemployment or of casual or part-time work. Early retirement has also become increasingly common, although the gradual increase in the superannuation preservation age (applying to people born after 30 June 1960) to age 60 may have an impact on this in the future. Income obviously also varies across the pre-retirement population.
The level of retirement income available will also be affected by earnings achieved on savings balances and by fees and charges incurred in generating these earnings. The costs incurred relate to a wide range of services provided, including fund administration and trustee costs, asset management charges and the provision of financial advice. While different studies report different levels of fees and charges, it is clear that they are significant and can have a sizeable impact on retirement incomes.3 Small differences in investment returns, sustained over the accumulation period, can also have a major impact. Government policy is not to regulate the specific investments that can be made by funds, nor the permissible level of fees and charges. In this context, trustees are obliged by law to prudently manage funds in the interests of members, while the efficiency and competitiveness of the superannuation sector is an important element in minimising fees and charges.
One of the key regulatory tools for ensuring that consumers are in a position to make well-informed decisions is the licensing, conduct and disclosure framework that applies to providers of financial product services and advice. The Government has recently undertaken significant legislative reform to ensure the improved disclosure of fees and charges through the Financial Services Reform (FSR) Act 2001. The FSR Act provides a harmonised disclosure regime that obliges providers of financial services, products or advice to supply consumers with improved and more readily comparable information on the relevant fees, charges and other costs associated with those services or products.
In conjunction with improved consumer disclosure, the Government considers that choice and portability of superannuation will increase competition and provide benefits to fund members. The Government recently reaffirmed its commitment to its choice of funds policy which is designed to increase competition and efficiency in the superannuation sector, leading to increased returns on superannuation savings for members and placing downward pressure on fund administration fees and charges.
The adequacy of retirement incomes is usually assessed using both poverty alleviation and replacement rate concepts. The level of the Age Pension is assessed against an objective benchmark (currently 25 per cent of Male Total Average Weekly Earnings), while overall retirement income, including superannuation, is most often assessed using a replacement rate concept. The replacement rate is defined as the ratio of a person's income or spending power after retirement to before retirement. The basic proposition behind the replacement rate concept is that a person's standard of living in retirement should be a reasonable proportion of their standard of living during their working life.
Treasury's preferred replacement rate measure is based on a comparison of potential net expenditure before and after retirement. The expenditure replacement rate is an after tax measure which takes account of the drawdown of capital during retirement. Replacement rates based on income only do not take account of draw-downs of capital. As a result, these measures understate the contribution of retirement savings to maintaining living standards in retirement.
By taking account of drawdowns of capital, expenditure replacement rates are consistent with the aim of retirement savings policy - that is, to defer some consumption during a person's working life in order to help fund consumption in retirement. In the Australian context, expenditure replacement measures are also able to capture the effects of the income tax concessions (viz the Senior Australians Tax Offset) which apply to people of Age Pension age.
Whether or not a particular expenditure replacement rate is optimal is a matter for judgement. It seems generally accepted, however, that for most persons, a replacement rate of less than 100 per cent will be appropriate. This is because retirees do not face some major expenses, (for example home mortgage costs, the cost of raising children and even the cost of commuting to and from work) which are faced by people of working age. It is also likely that different replacement rates will be optimal for different individuals.
The Government has not set an explicit benchmark replacement rate. Research by Association of Super Funds of Australia (ASFA) has indicated that the average net replacement rate from public income maintenance schemes in nine OECD countries is 53 per cent.4
Any analysis of replacement rates and associated policy should necessarily take account of individuals' needs in both their retirement and pre-retirement years. Proposals designed to increase gross savings in pre-retirement years with the aim of increasing retirement incomes involve trading off higher consumption in retirement for lower consumption while working. This trade off needs to be kept in mind when assessing the merits of such proposals.
Chapter 2: The policy and institutional context
Australia's three-pillared retirement income system is well known. The three pillars comprise the means-tested Age Pension and associated social security arrangements, compulsory employer superannuation contributions through the Superannuation Guarantee (SG), and voluntary private savings including through superannuation. A key policy objective of this system is to enable Australians to achieve a higher standard of living in retirement than would be possible from the publicly funded Age Pension alone. The World Bank has broadly endorsed Australia's general approach to the provision of retirement incomes. The individual elements of the retirement income framework are discussed further below.
The Age Pension
The Age Pension provides a means-tested safety net for individuals who have had limited opportunity or capacity to save for retirement prior to reaching Age Pension age. The Age Pension is available to individuals who have been resident in Australia for at least ten years (at least 5 of these years in one period), and have reached the qualifying age (currently 65 for men and 62 years for women (rising to 65 by 2014)). The maximum fortnightly rate of the Age Pension is currently $421.80 for singles and $352.10 each for couples. The Service Pension provides a
similar income support payment to veterans, and is available five years earlier than the Age Pension.
The rate of the Age Pension is adjusted every March and September in line with movements in the Consumer Price Index (CPI). Additionally, payment rates are indexed in line with wages growth, with the maximum single rate of the Age Pension maintained at (at least) 25 per cent of Male Total Average Weekly Earnings (MTAWE). Pensioners are, therefore protected against price increases, and also share in improvements in living standards, as measured by wages.
The value of the Age Pension in real terms has been boosted in recent years through a number of initiatives, including legislating to link the full rate of pension to 25 per cent of MTAWE. This policy has meant that the value of the Age Pension has grown in real terms by 1.19 per cent per year since 1996 (on average) and is expected to grow by 1 to 1½ per cent a year on average into the future. In addition, as part of the introduction of the new tax system in July 2000, the real value of the pension was increased and the pension income test withdrawal rate reduced (from 50 cents in the dollar to 40 cents in the dollar). The second of these measures, in particular, has made the Age Pension more accessible to partly self-funded retirees, and added to the incentive for individuals to save for their retirement by boosting the returns from such saving at the time of retirement.
Eligibility for the Age Pension also brings with it a number of ancillary benefits. People in receipt of either the Age Pension or Service Pension are entitled to a Pensioner Concession Card (PCC). Those of Age Pension age who do not qualify for either a Service Pension or Age Pension because of assets or income levels may qualify for a Commonwealth Seniors Health Card (CSHC).
The holder of either a PCC or CSHC is entitled to pharmaceutical medication under the Commonwealth's Pharmaceutical Benefits Scheme. This is at the concessional rate of $3.60 per script. State and local governments also use the PCC card as a way of identifying people to whom they offer services at a concessional rate. These concessions are in areas such as transport, utilities, motor vehicle registration, and water and property rates.
The Government has recently widened eligibility for the CSHC. Singles with incomes below $50,000 and couples with incomes below $80,000 are now eligible for the card. Senior Australians who hold the Commonwealth Seniors Health Card have also been extended the same concessions as pensioners on telephone costs. They are entitled to a Telephone Allowance of $18 per quarter. The Commonwealth has also opened negotiations with the States with a view to extending other pensioner concessions to cardholders over time.
Approximately 54 per cent of individuals of Age Pension age currently receive a full rate pension, another 28 per cent receive a part-rate pension, and 18 per cent are not eligible for the Age Pension. By 2050, after the SG system has reached maturity, it is expected that the proportion of people aged 65 and over receiving a full rate pension will fall to around one third, and that the proportion of people not receiving the pension will rise to around 25 per cent. The proportion of people receiving a part-rate pension is expected to increase to around 40 per cent. The Age Pension is therefore likely to remain an important feature of the retirement income framework into the future.
The Budgetary cost of the Age Pension (including the Aged Service Pension) currently accounts for around 2.9 per cent of Gross Domestic Product (GDP) per annum. This cost is expected to increase to 3.6 per cent of GDP by 2021 and 4.6 per cent of GDP by 2041, reflecting the ageing of the Australian population.
Compulsory superannuation - the Superannuation Guarantee
An important part of Australia's superannuation system is the provision of compulsory employer contributions through the Superannuation Guarantee (SG). The SG arrangements were introduced in 1992 to ensure that employees are provided with adequate levels of superannuation support from their employer. Under the SG arrangements, employers are required, with very few exceptions5, to provide a prescribed minimum level of superannuation support each financial year for their employees. SG contributions are tax deductible to employers.
The phasing in of the compulsory SG arrangements was over a ten-year period completed on 1 July 2002. For 2002-03 and subsequent years, the prescribed minimum contribution rate is 9 per cent of the employee's `notional earnings base'.
Employer contributions made under the SG must be fully vested in the employee and are fully preserved (except in limited circumstances such as death and disability) until retirement on or after preservation age (currently 55 but gradually rising to 60 between 2015 and 2025).
From 1 July 2003, employers will be required to make SG contributions on behalf of their employees at least quarterly. This measure is designed to better safeguard employees' superannuation entitlements in the event of their employer becoming bankrupt or insolvent. As approximately 85 per cent of businesses currently make superannuation contributions quarterly or more often, this measure will ensure greater fairness between employees in relation to the security of their superannuation entitlements.
The coverage of superannuation in Australia has grown significantly as a result of the introduction of the SG and the fact that the legislation provides for very few exemptions. In 1986, only around 40 per cent of Australian employees had superannuation coverage. The ABS Survey of Employment Arrangements and Superannuation indicates that superannuation coverage now extends to some 98 per cent of traditional employees with leave entitlements and 72 per cent of casuals. Table 1 shows the historical changes in the coverage of employees.
Table 1: Historical changes in employee superannuation coverage
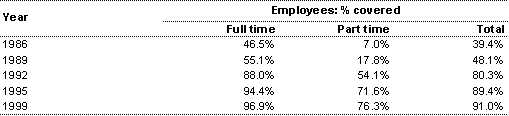
Source: ABS Employment Benefits Surveys 6334.0,6310.0.
Self-employed persons are excluded from the requirement to make mandatory superannuation contributions through the SG. This group is encouraged to save for their retirement through the availability of tax deductions for personal superannuation contributions and tax concessions for saving through a small business. Around two thirds of the self-employed have some superannuation coverage.
Voluntary private savings
In addition to compulsory employer contributions, some employers make above SG contributions for their employees. Individuals can also save voluntarily for their retirement through superannuation and/or other savings vehicles outside of superannuation such as property investment, (including owner-occupied housing) shares and financial securities. Voluntary retirement savings are primarily encouraged through the provision of taxation incentives for superannuation.
Employees can make voluntary member contributions to superannuation from post-tax income. While such contributions do not benefit from the concessional tax rate applying to superannuation contributions, they still benefit from the concessional tax rate applying to the earnings on benefits inside the fund (details below). Salary sacrifice arrangements enable many employees to exchange part of their gross (pre-tax) salary in return for their employer contributing money into superannuation on their behalf. Salary sacrifice arrangements enable employees to effectively substitute the concessional tax rate applying to employer superannuation contributi
ons for their own marginal tax rate. Special taxation arrangements apply to self-employed people for their superannuation contributions.
The superannuation changes contained in the 2002-03 Budget are designed to enhance retirement incomes and further increase the incentive to contribute to superannuation. These measures include a Government superannuation co-contribution of up to $1,000 a year for low income earners, an increase in the fully deductible threshold for superannuation contributions made by self-employed persons, a phased reduction in the superannuation surcharge and a measure allowing couples to split their superannuation contributions.
Voluntary member superannuation contributions, other employer contributions above the SG, and other non-superannuation savings are important determinants of the adequacy of retirement incomes. More than half of all employed people aged over 40 with taxable incomes above $30,000 have made some additional provision for their retirement.
Saving through home ownership also has a direct bearing on the adequacy of retirement incomes by significantly reducing the cost of accommodation in retirement. In this context, the majority of older people in Australia are homeowners. The Australian Housing Survey 1999 showed that 80 per cent of households in which the reference person was aged over 65 owned their home outright and a further 4 per cent were purchasing. Where the reference person was aged 55 to 64, 66 per cent of households owned their home outright and 17 per cent were purchasing.
Preliminary estimates suggest that households headed by persons over 65 have 45 per cent of their private wealth in housing and land, 40 per cent in financial assets such as deposits, shares, securities, and insurance reserves and 15 per cent of assets in funded and unfunded private pension funds.
While the SG system has facilitated wide superannuation coverage of the Australian population, a number of new measures are designed to broaden access to superannuation by extending the circumstances in which voluntary contributions to superannuation can be made.
- Consistent with the need to promote superannuation as a lifetime savings strategy, from 1 July 2002, parents, grandparents, other relations and friends will be able to contribute to superannuation on behalf of children. Under this measure, contributions of up to $3,000 per child per 3-year period can be made on behalf of a child under the age of 18. Superannuation for life will help create a culture that gives priority to planning ahead and achieving financial self-reliance in retirement.
- In addition, the accessibility of superannuation will be widened by allowing working people aged over 70 but less than 75 years of age to make personal contributions to superannuation. To be eligible individuals must be working at least 10 hours per week. This measure recognises the choice made by some people to continue working past the age of 70.
- Another measure will also allow recipients of the Baby Bonus to contribute the Baby Bonus and any other amount to superannuation, even if they have never worked before. This initiative provides a new mechanism for parents at home caring for children to continue to save for their retirement.
The Government has restrictions on contributions past age 65, and compulsory cashing at age 65 if the member is no longer working part-time, to reduce the risk that concessionally taxed benefits are used for estate planning and not genuine retirement income purposes.
Taxation arrangements for superannuation
The taxation arrangements applying to superannuation are designed to encourage the accumulation of superannuation savings during an individual's working life for the purpose of drawing on those savings as a source of income in retirement. The main elements of the taxation regime applying to superannuation are outlined below.
Contributions
The taxation incentives available for superannuation include a concessional tax rate on employer and deductible member superannuation contributions of 15 per cent for low to middle income earners, and 15 per cent plus the surcharge of up to 15 per cent for high income earners. These tax rates compare favourably with the marginal tax rates, which apply to equivalent amounts of earnings subject to income tax.
In relation to the superannuation surcharge, the Government has introduced legislation into the Parliament to reduce the maximum surcharge rate by 1.5 per cent in each of the next three years. Under this measure, the maximum surcharge rate will fall to 10.5 per cent in 2004-05. The Government has also committed to review the surcharge arrangements at that time to determine whether any further changes are required.
The Government has announced the introduction of a superannuation co-contribution for low income earners to replace the current taxation rebate for superannuation contributions by low income earners. The maximum co-contribution of $1,000 a year will be payable in respect of personal contributions made by people on incomes up to $20,000. A reduced co-contribution will be payable to those on incomes up to $32,500. The co-contribution is designed to enhance the retirement savings of low income earners and to increase the incentive for this group to contribute to superannuation. In this context, the maximum co-contribution of $1,000 is significantly more generous than the maximum $100 rebate it is replacing.
As noted earlier, tax deductions are made available to self-employed persons to encourage this group to contribute to superannuation. The fully deductible amount for superannuation contributions made by self-employed persons is $5,000. Contributions above this amount are 75 per cent deductible, with a maximum deduction equal to the taxpayer's age-based deduction limit. Tax deductibility for the self-employed is designed to enhance the superannuation savings of self-employed persons by providing them with an increased incentive to contribute to superannuation.
Many self-employed persons who own a small business choose to save for their retirement by building up the value of their business in addition to or instead of contributing to superannuation. In recognition of this, the Government has implemented a number of initiatives to allow small businesses meeting the eligibility criteria to significantly reduce, or eliminate, their capital gains tax (CGT) liability when selling a small business or part of a business. For example, a small business can disregard a capital gain when an active asset that has been held continuously for 15 years is sold. Furthermore, a small business can disregard a capital gain where the proceeds of the sale of an asset are used for retirement (up to a lifetime limit of $500,000).
Tax deductions are available for employer and deductible member (self-employed) contributions to superannuation. Age-based limits apply to the amount of deductible contributions that can be made to superannuation and are indexed annually to movements in Average Weekly Ordinary Time Earnings (AWOTE). The age based limit system, together with the Reasonable Benefit Limit (RBL) arrangements, is designed to impose limits on the amount of superannuation which can receive concessional taxation treatment. The policy intention behind these limits is to ensure that superannuation is used for its intended purpose of providing for genuine retirement income, and not as a wealth creation or estate planning vehicle.
Earnings
A 15 per cent tax rate applies to the investment income of superannuation funds. This rate compares favourably with the rate of tax applying to earnings obtained from most other savings vehicles. Only two-thirds of qualifying capital gains are taxable, reduc
ing the maximum effective capital gains tax rate for superannuation funds to 10 per cent. Superannuation funds are also entitled to imputation credits, which can be refunded.
Benefits
Retirees have the choice of taking their superannuation benefit either as a lump sum or as an income stream.
Tax and social security incentives are provided to encourage retirees to purchase income stream products, which meet the Government's broad retirement income policy objectives. In particular, incentives are afforded to income stream products that provide for an orderly, regular draw down of the capital underlying the product over the expected duration of retirement. Where individuals take at least 50 per cent of their total benefits in the form of a pension or annuity which satisfies the pension and annuity standards (commonly referred to as `complying' pensions and annuities), they qualify to be assessed against the higher pension RBL. The pension RBL of $1,124,384 for 2002-03 compares with the lump sum RBL of $562,195. In contrast, lump sum benefits and pensions and annuities not meeting these standards are assessed against the lump sum RBL.
`Complying' lifetime and life expectancy pensions and annuities are also exempt under the social security assets test. All other income stream products, including allocated pensions and annuities, are asset tested. One of the Government's election commitments was to examine whether `complying' status should be afforded to a new class of market-linked pension known as a growth pension. Unlike existing complying income streams, the annual level of income from growth pensions would be dependent on the performance of the underlying portfolio of assets.
Superannuation pensions up to the value of the taxpayer's RBL which are paid from a taxed source are also eligible for a 15 per cent tax rebate (the pension and annuity rebate). The rebate was introduced to compensate for the introduction in 1988 of the 15 per cent tax rate on complying superannuation funds.
For lump sum benefits taken on or after age 55, the first $112,405 (indexed annually to AWOTE) of the post-June 1983 component is tax free if paid from a taxed fund, or taxed at a maximum rate of 15 per cent if paid from an untaxed fund. Any remaining post-June 1983 component (up to the individual's lump sum RBL) is taxed at a maximum rate of 15 per cent if paid from a taxed fund or 30 per cent if paid from an untaxed fund. (The Medicare levy applies in addition to these tax rates.) The part of a lump sum benefit which represents the return of an individual's own after tax contributions is not subject to further tax.
In addition to the concessions available through superannuation, the Government has implemented a number of other initiatives which directly benefit people's living standards in retirement. These initiatives include the various concessions available to people of Age Pension age, as well as the Senior Australians Tax Offset (SATO). The SATO ensures that single senior Australians can have income up to $20,000 without paying income tax or the Medicare levy. While the rebates phase out over the income range $20,000 to $37,840 (for singles), taxpayers in this range still pay less tax than previously. Similarly, senior couples can have combined incomes of up to $32,612 without paying tax (depending on their income split). For couples, the rebates phase out at combined incomes up to $58,244.
Adequacy and the taxation of superannuation
Notwithstanding Australia's approach of taxing superannuation at all three stages (ie contributions, earnings and benefits), research undertaken by Treasury's Retirement and Income Modelling (RIM) Unit indicates that superannuation is a tax preferred investment over a working lifetime for persons in all marginal tax brackets. (This research is summarised in Chapter 4 of this submission.) The aggregate size of the tax expenditure associated with superannuation is projected at approximately $10.3 billion in 2002-03.6
The taxation of superannuation can affect the adequacy of retirement incomes in a number of ways. In a direct sense, the concessional taxation treatment of superannuation increases the amount of a contribution which is available to be invested (after tax) compared with alternative forms of saving - for example, shares or property acquired out of after tax income. This advantage continues during the accumulation phase of superannuation reflecting the concessional tax rate applying to investment earnings on superannuation account balances. The concessionality of superannuation also has an indirect impact on the adequacy of retirement incomes to the extent that it encourages individuals to undertake retirement savings.
Some commentators have suggested that the complexity of the superannuation taxation arrangements detracts from the adequacy of retirement incomes by imposing costs on superannuation funds, which are passed on in higher fees and charges to members' accounts. The impact of the complexity of the taxation arrangements applying to superannuation funds is clearly an important issue. However, it also needs to be recognised that these arrangements are designed to meet specific public policy objectives, and some level of cost is inevitable as a trade-off for meeting these policy objectives.
It has also been suggested that complexity can impact indirectly on adequacy by reducing the incentive to contribute to superannuation. However, it is arguable that much of the complexity of superannuation is hidden from members, and that for most employees the actual process of making superannuation contributions is not complex. For example, for employees whose only interaction with the superannuation system is through the SG in a defined contribution scheme, superannuation is relatively straightforward with contributions made on their behalf by their employer. Employees who wish to make additional voluntary contributions can either choose to have these deducted regularly from their after tax pay, or arrange with their employer to have regular contributions made from their pre-tax salary. Moreover, in contrast with non-superannuation investments, superannuation requires little or no involvement from fund members once the contributions have been paid into the system. Unlike other investments, the earnings on superannuation investments do not have to be included in a person's annual tax return but are subject to a concessional taxation regime inside the fund.
Trends in superannuation
Superannuation assets totalled $527.7 billion in December 2001, over double their level of 6 years ago, making superannuation by far the largest component of household financial assets.
APRA statistics7 show strong growth in superannuation contributions, with the flow of member contributions increasing by around 30 per cent over 3 years and employer contributions by about 25 per cent over the same period. After some years of very strong growth member contributions appear to have reached a plateau with no growth over the past year, while employer contributions have continued their steady growth growing about 7 per cent over the year.
Modelling by Treasury's RIM Unit projects that superannuation account balances will increase substantially in the future as the SG system matures. Currently, the average superannuation balance per person is about $62,000, with a wide variation about this average depending on years of membership and levels of contributions. By June 2005 this average balance is projected to increase to $70,000, by June 2010 to $84,000 and to $113,000 by June 2020, all in today's dollar values. These estimates are based on conservative assumptions about fund earning rates.
Average superannuation payouts at ag
e retirement are also estimated to increase. These payouts are currently around $72,000 per person rising to $83,000 in June 2005, $100,000 in June 2010 and $136,000 in June 2020 (all in today's dollar values). There will be wide variations around all these averages, but the strong improvement in benefits as the system matures is clear.
The economic and fiscal context
The Intergenerational Report which was presented with the 2002-03 Budget highlighted the need for sound and sustainable economic policies, including retirement income policies, in the face of the budgetary pressures associated with an ageing population. At a broad level, policies which maximise sustainable economic growth, as well as overall economic and social participation directly benefit living standards in the community, including among retirees. In the retirement incomes context, increasing longevity has direct implications for the level of savings people need to accumulate prior to retirement in order to fund income in retirement. As most people's capacity to accumulate retirement savings is dependent on their participation in the workforce, this in turn has implications for policy in areas such as labour force participation (including among mature age people) and the related issue of the preservation age for superannuation.
Any analysis of the appropriateness of the retirement income system needs to have regard to the broader economic and fiscal framework within which it operates. Any analyses or proposals in this area which do not have regard to this broader context are of limited use in informing the policy debate. For example, proposals to increase the adequacy of retirement incomes by significantly reducing, or eliminating the taxation of superannuation during the contribution and accumulation stage must be assessed against the fiscal implications of such proposals, and the associated trade-offs.
Superannuation is taxed concessionally in Australia with the aggregate size of the tax expenditure associated with superannuation projected at $10.3 billion in 2002-03. Nevertheless, Commonwealth taxation revenue from superannuation contributions and earnings is significant - in 2002-03 this revenue is estimated to comprise:
- $3.8 billion from the taxation of superannuation funds;
- $0.8 billion from the superannuation surcharge; and
- an amount from the taxation of statutory funds of life insurance companies under the company tax head of revenue, which is currently not estimated separately.
Viewed in this context, proposals to defer the taxation of superannuation entirely to the benefit stage (that is, when people retire and receive their accumulated superannuation benefits) involve trading off a significant deterioration in the budgetary position over the medium term, and resultant higher Government debt and public debt interest costs, for increased taxation revenue in future years when the current working generation moves into retirement. The alternative to such a trade-off would be the introduction of significant offsetting fiscal measures to leave the Government's overall budgetary position no worse off.
Chapter 3: Quantitative modelling of expenditure replacement rates
This submission uses two modelling approaches to the measurement of replacement rates:
a) modelling of the lifecycles of hypothetical individuals and couples; and
b) modelling for the whole Australian population using actual and projected comprehensive labour force experience, superannuation diversity and retirement diversity.
The models used were updated to take account of recently announced taxation and other policy changes, lengthening life expectancies, revised interest rate and other economic parameters and revised annuity factors.
Hypothetical modelling of the adequacy of retirement incomes under the Superannuation Guarantee and the Age Pension
Treasury's Retirement and Income Modelling (RIM) Unit has modelled current Superannuation Guarantee and Age Pension policy for a variety of hypothetical scenarios corresponding to a request received from the Secretary of the Senate Select Committee on Superannuation on 30 April 2002. A comprehensive set of results is presented in Appendix A. Analysis of the Government's proposed co-contribution policy is also included in this submission.
Choosing parameters for a hypothetical analysis of retirement incomes
In considering what sort of life experience should be considered for hypothetical cases the following issues arise:
- the level of earnings over a career;
- the length and extent of interruption of that career and the related choice of the income unit type;
- the nature of the replacement rate measure;
- the approach to indexation of income and expenditure amounts which are presented; and
- the choice of economic and fund parameters.
The most commonly used measure of earnings in superannuation is the Average Weekly Ordinary Time Earnings (AWOTE) of persons working full time. AWOTE has the advantage of giving a full-time base covering males and females which excludes overtime. Such a base corresponds to the earnings base of most superannuation plans. AWOTE is also the basis for indexing most dollar value thresholds in superannuation. Most employees (70 per cent) earn less than AWOTE with median earnings being 75 per cent of AWOTE and mean earnings being 83 per cent of AWOTE.8
The Superannuation Guarantee when it was introduced extended coverage mostly to blue collar and casual employees in the lower half of the earnings distribution. For the purposes of this submission three illustrative incomes are covered for full-time workers - 75 per cent, 100 per cent and 150 per cent of AWOTE. Part-time workers are taken as proportions of this based on hours.
AWOTE in March 2002 was $860.50 or the equivalent of $44,746 per year. So 75 per cent of AWOTE is around $33,560 and 150 per cent is around $67,119. In general people earning above $50,000 have savings in addition to the Superannuation Guarantee which could be used to produce retirement income. From taxation data Treasury's RIM unit has estimated that:
- 69 per cent of employed people aged 40 or more with incomes over $50,000 have superannuation higher than the SG or significant non-superannuation savings;
- 63 per cent of women under 65 with taxable incomes over $50,000 have superannuation higher than the SG or significant non-superannuation savings; and
- 60 per cent of men under 65 with taxable incomes over $50,000 have superannuation higher than the SG or significant non-superannuation savings.
For these reasons, SG only cases for people whose incomes are in excess of 150 per cent of AWOTE appear atypical and are not presented in this submission.
Fully representative data on the completed lengths of careers for individuals are not available. For the purposes of this submission, career lengths of 25, 30 and 40 years are used. For convenience, all hypothetical cases presented in the body of this submission retire at age 65 in 2032. Age 65 was chosen because it corresponds to Age Pension age - some cases beginning retirement on Newstart Allowance or Mature Age Allowance are shown in Appendix A. The common retirement year of 2032 was chosen so that all dollar values for retirement are comparable. If this had not been done, cases retiring later would have higher real wages and higher real Age Pension payments.
Many women have careers which are interrupted by childbirth, so this submission presents results for interrupted female careers and for couples in which the female partner has an interrupted career.
Some groups have
based their replacement rates on measures of gross income. This is not considered the best approach because of substantial differences in taxation before and after retirement. Expenditure is used in this submission as the best guide to private standards of living. This submission proposes that the optimal replacement rate measure is the ratio of average expenditure in retirement to the expenditure in the last year of full-time working life. Other measures presented involve either too great a time period between average working life and retirement income or the unrepresentative nature of the first year retirement income.
The best deflator for expenditure is the consumer price index. Deflating by wages (as in the results of other groups) does not reflect what people are able to buy, and does not capture growth in real wages and the real value of the Age Pension over time.
The current hypothetical analysis, done using the RIMHYPO Model, uses long-term annual growth parameters of 2.5 per cent for the consumer price index, 4 per cent for wages and 7 per cent for fund earnings.
Case 1: Single males retiring in 2032
Table 2 presents the results of RIMHYPO runs for six hypothetical males retiring in 2032, with an average life expectancy of 83, taking their superannuation as a lump sum benefit and drawing down on it in an annuity pattern so that it lasts until life expectancy.
Table 2: Scenarios for single males retiring in 2032
|
Scenario: Single Male |
|
|
Retirement Year = 2032 |
Benefit taken as LUMP SUM |
|
CPI = 2.5%, Wage Inflation = 4% |
Fund Earning Rate = 7% |
|
Tax Indexation = CPI |
Pension Indexation = AWE |
|
Life Expectancy = 83 |
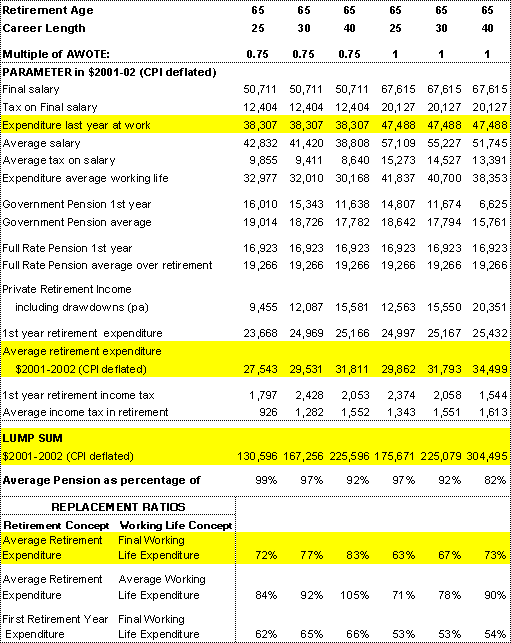
For the three cases with career earnings of 75 per cent of AWOTE, expenditure in the last year of working life is $38,307 in 2001-02 dollars. The average expenditure over retirement ranges from $27,543 for the 25-year career to $31,811 for the 40-year career, giving replacement rates ranging from 72 per cent to 83 per cent. The contribution of the Age Pension to retirement expenditure falls as private retirement income (and assets) rises.
For the 30-year accumulation case at 75 per cent of AWOTE, the lump sum benefit of $167,256 yields an annual drawdown of $12,087 which is complemented by an Age Pension which averages $18,726 (or 97 per cent of a full rate pension). An average of $1,282 of tax is paid in retirement.9 The replacement rate of average retirement expenditure to final year of full-time work expenditure is 77 per cent.
For the three cases with career earnings of 100 per cent of AWOTE expenditure in the last year of working life is $47,488 in 2001-02 dollars. The average expenditure over retirement ranges from $29,862 for the 25-year career to $34,499 for the 40-year career, giving replacement rates ranging from 63 per cent to 73 per cent. The contribution of the Age Pension to retirement expenditure falls as private retirement income (and assets) rises.
For the 30-year accumulation case at 100 per cent of AWOTE, the lump sum benefit of $225,079 yields an annual drawdown of $15,550 which is complemented by an Age Pension which averages $17,794 (or 92 per cent of a full rate pension). An average of $1,551 of tax is paid in retirement.10 The replacement rate of average retirement expenditure to final year of full-time work expenditure is 67 per cent. This is lower than the 75 per cent of AWOTE case mainly because the contribution from the Age Pension is a lower proportion of final working expenditure.
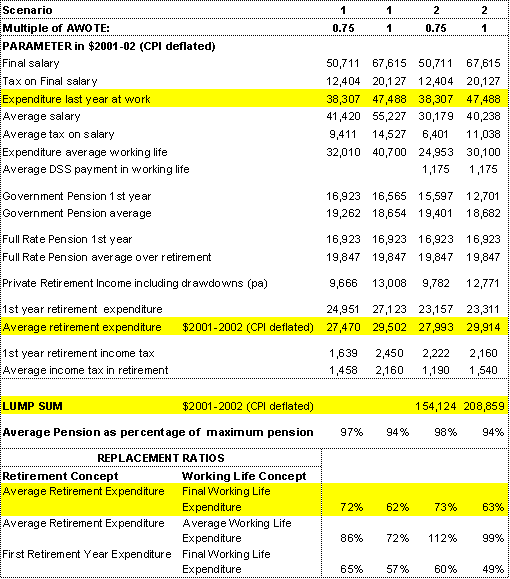
Case 2: Single females with interrupted careers
Table 3 presents two scenarios for females with interrupted careers who are not married when they enter retirement and who rely on their own superannuation for private retirement income.
In Scenario 1, the woman works from 35 to 64 years and takes her benefit in the form of a life expectancy pension. Cases are presented for career earnings at 75 per cent of AWOTE and 100 per cent of AWOTE.
In Scenario 2, the woman works full time from 25 to 29 and 45 to 64, does not work from 30-34 and works 17 hours per week from ages 35 to 44. Cases are presented for career earnings at 75 per cent of AWOTE and 100 per cent of AWOTE.
For Scenario 1, the expenditures in the final years of working life are $38,307 and $47,488 for the 75 per cent and 100 per cent of AWOTE cases respectively. The average expenditures in retirement are $27,470 and $29,502 giving replacement rates of 72 per cent and 62 per cent respectively.
For Scenario 2, the expenditures in the final years of working life are $38,307 and $47,488 for the 75 per cent and 100 per cent of AWOTE cases respectively. The average expenditures in retirement are $27,993 and $29,914 giving replacement rates of 73 per cent and 63 per cent respectively.
Table 3: Scenarios for single females
|
Scenario 1: Female works from 35 to 64 - 30 years, life expectancy pension |
|
|
Scenario 2: Female with interrupted career starting 1992 - full-time work from 25-29 and 45-64, not working 30-34, 17 hours per week from 35-44, turns all of benefit into ETP |
|
|
Retirement Year = 2032 |
|
|
CPI = 2.5%, Wage Inflation = 4%, |
Fund Earning Rate = 7% |
|
Tax Indexation = CPI |
Pension Indexation = AWE |
|
Life Expectancy = 87 (female) |
|
Case 3: A married couple
Table 4 presents two income levels for a scenario for a couple where the male has 40 years in the workforce, and the female has 6 years out of workforce (30-35) and ten years working part time (36-45). The partners have the same income when working full-time and both take their benefits as life expectancy pension.
Table 4: Scenarios for a couple
|
Scenario 3: Couple where male has 40 years in the workforce, and female has 6 years out of workforce (at age 30-35) and ten years working part time (at age 36-45), partners have same income when working full-time, benefits as life expectancy pension |
|
|
Retirement Year = 2032 |
|
|
CPI = 2.5%, Wage Inflation = 4%, |
Fund Earning Rate = 7% |
|
Tax Indexation = CPI Pension Indexation = AWE |
|
|
Life Expectancy = 83 (male), 87 (female) |
|
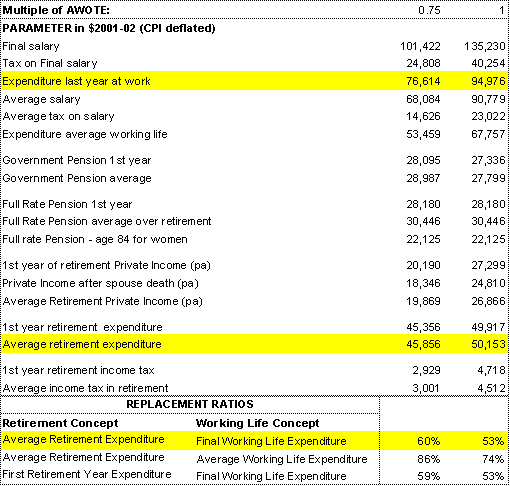
The final working year expenditure for the couples achieved are $76,614 for the 75 per cent of AWOTE case and $94,976 for the 100 per cent of AWOTE case. The average retirement incomes are $45,856 and $50,153 respectively. The replacement rates achieved are 60 per cent for the 75 per cent of AWOTE case and 53 per cent for the 100 per cent of AWOTE case. These are lower than for the single cases because the married rate pension replaces less of individual income when both members of a couple have previously been working. If only one member of a couple has been working, the married rate payment offers a very high replacement rate.
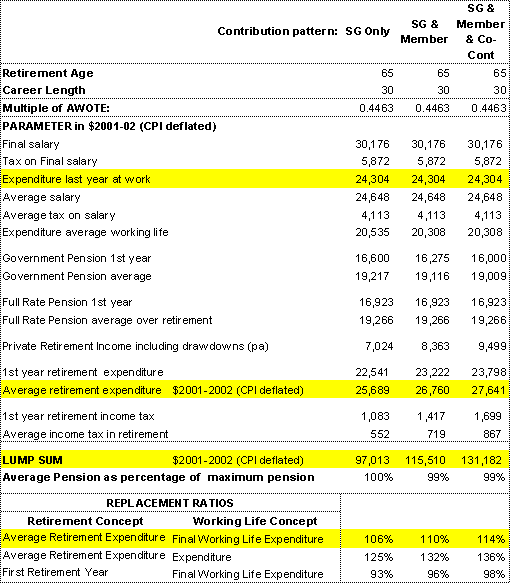
Case 4: The potential effects of the Government's proposed co-contribution policy
Table 5 compares three contribution scenarios for a single male earning 44 per cent of AWOTE ($20,000 in 2003-04), working for 30 years and retiring at age 65. The contributions are employer SG contributions only, SG plus member contributions in a pattern which would maximise co-contribution receipts but without co-contributions, and the SG plus member plus co-contribution scenario. Because the co-contribution thresholds are not indexed, as real wages are assumed to rise the employee loses their co-contribution entitlement after 12 years.
The lump sums generated by these patterns are $97,013, $115,510, and $131,182 respectively. The Age Pension provides a considerable replacement of this employee's final year of work expenditure, and the average to final replacement rate is raised from 106 per cent for SG only to 114 per cent for SG plus member plus co-contributions. Across the 19 years of retirement, the 12 years of member contributions and the co-contributions raise retirement income by almost $2,000 per year in real terms, or by around 8 per cent.
Conclusions on hypothetical scenarios
The SG in combination with the Age Pension can produce replacement rates in excess of 60 per cent for male careers of 25, 30 and 40 years duration and for interrupted female careers. If both members of a couple are working at retirement, the married rate Age Pension provides a lower base replacement rate than in the single case, but if one member of a couple is working it provides a higher base replacement rate. Member contributions combined with co-contributions (whose income test threshold is not indexed) can improve retirement incomes by 8 per cent for workers earning around $20,000.
Table 5: Example of the effect of the Government's co-contribution policy on final benefits
Whole of population analysis of replacement rates
As with the hypothetical analysis, the main adequacy concept used is a replacement rate based on post-retirement consumption expenditure compared with pre-retirement expenditure. As before, this includes income from all investments, all pension payments including social security payments, and drawdowns from capital less any taxation payable. Aggregate analysis done using the RIMGROUP model assumes current legislated policy parameters. However in this aggregate analysis the comparison drawn is between the expenditure of retirees for the 5 years after pension eligibility age with income for the 5 years before Age Pension eligibility age. Given the structure of RIMGROUP in which new retirees are pooled with existing retirees, this definition makes it easier to do aggregate analysis, while distinguishing between cohorts which may have retired a decade or more earlier. The distinction is relevant because, in general, retirees do not maintain a living standard in retirement that is fully linked to average wages, while the age pension is linked to total male average wages. The mix of investments of retirees means that their non-pension income, which is mainly sourced from interest bearing investments and may have capital drawdowns, will generally not grow in real terms.
What differentiates the aggregate from the hypothetical analysis?
The prime difference between aggregate and hypothetical analysis is the coverage in the aggregate analysis of the entire Australian population. Aggregate analysis covers the range of labour force experiences including unemployment and other breaks from the labour force, the range of retirement ages, and the varying superannuation coverage across the population including some schemes with better than SG rates of contribution, salary sacrifice arrangements, and member contributions. Additionally RIMGROUP estimates other financial savings at retirement and adds these to the pool of monies to be allocated and invested at retirement. RIMGROUP also allocates retirement investments patterns in a realistic way and allows for dissipation at retirement and drawdowns during retirement. These patterns are a function of gender and decile, although the data base is not comprehensive in all of these respects.
Also important in the aggregate analysis is the time dimension, whereby the experiences of those retiring now can be compared with those retiring in thirty or forty years - time is an important and automatic dimension of the analysis. The hypothetical analysis presented in this submission only looks at those retiring in 30 years time.
The aggregate modelled results for the present time with its low nominal investment returns are higher than Johnson's (1998) finding of 33 per cent replacement rate from the Age Pension alone, reflecting modest income from additional investments (Johnson found that for the middle quintile currently 88 per cent of total income comes from a government pension). The value added in the analysis presented below is the capacity to project changing replacement ratios up to 50 years into the future with realistic superannuation and other savings and assuming high draw-down of assets in retirement. As the SG system matures the modelled replacement rates rise sharply.
Potential aggregate replacement rates
For an analysis of potential replacement rates it seems appropriate to assume that assets are largely drawn down in an annuity pattern over the person's or couple's retirement. This reflects the approach taken in the hypothetical analysis and gives a measure of the potential afforded by the retirement income framework. In practice, given uncertainty as to their longevity, most prudent people won't quite achieve this and as an operational compromise we have assumed annuity drawdown of all fixed interest deposits but only moderate drawdown of shares and allocated pensions. This assumed pattern together with a broad continuation of labour force and retirement trends and tendencies and continuation of recent investment patterns in retirement is the basis of all the aggregate results which follow.
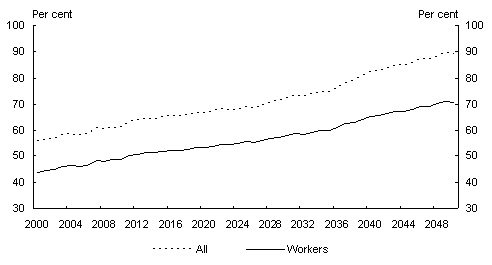
Ratios of retirement expenditure over recent pre retirement expenditure are calculated for two groups: those who have had long term superannuation coverage, and the full population, adding in those who have had little or no superannuation coverage, including the self employed who have chosen not to contribute. For convenience these groups are referred to as `workers
' and `all' respectively. The time analysis of aggregate replacement ratios for these two groups is shown in the chart below.
Chart 1: Potential aggregate replacement ratios - annuity
drawdown all workers and full population
Conclusions
The aggregate analysis incorporates the experiences of the whole population, accounts for savings above the base SG level, and adds a valuable time dimension whereby the experiences of those retiring now can be compared with those retiring in thirty or forty years. For an analysis of potential replacement rates it seems appropriate to assume that assets are largely drawn down in an annuity pattern over the period of the person or couple's retirement. The aggregate analysis on this basis shows replacement ratios for workers rising significantly from 45 per cent currently to 71 per cent by 2050. For the `all' group the replacement ratios are about 57 per cent now, rising to 75 per cent by 2035 and almost 90 per cent by 2050.
Chapter 4: Concessional tax treatment of superannuation
Superannuation in Australia is a tax preferred investment where tax concessions are provided to encourage (and increase the level of) saving for retirement and provide an offset to `locking up' superannuation until preservation age.11
This section assesses the extent of the tax advantage of superannuation taking account of both current tax levels and the changes announced in the 2002-03 Budget, which importantly included the government co-contribution for low income earners. The framework used is that of Rothman (2000) updated for tax changes.
The assessment is from the individual's viewpoint, particularly in two broad areas:
- For those contributing at Superannuation Guarantee (SG) level over a working lifetime; and
- For one off investments, mostly by persons with assets over their Eligible Termination Payment tax-free threshold (currently $112,405 and indexed annually to AWOTE).
Limits to superannuation tax concessions
There are a number of limits in the overall taxation of superannuation, which are intended to limit the tax concessions available to an individual over a working lifetime. The age based contribution limits are one such limit and arguably, the contributions surcharge is another. The other key limit is the Reasonable Benefit Limit or RBL. All the analyses in this Section assume that contributions are within the age limits and that the relevant RBL is not exceeded over a person's working life. This covers an overwhelming majority of cases.
The limits constitute integral safeguards for the system and need to be respected; some analyses show very high tax rates if these limits are exceeded (eg Smith, 2000). A number of recent government policy actions and decisions are aimed at making individuals no worse off within superannuation than outside it, even where the limits are exceeded.
Analysis framework
The framework is as developed in Rothman (2000). In brief, this uses Excel spreadsheets to compare the amounts accumulated at retirement after all taxes in two situations: the first where the person invests in the superannuation system with its rules and taxes and the second where the same person invests the equivalent monies as available post income tax outside of the superannuation system, using the same investment portfolio as used for the superannuation investment. Care is taken to distinguish pre tax monies from post tax and to compare like with like.
A conservative, simplified framework is used which assumes taking all benefits as a post preservation age ETP and applying the full 16.5 per cent tax rate above the ETP tax-free threshold (where the threshold applies). This framework somewhat understates the relative advantage of superannuation. Those who choose retirement income stream products will not pay ETP tax on these benefits and may also gain a 15 per cent tax rebate; generally this will result in a higher standard of living in retirement than taking all benefits as an ETP (see Tinnion and Rothman, 1999).
Results
Compulsory superannuation - The Superannuation Guarantee
The analysis framework has been used to assess the extent of tax advantage given to SG contributions over a working lifetime made up of any number of years up to 40. It is assumed that the fully implemented SG rates apply throughout. The analysis is done for people based on their marginal tax bracket.
The results in the following chart set out the percentage advantage of the `all taxes paid' outcome for superannuation compared with the `all taxes paid' outcome for money invested outside of superannuation, using a similar balanced investment portfolio.
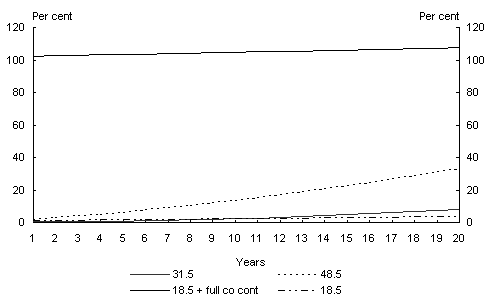
Chart 2: Proportional advantage of
SG superannuation contributions
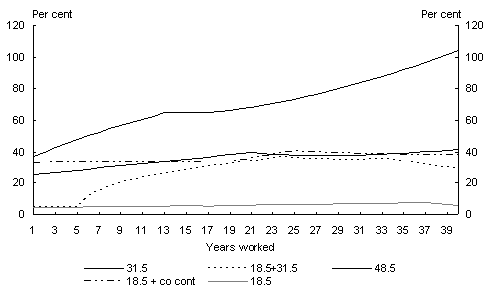
The various lines refer to the marginal personal income tax rate of the person. For the 18.5 and 31.5 lines, the marginal tax rate applies throughout the person's working life. The `18.5+31.5' case has the person on the 18.5 per cent marginal personal tax rate for the first 5 years of their working life, followed by 30 years of work at 31.5 per cent, and the rest of working life at 18.5 per cent. Arguably, patterns such as this, combining periods of work at 18.5 per cent with longer periods at 31.5 per cent, are fairly typical cases. The 48.5 line assumes the person pays this marginal tax rate and the full surcharge throughout their working life. The surcharge rate is assumed to reduce in line with the Government's intentions as announced in the 2002-03 Budget.
The (constant) 18.5 case, in effect, excludes any period of adult full time work.12 Further, given the potential importance of the newly announced co-contribution policy, a line is included which is not a pure SG line but has the (constant) 18.5 per cent person making a member contribution of 3 per cent. This is then fully matched by a government co-contribution. All the cases shown except this one are solely SG contribution cases.
The chart shows, for example, that the SG superannuation accumulation after all taxes for a person consistently on a 31.5 per cent marginal personal income tax rate is 40 per cent more after 21 years and 42 per cent more after 40 years than the accumulation of the equivalent post tax contributions outside of the superannuation system. For the `18.5+31.5' case the advantage of superannuation is 36 per cent after 24 years and 29 per cent after 40 years. For the `18.5 + co-cont' case, the advantage of superannuation is 39 per cent after 30 years and 38 per cent after 40 years.
The slight dips in the purely SG curves13 indicate when the ETP tax-free threshold is exceeded. For example, this occurs after 21 years for the person consistently in the 31.5 per cent marginal tax bracket, and 13 years for the person paying 48.5 per cent.
The case of a person consistently on an 18.5 per cent tax rate shows that such a person would not exceed their ETP tax-free threshold until around 37 years of work r
eceiving the full SG. Given the SG has only now reached the full 9 per cent rate, and given the history of superannuation coverage described earlier, most of those currently on the 18.5 per cent rate will be substantially under the ETP tax-free threshold14 and this is the framework adopted for the next part of the analysis.
As the proportional advantage of superannuation is always positive in the chart, it is clear that given SG employer contributions only, superannuation is a tax-preferred investment over a working lifetime for persons in all tax brackets.
One off investments
The second major area of analysis is to consider the relative advantage of superannuation for one off investments, mostly by persons over the ETP tax-free threshold. The comparisons assume like portfolios for the within and outside superannuation investments.
As explained in the previous section, we assume that for the 18.5 per cent tax bracket the additional investment does not cause the ETP tax-free threshold to be breached. For all higher tax brackets, however, we assume that the person will exceed the ETP tax-free threshold over his/her working life and accordingly that the one off investment being considered will not benefit from the ETP tax-free threshold.
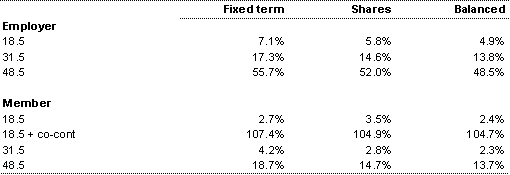
For periods of investment from 1 year up to 20 years, the charts below show the comparative advantage of employer and member superannuation, using a balanced portfolio for both the within and outside superannuation investments.
The analysis allows for a small differential in entry fees between the within and outside superannuation investments.15
In all tax brackets there is a clear advantage for employer superannuation building up over time. Comparing directly corresponding cases by tax bracket, the advantage of member superannuation is consistently lower than the corresponding advantage for employer superannuation. Generally the advantage for member superannuation is small for short periods for other than the top tax bracket, but builds up over time; the exception is the `18.5 + full co-cont' case as explained below.
Chart 3: Proportional advantage of employer superannuation -
one off investment, balanced portfolio
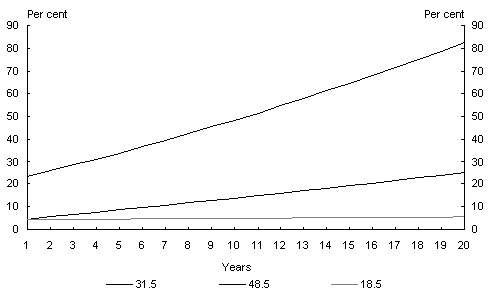
Chart 4: Proportional advantage of member superannuation -
one off investment, balanced portfolio
For the case of a person with an 18.5 per cent marginal personal tax rate, two situations in relation to member investments are modelled: in one case titled `18.5 + full co-cont' the dollar for dollar matching government co-contribution for member contributions up to $1000 is assumed to be available. The other 18.5 situation shown above occurs much less frequently. In the 18.5 line the co-contribution is zero as the maximum available co-contribution limit is assumed to have been reached prior to this investment. Clearly, many examples between the two extremes are possible. This co-contribution will also be available, at a reduced rate, for some persons in the 31.5 per cent bracket, considerably increasing the relative advantage of member superannuation for such persons, but given the wide range of possibilities, this has not been modelled explicitly.
Table 6 below sets out the relative advantage of superannuation after 10 years for various portfolios for both employer and member contributions. The same general relative pattern can be seen to apply independently of the portfolio chosen, with superannuation shown to be tax advantaged for all member and employer investments.
Table 6: Relative advantage of superannuation after 10 years, by nominal marginal tax bracket. One off investments using various investment portfolios.
Negative gearing
All the analysis above assumes that the comparison is between situations using the same investment portfolios for the within and outside superannuation investments. However, the use of `gearing' is an option available to those investors outside superannuation who are prepared to tolerate higher levels of risk. To make a geared investment, an individual increases the size of the total amount invested by adding a borrowed amount to their own investment, with the interest payable on the borrowing usually tax deductible to the investor. The term `negative' in relation to gearing applies when, as is usually the case, the nominal yield of the investment is less than the level of interest charged on the borrowing and therefore the attractiveness of the investment relies significantly upon the tax system. When drawing comparisons in the case of negative gearing, we use the same investment portfolios for the within and outside superannuation investments but here only the investment outside superannuation is geared, as the regulations prohibit the gearing of superannuation investments.
As well as normal assumptions on investment returns, for the `negative gearing' scenarios it is also necessary to specify the extent of gearing and an interest rate for the loan. For all cases it is assumed that the gearing arrangement borrows a sum equal to twice the original after tax amount available for investment - which is a `middle of the road' geared investment. The interest rate charged on the loan is assumed to vary from 0.75 per cent to 2 percentage points higher than the notional (pre tax) return of the investment. The examples shown in Table 7 below assume employer contributions are used for the superannuation investment and a balanced portfolio is utilised.
Table 7: Relative advantage of employer superannuation after 10 years, negative gearing, balanced portfolio
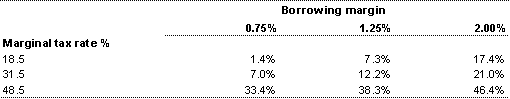
The results are not strongly dependent on the investment portfolio used but, not surprisingly, the extent of superannuation's relative advantage does vary significantly with the margin paid for the borrowing compared with the nominal return on the investment portfolio.
The continuing advantage of superannuation, even where a negatively geared strategy is used outside superannuation, is a strong result, given that any negative gearing strategy based on growth investments necessarily involves higher risk than the corresponding superannuation investment and will have very adverse results if the investments turn sour.
Sensitivity analysis
The exact figures in the Charts and Tables above depend on the precise details of the cases considered, including the make-up of the investment portfolio and in some cases the salary of the person.
The spreadsheets have been used to consider how the results vary by the fees and charges relating to the investment, portfolio composition, rates of return on investments, and the frequency of realisation of capital gains made. While the results for returns on individual investments do vary in response to the changes, the comparative patterns and the broad differences are quite robust to reasonable changes in these parameters.
Disc
ussion
While the above analysis has been fully updated to reflect recent and announced government policy changes, other parties have drawn broadly similar conclusions to those above, usually with less comprehensive coverage. However a subset of authors and commentators have published quite different and apparently contradictory conclusions. Treasury suggests that the apparent contradictions arise because of one or more of the following traps.
- The first and perhaps most obvious error is to simply add taxation percentages together - for example some people add the 30 per cent contributions tax (including surcharge) plus 16.5 per cent ETP tax (and perhaps 15 per cent earnings tax) and then compare this sum with 48.5 per cent, the top rate of personal income tax. Clearly this is wrong because the taxes apply to different quantities and need to be calculated correctly.16
- A related mistake is to ignore the ETP tax-free threshold, which is shown by the above analysis to be an integral and important part of the system.
- Another potential mistake is the failure to compare like with like and in so doing, confuse the tax status of monies available for investment.
- More a distortion than a mistake, is to focus on contributions outside the age based limits and cases where the relevant RBL is exceeded over a person's working life. The overwhelming majority of actual cases do not fall into these categories.
Conclusions
Assuming that contributions are made within age based limits and within RBLs, which cover the overwhelming majority of cases, the analysis demonstrates that for persons in all tax brackets receiving SG employer contributions only, superannuation is a tax preferred investment over a working lifetime of up to 40 years duration.
For persons in the 31.5 per cent and higher tax brackets, one off investments through superannuation are relatively advantaged for all ungeared investment portfolios.
Generally, making one off investments through employer contributions gives a higher level of advantage than using member contributions to make the investment. However the availability of the co-contribution dramatically changes the relativity for the 18.5 cases and the lower income ranges within the 31.5 bracket, where the maximum co-contribution has not been reached. Specifically, a one off investment by a person in the 18.5 per cent tax bracket remaining below their ETP tax-free threshold, is tax advantaged by 4 to 7 per cent for employer contributions, and by up to 107 per cent for member contributions under the low income co-contribution limit.
Further, for reasonably constructed comparisons using employer contributions and negative gearing for the outside of superannuation investment, superannuation remains the preferred investment vehicle in all tax brackets, with the strong advantage of involving much lower risk than negative gearing.
References
Australian Prudential Regulation Authority, Superannuation Trends December Quarter 2001, 2002.
Brown, C. and McDiarmid A., `RIMHYPO , An Outline of the Code.',
RIM Technical Paper 2/1995, Canberra, 1995.
Budget Strategy and Outlook 2002-03, Budget Paper No. 1, 14 May 2002.
Budget Measures 2002-03, Budget Paper No. 2, 14 May 2002.
Intergenerational Report 2002-03, Budget Paper No. 5, 14 May 2002.
National Strategy for an Ageing Australia, `Independence and Self Provision' Discussion Paper, Canberra, 1999.
Rothman, G., `
Aggregate and Distributional Analysis of Australian Superannuation using the RIMGROUP Model', Colloquium of Superannuation Researchers, University of Melbourne, July 1996.
Rothman, G., `Assessing The Tax Advantages Of Superannuation', Paper to The Eighth Annual Colloquium of Superannuation Researchers, University of NSW, July 2000.
Smith, B., `The Super Rip Off', Taxpayers Australia Magazine, p 318-319, 24 April 2000.
Tax Expenditure Statement 2001, The Treasury, December 2001.
Tinnion, J. and Rothman, G., `Retirement Income Adequacy and the Emerging Superannuation System', paper to the Seventh Annual Colloquium of Superannuation Researchers, University of Melbourne, July 1999.
1 Achieving an adequate retirement income - how much is enough? Summary of research findings and issues for discussion. Ross Clare, Association of Super Funds of Australia (ASFA) Research Centre, October 1999.
2 These replacement rates are based on individuals retiring in 2032. For individuals retiring under a fully mature SG system in 2042, the SG in conjunction with the Age Pension is projected to provide a spending replacement rate of 82 per cent, after 40 years of contributions.
Are administration and investment costs in the Australian superannuation industry too high? Ross Clare, Association of Super Funds of Australia (ASFA) Research Centre, November 2001;
Disclosure of Superannuation Fees and Charges. Hazel Bateman, School of Economics, The University of New South Wales, 2001;
Superannuation Fees and Competition. Phillips Fox Actuaries and Consultants for Investment and Financial Services Association (IFSA), April 2002; and
Expense disclosure for Superannuation Funds. Access Economics for The Industry Funds Forum, August 2001.
4 Achieving an adequate retirement income - how much is enough? Summary of research findings and issues for discussion. Ross Clare, Association of Super Funds of Australia (ASFA) Research Centre, October 1999.
5 Those exempt include employees earning less than $450 per month, part-time employees under 18 years of age and employees aged 70 and over.
6 Budget Strategy and Outlook 2002-03, Budget Paper No. 1, 14 May 2002. For methodology and other related issues see: Appendix B: Superannuation Benefits, Tax Expenditures Statement 2001.
7 APRA statistics are relatively up to date and are well established as the authoritative figures for asset levels. However, the levels of inflows and outflows as measured by APRA are consistently higher than those determined from ATO data (some time later) and other ABS survey data. Rothman (1996) discusses possible reasons for the differences, which have continued.
8 ABS Cat. No. 6306.0 Employee Earnings and Hours, May 2000.
9 The tax scales are indexed by the CPI. The Senior Australians Tax Offset is not indexed but the Age Pension rebate is indexed to the pension and the pension free area and people are entitled to the higher of the two.
10 The tax scales are indexed by the CPI. The Senior Australians Tax Offset is not indexed but the Age Pension rebate is indexed to the pension and the pension free area and people are entitled to the higher of the two.
11 The Treasury's estimate of the level of concessions uses a personal income tax benchmark. The estimate is published regularly in the Tax Expenditure Statements and the Budget papers; for 2002-03 it is projected at $10.3 billion.
12 Minimum award wages for full time adult work now exceed $20000 pa, which is the upper bound of the 18.5 per cent range.
13 For the `18.5+31.5' case there is also a dip after 35 years related to the change in marginal tax rate.
14 Some limited number of persons previously earning higher annual salaries and now revert
ing, say to part time work, may have reached the ETP tax-free limit.
15 The differential in entry fees used is 1 per cent of the amount invested for the balanced portfolio, with the investment outside superannuation paying the higher fee. For the fixed term portfolio, the differential used is zero, as many fixed term investments are readily available without entry fees; for the all shares portfolio, including overseas shares, the differential used is 2 per cent.
16 Assuming 30 per cent contributions tax (including surcharge) plus 16.5 per cent ETP tax, the correct maximum effective tax rate, ignoring earnings, is 41.6 per cent (compared with the 48.5 per cent personal income tax marginal rate).