Heather Smith, Garth Day, Brian Thomas and Luke Yeaman1
China’s economic rise is increasingly affecting East Asian growth and trade. This article discusses the changing patterns of the region’s trade and considers whether business cycles in East Asian economies have become more synchronised. We find that China’s main impact to date has been through its role in driving intra-regional trade but we are unable to identify the relative influence of China from the many other factors powering East Asian growth.
Nonetheless, over time, China will play an increasingly larger role in the global and regional economy, resulting in some economies becoming dependent on China’s economic cycle. This presents both challenges and opportunities, providing an incentive for countries to persevere with economic and institutional reforms to take advantage of China’s emergence and to minimise the associated adjustment costs.
Introduction
A striking feature of East Asian growth in recent years has been the increasing role of China’s economy in regional economic activity and the significant shift in the pattern of East Asia’s trade.2 This article discusses these trends and assesses the extent of change in the economic linkages between the economies of East Asia, particularly China, and the rest of the world. While we focus on trade, this is just one of the drivers behind East Asian growth.
With trade flows being increasingly the channel through which developments in China could spill over to other economies, we discuss the implications for the region of a slowing in China’s economy. The article concludes by raising some policy implications that flow from a region characterised by increasing economic interdependence.
Shifting sources of growth
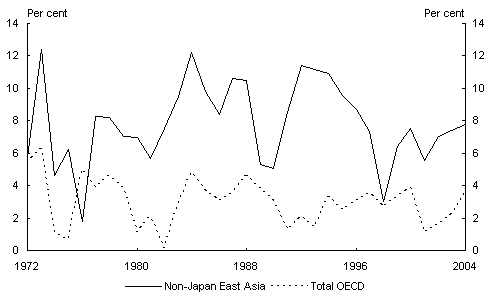
East Asia’s post-war growth experience can be characterised as one of market-oriented reform and openness to the global trading system. For several decades, demand from industrialised economies, especially the United States, acted as a key source of growth for East Asia, especially for the Newly Industrialised Economies (NIEs — Korea, Taiwan, Singapore and Hong Kong) (Chart 1). Japan emerged as a source of regional demand and global growth from the 1960s onward through to the early 1990s, when Japan’s strong rates of growth (averaging 10per cent per annum) saw its trade and investment linkages to East Asia intensify.
Chart 1: East Asian and OECD GDP
Source: IMF World Economic Outlook Database and OECD.
Until the Asian crisis, macroeconomic stability in the face of external shocks was a key feature of East Asia’s growth. From the early 1970s, the external economic environment of developing countries was disrupted by the collapse of the Bretton Woods system, two massive oil shocks, world inflation, strong cyclical movements in real economic activity, high interest rates and the accumulation of large international debts. On the whole though, East Asian economies adjusted more flexibly and achieved better macroeconomic performance than other developing countries (Treadgold 1990).
Rising trade tensions with the United States, combined with domestic structural pressures, saw the NIEs undertake substantial structural reform in the 1980s and begin to focus more on domestic demand as a source of growth. A distinguishing feature of the region’s development from the late 1980s was the increased economic interdependence between Hong Kong, Taiwan and parts of mainland China. Trade and investment flowed between these economies which, at different stages of development, sought to take advantage of complementarities in factor endowment and technological capacity (Smith 2000). At the same time, rising costs of production saw Japanese firms relocate labour-intensive production to the ASEAN4 (Indonesia, Thailand, Philippines and Malaysia).
The Asian crisis saw Japan’s economic and financial linkages with the rest of the region weaken dramatically as foreign direct investment and bank lending fell, although for several economies Japan still remained the second- or third-most important trading partner.3
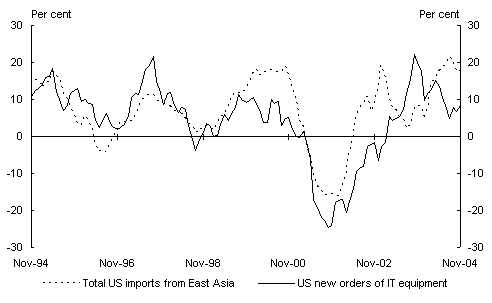
At the same time, the IT boom in the United States gave rise to intra-industry specialisation and for major IT exporters — Singapore, Korea, Taiwan, Malaysia and increasingly China — United States IT investment became an important driver. The result has been a heavy concentration of IT goods in East Asian trade and an increased synchronisation between indicators of United States demand for IT goods and East Asian exports (Chart 2).4 This period also coincided with two key developments — China’s increasingly central role in regional supply chains and production networks, and the associated rise in intra-regional trade.
Chart 2: East Asia’s exports and United States IT cycle
(percentage change, through the year)
Source: Datastream.
Changing patterns of trade
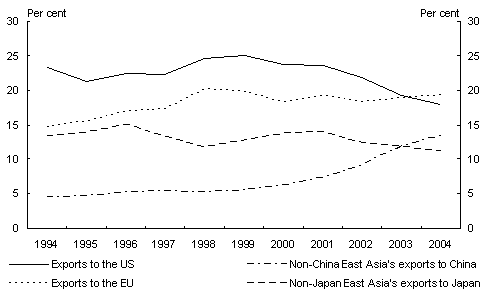
Before the Asian crisis, East Asia’s trade was dominated by demand from outside the region, particularly from the United States. Since the late 1990s, the pattern of East Asia’s exports has undergone significant change — East Asia’s exports to the United States as a share of total exports have fallen to be less than 20 per cent, the European Union has become the region’s largest export market and, in 2003, China overtook Japan as East Asia’s main regional export partner. On current trends, China will likely become the region’s main export market within the next few years (Chart 3).
Chart 3: Share of East Asia’s exports by destination
Source: CEIC and Datastream.
Note: Data for Korea and the Philippines are only available to November 2004, and to September2004 for Indonesia.
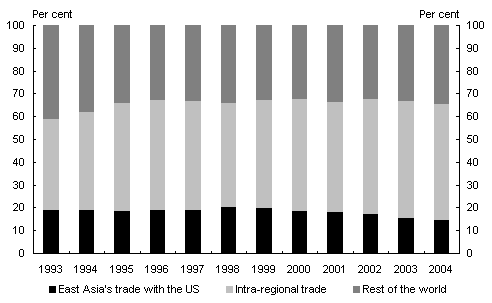
These trends by and large reflect a shifting of the region’s trade profile associated with a rise in intra-regional trade (Chart 4). Intra-regional trade has been on a rising trend since the mid-1980s and recently has been increasing at a faster rate than East Asia’s trade with the rest of the world.
Chart 4: Share of East Asian total trade (exports and imports)
Source: CEIC and Datastream.
Intra-regional trade has been market-led, driven by a combination of unilateral reforms, implementation of WTO commitments, and the rise in cross-border processing and assembly related to global demand.
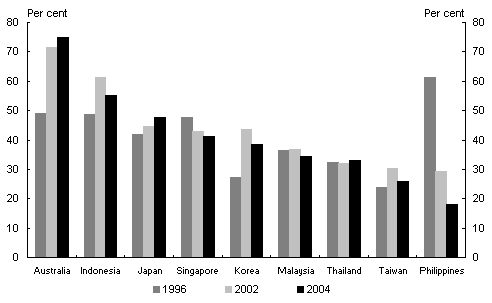
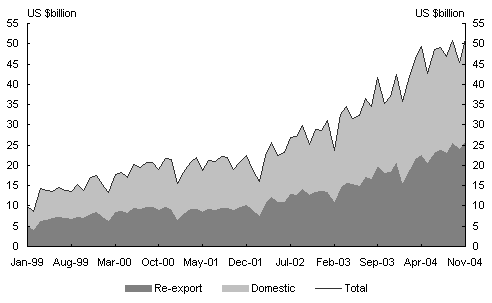
However, an increasing portion of intra-regional trade comes from the growing importance of regional domestic demand, including from China. Chinese customs data suggests around half of imports to that country are now for domestic use, with a relatively larger proportion of such imports being sourced from Australia and East Asia (Charts 5 and 6).
Chart 5: China’s imports for domestic use
as a proportion of total imports
Source: Chinese General Administration of Customs.
Chart 6: China’s imports by use
Source: CEIC.
Is East Asia decoupling?
Concordance of GDP cycles
As discussed above, the pattern of East Asia’s trade points to growing regional trade interdependence, in large part fuelled by China’s economic development. With strong trade relationships potentially affecting cross-country synchronisation of business, we assess the degree of concordance between business cycles in East Asia, the United States and Europe in an attempt to identify more formally changing patterns over time.5
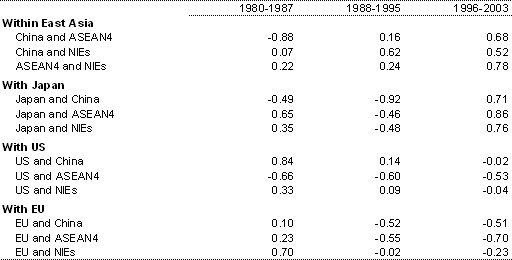
Annual real GDP data were collected starting in 1980 for six major regions: the United States, the European Union, Japan, China, the NIEs and ASEAN4. GDP was decomposed into a trend and a cyclical component, with the latter representing the business cycle.6 Correlations were then calculated between pairs of business cycles over three time periods (1980 to 1987, 1988 to 1995 and 1996 to 2003). Correlations close to 1 suggest a high level of concordance between business cycles, while correlations closer to 0 suggest lower levels of concordance. Negative correlations suggest that business cycles move in opposite directions.
Table 1: Correlations in East Asian business cycles
Sources: CEIC Database, IMF WEO Database and Australian Government Treasury calculations.
Table 1 shows that GDP cycles in East Asia are more highly correlated with one another than with the United States or European Union. In particular, the business cycles of the NIEs and the ASEAN4 exhibit high levels of correlation with each other and with that of China in the most recent period, after showing low levels of correlation in the early 1980s.
Japanese growth has also shown high levels of correlation with the business cycles of non-Japan East Asia in the most recent period, following a period of instability in the early 1990s, possibly reflecting the end of the bubble economy in 1990.
Historically the business cycle of the ASEAN4 has been more highly correlated with Japan’s output growth, than with that of the United States and European Union. However, business cycle correlations between the NIEs and the United States and European Union, which have traditionally been strong, appear to have become less synchronised over the last two decades. The negative correlation between East Asia and the United States in the final period is somewhat surprising, perhaps reflecting in part the impact of the United States recession in 2001.
As is apparent from the above discussion, these results are subject to a number of caveats. Caution is required in interpreting changing correlations as indicating changing structural dependence. The presence of increased correlation between regional business cycles does not necessarily mean that heightened trade flows are the cause. A number of significant shocks have affected East Asia over the last time period— including the Asian financial crisis, the bursting of the IT bubble and the decade-long weakness of Japanese growth — which may also be responsible for changing correlations.
Commonality of business cycles
While correlations of output are useful in understanding the degree of synchronisation, they are a simple single-dimension indicator of business cycle concordance. In this section we extend the analysis to focus on whether there exists commonality among the GDP growth rates of a group of economies, with a particular focus on East Asia. Latent factor analysis is used here to determine the extent to which fluctuations in output are associated with worldwide, regional, or country-specific factors both before and after the Asian crisis.7 The specification of the model is as follows:
![]()
where ![]() is the growth rate of GDP in country
is the growth rate of GDP in country ![]() . The factor,
. The factor, ![]() , represents the common element of
, represents the common element of ![]() across all economies and is referred to as the world factor. The world factor affects all economies with the response to that factor,
across all economies and is referred to as the world factor. The world factor affects all economies with the response to that factor, ![]() , differing between economies. The factor
, differing between economies. The factor ![]() represents the regional factor for the subset of economies covering Japan and the NIEs; with
represents the regional factor for the subset of economies covering Japan and the NIEs; with ![]() the response of each economy in this regional grouping to the regional factor. The factor
the response of each economy in this regional grouping to the regional factor. The factor ![]() represents the unique, or idiosyncratic, element of
represents the unique, or idiosyncratic, element of ![]() to each economy and is referred to as the country-specific factor. The parameters for these factors,
to each economy and is referred to as the country-specific factor. The parameters for these factors, ![]() , are estimated from second moment conditions using Generalised Method of Moments (GMM) assuming that all factors are independent and with factor variances normalised.
, are estimated from second moment conditions using Generalised Method of Moments (GMM) assuming that all factors are independent and with factor variances normalised.
Understanding the sources of international economic fluctuations is important for both developing business cycle models and making policy. As such, the theoretical framework of these undertakings should capture the degree to which the variation in activity among a group of economies with different policy settings, institutions and economic structures is explained by a world or regional business cycle. The importance of including a world factor is that subsets may lead to observed co-movement that may in fact be common to a larger group of countries.8
The results of this analysis, presented in Appendix A, suggest that while there are patterns of commonality within the region there is also evidence of important linkages outside the region. Another recurrent theme is the trend toward domestic factors dominating the variation in GDP growth for Japan and China in the post-crisis period. In particular, before the Asian crisis, Japan shared a high degree of commonality with the NIEs. Following the Asian financial crisis domestic factors dominated. And while China shared a higher degree of variation in GDP growth due to the common factors before the crisis, we find that domestic factors become more prevalent in the post-crisis period.
China as a future driver of regional growth
China’s economy has been growing at
an average annual growth rate of over 9percent since it began to open up and reform its economy in 1978. In 1995, China overtook Japan to become the world’s second largest economy after the United States in purchasing power parity terms.9 If both countries maintain their average growth rates, China will overtake the United States as the world’s largest economy in about a decade.
Since 1978, China’s international trade has expanded more rapidly than any other country, even through periods of exceptional growth in the rest of East Asia, North America and Australasia (Garnaut 2003). Since 1993, China’s share of world exports has risen from 2.5per cent to be currently more than 6 per cent, while a range of reforms, including tariff reductions and entry in the WTO, have seen its share of imports over the same period grow from 2.8 per cent to be close to 6 per cent.
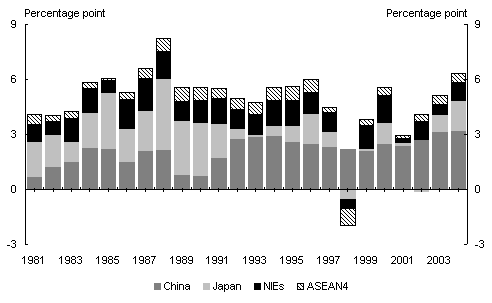
China’s economic reform and increasing openness has been a positive shock to the region — in recent years, China has accounted for well over half of East Asia’s total GDP growth (Chart 7). In the same fashion, a hard landing in China would adversely affect the region’s economic performance. A significant reduction in Chinese GDP growth would reduce world and regional GDP in a direct sense, and it would lead to reduced exports and investment in exporting industries in a number of countries.
Chart 7: Contributions to East Asia’s GDP growth
Source: IMF World Economic Database and CEIC.
Impact of a Chinese slowdown
Trade flows are increasingly becoming the key channel through which developments in China are transmitted to other economies. When analysing which countries are most exposed to a slowdown in China, it is important to determine whether China’s imports from a particular country are for re-export or domestic use. This is because imports for re-export are mostly dependent on demand in the United States and other industrial markets, while imports for domestic use are more influenced by growth in China’s domestic demand. As shown earlier in Chart 5, over 70 per cent of China’s imports from Australia and around 40 per cent of China’s imports from Indonesia, Japan Singapore and Korea are for domestic use, suggesting that these countries could be most exposed to a slowdown in China’s growth.
The IMF (2004) recently attempted to quantify the impact that a slowing in China’s growth may have on other countries, using a basic trade-flow framework. In their analysis, it was assumed that growth of Chinese imports for domestic use would decline by 10 percentage points (imports for processing and re-export were unaffected). This fall in imports, and the eventual fall in China’s GDP growth of around 4percentagepoints, was estimated to cause a 0.4 percentage point decline in the rest of East Asia’s GDP growth. In the concurrent 12-month period, the estimated impact on GDP growth was highest in the NIEs, down 0.6 percentage points, and lowest in the ASEAN4, down 0.3percentagepoints. Japan’s GDP growth was estimated to fall by 0.5percentagepoints.10
General equilibrium models can provide additional insights regarding the impact of a Chinese slowdown on the rest of East Asia. The key benefits of these models over partial-equilibrium analysis is that they: accommodate non-trade transmission channels, such as capital flows; capture secondary impacts of slower growth in each economy on the other economies in the region; and, allow for offsetting policy adjustments by affected economies.
In recognition of these benefits, the IMF used its new Global Economy Model (GEM) to conduct a simulation of the same order of magnitude as in the partial analysis above.11 Of the four regions in the model — the United States, Japan, non-Japan Asia, and the rest of the world — Japan was found to be most affected. The United States and the rest of the world were only marginally affected. However, even the estimated impact on Japan was less than what the IMF’s partial-equilibrium analysis suggested because of offsetting real exchange rate changes. Details of the exact magnitude for each region were not provided.
McKibbin and Stoeckel (2004), using the Asia-Pacific G-Cubed Model, have also analysed this issue. In their analysis, a sharp slowdown in the Chinese economy was modelled through a policy-induced reduction in investment. Results suggest that such a slowdown may actually benefit other countries in the region. This occurs because the negative trade effects are mitigated by real exchange rate changes and are outweighed by beneficial financial effects — foreign direct investment previously destined for China now goes to other countries in the region.12
However the actual impact may be greater than estimated. Both the GEM and the Asia-Pacific G-Cubed Model most likely underestimate the negative impact that a significant Chinese slowdown would have on the region. One reason for this underestimation is that the model’s parameters may not adequately reflect China’s current importance to the region. That is, econometric analysis, on which some of these parameters are based, will not yield precise estimates of key elasticities, partly because of ongoing structural change. For example, China’s income elasticity for imports is likely to have increased over time in line with its greater openness and recent entry to the WTO, making it difficult to estimate the current elasticity from historical data.
A second reason why these models may underestimate the impact is that they may not capture all the channels through which a Chinese slowdown may spill over to other countries. Although they are superior to partial-equilibrium analysis in this regard, the models do not pick up confidence effects, and they may not fully capture the impact that China’s rising demand has on particular markets and prices.13
Policy implications
So far China’s economic performance and its global impact are in line with what was observed in previous waves of rapid integration involving first Japan and subsequently the NIEs. However, China’s vast pool of labour, low per capita income and ongoing commitment to reform and opening mean it could sustain high rates of GDP growth for many years yet. This would see China eventually playing a much larger role in the global economy than any previous integration episodes (IMF, 2004).
China’s economy could eventually present a larger shock to world factor endowments and to the global economy than previous integration episodes, implying a major impact on certain sectors and regions (IMF, 2004). For instance, China’s demand for agricultural and mineral-intensive goods will continue to rise and its impact on commodity markets and prices will only increase as the economy continues its process of industrialisation and urbanisation.
China is already the world’s biggest consumer of many commodities, such as steel, copper, coal and cement, and is the world’s second-biggest consumer of oil. As an illustration of China’s impact on commodities, over the period 1998 to 2003 China was responsible for 55 per cent of the world’s increase in coal consumption and 56 per cent of the increase in steel production (Chart 8).
Chart 8: China’s share of world increments, 1998-2003
Sources: BP and IMF WEO September2004.
Note: All commodities are internationally recognised volume measures. GDP is nominal and is calculated by weights based on market exchange rates.
Australia is well-placed to benefit from China’s growth, given China’s energy needs and still low share of global energy and agricultural imports compared to Japan during its rapid growth phase (Charts 9 and 10). China’s share of global labour-intensive exports has recently surpassed Japan’s peak of the mid-1960s but is still below that of the NIEs in the mid-1980s. At the same time, China has considerable scope to move up the value-adding chain, presenting competitive challenges for those economies whose factor endowments are similar to China’s (Charts 11 and 12).
Chart 9: Share of world mineral-intensive imports
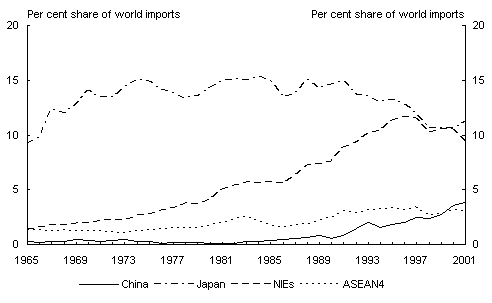
Source: ANU, International Economic Database.
Note: Mineral-intensive goods are based on an SITC classification defined by Phillips (1984).
Chart 10: Share of world agricultural-intensive imports
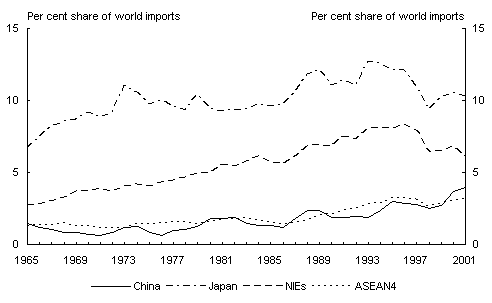
Source: ANU, International Economic Database.
Note: Agriculture-intensive goods are based on an SITC classification defined by Phillips (1984).
Chart 11: Share of world labour-intensive exports
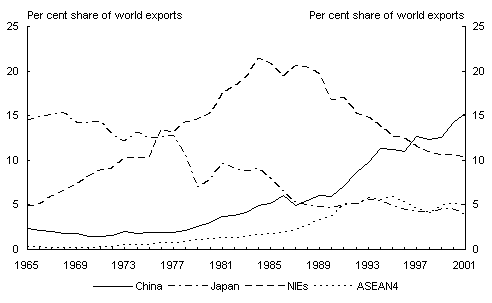
Source: ANU, International Economic Database.
Note: Unskilled-labour-intensive goods are based on an SITC classification defined by Phillips (1984).
Chart 12: Share of world human capital and technology-intensive exports
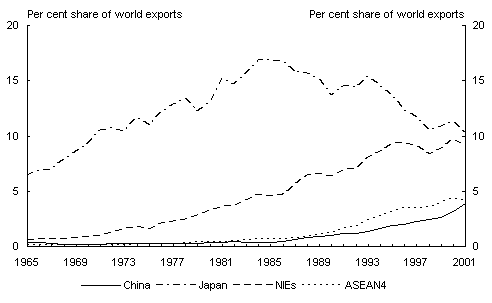
Source: ANU, International Economic Database.
Note: Human capital and technology-intensive goods are based on an SITC classification defined by
Phillips (1984).
China’s growth and integration into the regional and global economy implies that its business cycle might begin to have a larger impact on East Asia’s and Australia’s business cycles. On the one hand, the growing economic interdependence within East Asia could see the region sustain its growth even as the rest of the world slows. Yet greater regional interdependence also makes East Asia more vulnerable to a slowdown in China than in the past (Goldman Sachs, 2004). And the magnitude of the reform task facing China means that it is unrealistic to expect the transition to take place without disruptions to growth which, in turn, will affect other economies.
Given the increased interdependency of growth in the region, policy approaches that enhance regional economic policy dialogue and surveillance will become increasingly important. This will be particularly so as China continues to open its financial markets and its global and regional financial linkages deepen.14 And the high degree of GDP cycle concordance implies East Asian economies will increasingly face similar macroeconomic conditions.
China’s role as a driver of intra-regional trade suggests its impact as a regional engine of growth could soon become larger than Japan’s (IMF, 2004). It is important to remember though that the United States is still the most important trading partner for several East Asian countries and will remain a significant source of foreign investment finance and technology transfer. This reliance suggests initiatives to deepen regional economic cooperation need to be designed not to disrupt the economic and financial links with countries outside East Asia (Frischtak and Haddad, 2003).
Policies that ensure more balanced sources of growth between external and domestic sources of growth will also be important. In particular, China’s growth provides additional incentive for countries to persevere with economic and institutional reforms. Those that compete most directly with China will need to display considerable flexibility in their product and labour markets in order to minimise the transition costs and maximise the opportunities from China’s growth. The opportunities flow from the growth of a major export market for the rest of the region, lower priced imports, and increasingly, China’s own domestic demand and investment.
References
Backus, D, Kehoe, P & Kydland, F 1992, ‘International real business cycles’, Journal of Political Economy, 100, pp. 745-75.
BP 2004, Statistical Review of World Energy.
de Brouwer, G & Dungey, M 2004, ‘Revealed commonality: linkages in consumption, investment and output in East Asia’, Exchange Regimes in East Asia, de Brouwer, G & Kawai, M (eds), pp. 103-152, RoutledgeCurzon, London.
Frischtak, A & Haddad, M 2003, ‘Regional trade arrangements in East Asia’ Background paper prepared by the World Bank for the APEC Finance Ministers Meeting, September 2003; drawn from Yusuf, Shadid et al 2003, Innovation in East Asia: The Future of Growth, Oxford University Press, New York; and Schiff, M & Winters, A 2003, Regional Integration and Development, World Bank and Oxford University Press.
Garnaut, R 2003, ‘China: new engine of world growth’ in Garnaut, R & Song, L (eds) China: new engine of world growth, pp. 1-18, Asia Pacific Press, Canberra.
Goldman Sachs 2004, ‘Is Asia decoupling from the global cycle?’, Global Economics Weekly, Issue 04/21, 26th May 2004,
IMF 2004, World Economic Outlook, September.
Imbs, J 2003, ‘Trade, finance, specialisation and synchronisation’, International Monetary Fund Working Paper No. 03/81, April.
Kose, A, Eswar, M, Prasad, S, & Terrones, M 2003, ‘How does globalisation affect the synchronisation of business cycles?’, International Monetary Fund Working Paper No.03/27, January.
Kose, A, Ortok, C & Whiteman, C 2003, ‘International business cycles: world, region, and country specific factors’, American Economic Review, 93 (4), pp. 1216-1239.
Kose, A & Yi, K 2002, ‘The trade comovement problem in international macroeconomics’, Federal Reserve Bank of New York, Staff Report No. 1555, December.
McKibbin, W & Stoeckel, A 2004, ‘China: the implications of the policy tightening?’ Economic Scenarios, 8, June, http://economicscenarios.com.
Phillips, P 1984, ‘ASEAN merchandise trade with the Pacific Basin: factor composition and performance’, Pacific Economic Papers (116), Australia-Japan Research Centre, Australian National University, Canberra.
Smith, H (ed.) 2002, The Economic Development of Northeast Asia, Edward Elgar, UK.
Steel Statistical Yearbook 2003, International Iron and Steel Institute, Committee on Economic Studies, (2004)
http://worldsteel.org/media/ssy/iisi_ssy_2003.pdf
Treadgold, ML 1990, ‘Macroeconomic management in Asian-Pacific developing countries’, Asian-Pacific Economic Literature, 4 (1), pp. 3-40.
Appendix A
Table A1 presents the proportion of the variation in GDP growth for each country that is attributable to a common ‘world’ factor, a regional factor and its own idiosyncratic behaviour.15 For instance, in the period before the Asian crisis, Japan shared virtually no common variation in GDP growth with the other economies in the model and neither did the European Union nor the NIEs. The regional grouping of Japan and the NIEs produces some interesting results, with around 75 per cent of the variation in Japan’s GDP growth sharing a common element with the NIEs. In contrast, the NIEs do not appear to share much of a common element with Japan but rather are dominated by domestic factors which account for around 93per cent of the variation in their GDP growth.
Table A1: Variance decomposition of model I, world and regional factor16

Note: Imposing a break in the series has limited the period of analysis and requires the use of quarterly data which is inherently more volatile than annual data. As such, the results are not representative of commonality of business cycles at longer intervals nor are they an indication of commonality in growth cycles.
In the post-crisis period, domestic factors dominated the variation in Japan’s GDP growth, accounting for around 93 per cent. Australia also had a divergent pattern of growth from the common world factor, although for very different reasons, with domestic factors accounting for around 85per cent of the variation in GDP growth. In contrast, the NIEs show more commonality with both the common world factor and the regional factor, which combined account for around 85 per cent of the variation in their GDP growth. A large proportion of the NIEs’ world factor might be a common element with the United States.
A comparison of these results is made with the simple two factor model presented in Table A2, which combines the world and regional factor into a single common factor. This approach allows us to check the robustness of the results of model I and provides a benchmark to interpret the simple two factor models presented below.17 Japan’s and Australia’s cycle are dominated by domestic factors after the Asian crisis.
Table A2: Variance decomposition of model II, a simple two factor model

Table A3 reports the results including China. The proportion of the variation in China’s GDP growth which shares a common element with the other economies in model III is about 42 per cent in the first period, and around 23 per cent in the second period. In the first period, the proportion of the variation in GDP growth due to a common element is higher for Japan but lower for the United States and Australia, compared to the results of model II. In the post-crisis period, the United States and European Union experience a stronger common element while Japan and Australia remain dominated by stronger domestic factors. When China is included, the common factor for the United States and European Union rises while that for the NIEs falls.
Table A3: Variance decomposition of model III, including China18

The final model, presented in Table A4, focuses on the regional grouping of China, Japan, the NIEs and Australia. The variation in output growth among these economies is broadly consistent with the results of model III, with China’s common factor following the Asian crisis remaining relatively weak. The common factor for the NIEs is also lower than the results presented in previous models. This may reinforce the findings from model I, that the variation in output growth among the NIEs has become more aligned with fluctuations in output growth not only among the larger economies in the region, but also the United States and European Union.
Table A4: Variance decomposition of model IV, a regional perspective

1 The authors are from Macroeconomic Group, the Australian Government Treasury. We are grateful to Brenton Goldsworthy and Sarah Gurr for their contributions on China. This article has benefited from comments and suggestions provided by Martin Parkinson, Gordon de Brouwer, PhilGarton and John Hawkins. The views in this article are those of the authors and not necessarily those of the Australian Government Treasury.
2 East Asia is defined to include China, Hong Kong, Indonesia, Japan, Korea, Malaysia, Philippines, Singapore, Taiwan and Thailand.
3 Bank credit from Japan to East Asia is still around 30percent below what it was in 1996 and is well below the levels of the late 1980s. Europe and the United States are the major recipients of Japanese foreign direct investment (FDI) accounting for 65percent of the total Japanese outflow in 2003-04. East Asia received 18percent of Japanese FDI outflows over this period, with half, that is, 9percent of the total, flowing to China.
4 Around 40 per cent of East Asian exports are IT goods, with China’s share of total EastAsian IT exports more than doubling from around 12 per cent in 2000 to over 30 per cent in 2004. Whether the current slowdown in IT demand reflects broader weaknesses or IT-specific factors is unclear. Still, demand for IT goods will continue to be an important driver of East Asian exports.
5 In particular, intense bilateral trade will tend to accompany highly correlated business cycles in a wide range of theoretical models, ranging from multisector international models with intermediate goods trade to one-sector versions with either technology or monetary shocks (Imbs, 2003). See Backus et al (1992), Kose and Yi (2002), and Kose, Eswar et al (2003) for a discussion about the theoretical impact of increasing trade and financial integration on business cycle concordance.
6 A Hodrick-Prescott filter was used to decompose GDP into a trend and cyclical component. The default setting of 100 for annual data was chosen for the smoothing parameter.
7 The econometric model used is based on a simple two factor model by de Brouwer and Dungey (2004) and extended to include a regional factor to analyse the linkages between economies while taking account of a common world factor. Estimation is carried out using a panel of quarterly GDP growth data.
8 Kose, Otrok and Whiteman (2003) find a distinct world business cycle which accounts for a significant fraction of output growth in many countrie
s.
9 China is the seventh-largest economy in the world when GDP is compared across countries using market exchange rates.
10 However, exports to China account for only 0.3 per cent of Japan’s nominal GDP. Exports to China are a higher share of GDP for Singapore (11.1 per cent), Taiwan(7.5percent), Malaysia (6.2 per cent), Korea (5.8percent) and Australia (1.2per cent).
11 See IMF (2004).
12 This surprising result is partly an outcome of the way the shock was implemented. However, implementing the shock in other justifiable ways produces only a small negative effect that is substantially milder than what the IMF’s general and partial-equilibrium analysis suggests. This is due to strong offsetting exchange rate movements and policy responses, in addition to financial effects.
13 The recent focus by financial markets on whether China’s economy was overheating is indicative of the increasing impact China’s economy will have on global and regional sentiment. For example, when Chinese Premier Wen Jiabao spoke of the need to slow the Chinese economy on 28 April 2004, the following day stock prices fell around the world.
14 This article has not considered the impact of financial linkages due to the difficulty of obtaining data. However, contagion effects that are transmitted through financial linkages clearly could result in cross-country spillovers of macroeconomic fluctuations and a high degree of synchronisation by generating large demand side effects. Financial linkages generally are more important, in terms of business cycle transmission and correlations with global output, for economies that are more open to capital flows.
15 Note that the inclusion of the United States and the European Union provides this model with a representative world factor. In aggregate, the economies selected in this model account for around 50 per cent of world GDP on a purchasing power parity basis and around 75 per cent based on market exchange rates. The data are from the CEIC database except for Australian data (which are from the ABS database) and the US data (which are from the OECD quarterly national accounts database).
16 The Asian crisis is commonly referred to as beginning in the June quarter 1997 and lasting through the first half of 1998. However, with the exception of Thailand, aggregate GDP growth rates of the affected countries were not significantly affected, measured at the 95percent confidence level, until the March quarter 1998. The data used here reflect this.
17 The results for the European Union between these models are consistent and the proportion of variation in United States GDP growth is consistent across both time periods, supporting a reasonable baseline of comparison between not only these models but also the time periods examined.
18 The GDP data used for China is a quarterly series interpolated from a through-the-year series published by the National Bureau of Statistics of China, sourced from the CEIC database.
