Robert Ewing and Bryn Battersby1
Australia is (with New Zealand) one of the two most remote advanced economies in the world in terms of average distance from world economic activity. The rapid economic growth of countries in the Asian region in recent decades has resulted in only a modest reduction in Australia’s level of remoteness. This remoteness has direct effects on Australia’s trade performance. Overcoming the natural barrier to trade created by Australia’s location may require greater efforts than those of most other countries to promote trade and the economic benefits that come from international engagement.
Is there still a ‘tyranny of distance’?
The growth of communications technology, and Australia’s increased openness to trade, have led to claims that the years of Australia as an economy suffering from the ‘tyranny of distance’ are now over. In addition, the rapid growth of some countries in Asia means a greater share of global economic activity now occurs within Australia’s region. But while these factors may help, Australia’s geographic position is likely to remain an important determinant of economic performance.
One argument commonly made is that increasingly exports of services will allow Australia to overcome the effects of geographic remoteness. Thanks to advances in information and communication technologies, many services can be provided to overseas companies or consumers as easily from Australia as from the United States. But while these technologies and services may become significant in the future, at present exports of services that are independent of distance still account for only a small proportion of Australia’s international trade.
Exports and imports of physical items still account for the vast majority of Australia’s international trade in goods and services. In 2003-04 physical goods accounted for nearly 80percent of both exports and imports.2
Even within services exports, distance remains an important factor. Included within the services measure in the balance of trade are such items as spending on shipping of goods, airline fares, tourism and so on — items that probably experience a greater distance effect than many physical goods. Spending on these transport, shipping and travel items made up around 70percent of services imports and exports in 2003-04. This means services unaffected by distance comprise only around 6percent of total imports and exports.3 While this percentage has grown over time for exports (from around 4percent in the early 1980s), it still represents only a small fraction of Australia’s international trade. And this group includes many items that experience distance effects as well, albeit of a different form, for example consultancies where the company sends representatives to overseas sites to advise.
Another argument made for the reduction of the tyranny of distance is that international trade of goods and services has become cheaper thanks to the introduction of more advanced shipping technology, such as containerisation. More efficient transport should lead to lower transport costs and increased trade. Evidence for this is somewhat mixed. Coe, et al (2002) discuss this evidence, finding that while there has been a reduction in the measured effect of distance on international trade in goods and services, this reduction has been small. Even if there is a benefit from reduced costs of transportation, this may not improve Australia’s relative position as all countries benefit from these reduced costs.
All these factors suggest that the overall effect of distance remains significant for Australia, and will continue to be so for the foreseeable future.
Measuring remoteness
Understanding the nature, effect and changes in Australia’s economic remoteness requires some way of measuring remoteness. The principal difficulty in constructing such a measure is that remoteness depends not just on how far Australia is from other countries, but also on the level of economic activity taking place in each other country.
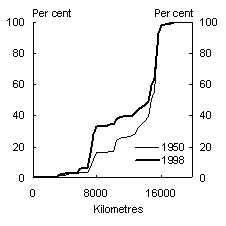
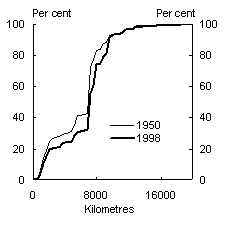
A simple approach to measuring remoteness is to look at what percentage of world GDP is within so many thousand kilometres of Australia or any other country of interest.4 Chart 1 below shows this picture for Australia and the United Kingdom for 1950 and 1998.
|
Chart 1: Distance to the World’s GDP from Australia and the United Kingdom |
|
|
Australia(a)
|
United Kingdom(a)
|
- These charts show the percentage of world GDP (measured in purchasing power parity terms) falling within circles of different radii (from 0 to 20,000 kilometres) from either Sydney or London.
Source: Australian Government Treasury calculations based on data from Maddison (2001).
Australia is clearly much more remote than is the United Kingdom. In 1998, 94percent of world economic activity was within 10,000 kilometres of the United Kingdom, but only 34percent of the world economy was within 10,000 kilometres of Australia.
Chart 1 also shows that the growth of Asia has reduced Australia’s remoteness by a modest degree in recent decades. While the picture for the United Kingdom is largely unchanged between 1950 and 1998, the percentage of world GDP within 10,000kilometres of Australia has doubled since 1950.
Chart 1 is not a complete picture of how things have changed in the period since World War II. The world’s economy has grown markedly in real terms, from around $9,000 billion in 1950 to $56,750 billion in 1998.5 So in real terms the amount of economic activity within 10,000 kilometres of Australia has grown from slightly over $1,500billion in 1950 to $19,500 billion in 1998 — more than twice the total world GDP in 1950.
But the important story about Australia’s remoteness is about the relative level. While the economies within 10,000 kilometres of the United Kingdom grew by a factor of around 6over those 48 years, those within 10,000 kilometres of Australia grew by a factor of over 12. This represents a substantial shift of the world economy towards Australia in relative terms, but also underlines Australia’s continued remoteness.
While the diagram in Chart 1 is a simple and useful way to compare two countries or two time periods, in reality there are many countries to consider. Further, while an approach that looks at the amount of GDP within 10,000 kilometres of the country does allow for comparisons between many countries at once, it is a very limited measure as it doesn’t differentiate between situations where two countries are 100 kilometres or 9,000kilometres apart.
A more comprehensive
measure of remoteness needs to summarise both the distance and economic weight for every other country. There are several ways to construct such a measure, but perhaps the most useful measure is to take a weighted average of the distance from each country.6 This average could be thought of as how far away the rest of the world would be if the entire world’s GDP were in a single country. This approach provides a measure which allows comparison between a country’s remoteness and the remoteness of other countries, or the remoteness of that country in a previous time period.
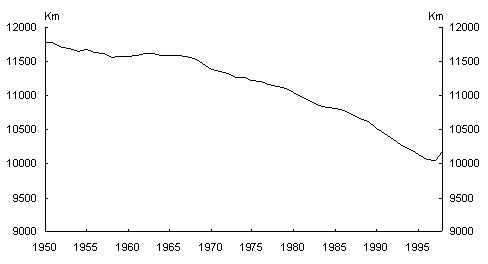
Chart 2 shows how this measure of distance to the rest of the world GDP has changed for Australia since 1950. The chart shows a substantial fall in remoteness over the period, with the fall accelerating sharply after 1970. The small tick upwards in 1998 is related to the impact of the Asian financial crisis, which affected the GDP of several of the countries that are relatively near to Australia.
Chart 2: Distance to the rest of world GDP, Australia, 1950-1998
Source: Australian Government Treasury calculations based on data from Maddison (2001).
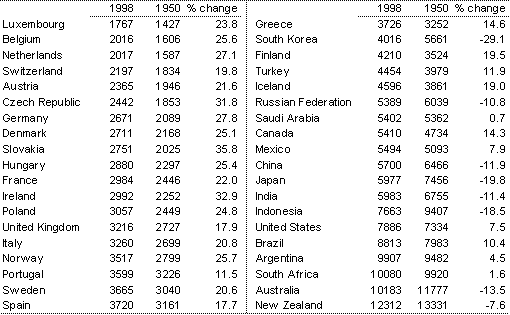
Despite this improvement, Australia is still relatively remote. Table 1 shows the distance to the rest of world GDP for the members of the OECD, as well as those members of the G20 which are not members of the OECD themselves. In 1998, out of these 38 countries, which together made up 85percent of world GDP, Australia is more remote than every country but one, New Zealand.
The advantage held by Europe is clear in Table 1. The twenty least remote countries are all in Europe, and the only non-European country less remote than a European country is South Korea (which benefits in this calculation from being a close neighbour of both Japan and China). One country that is notably remote is the United States, which is more remote than countries such as China, India and Indonesia.
Table 1: Distance (kms) to the rest of world GDP, selected countries, 1950 and 1998
Source: Australian Government Treasury calculations based on data from Maddison (2001).
Table 1 also shows the remoteness of the same group of countries for 1950, and the percentage change over those 48 years. All of the European countries have become more remote, by around 20percent, while those Asian countries in the group have generally become less remote. South Korea is particularly notable, with a 29percent fall in remoteness.
While Australia and New Zealand both experienced falls in remoteness, these falls were not unusually large compared to some countries in Europe. New Zealand remained the most remote country out of the group, and Australia remained the second-most remote (although the gap between Australia and the third-most remote country, South Africa, closed considerably).
But while Australia is still very remote, the advantage that other countries have has fallen substantially. The United Kingdom used to have an advantage of 9,000kilometres relative to Australia, which fell to less than 7,000 kilometres in 1998.
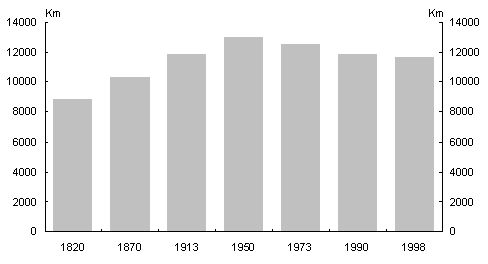
Looking at the picture of Australia’s remoteness prior to 1950 is difficult, as the data needed are not available for many countries. Chart 3 shows how Australia’s remoteness looks when measured using only the countries where data are available from 1820.7
Chart 3: Distance to the rest of world GDP, Australia
Source: Australian Government Treasury calculations based on data from Maddison (2001).
Chart 3 shows that the middle of the twentieth century was an important turning point in terms of Australia’s remoteness. From the early days of white settlement in Australia until just after World War II, Australia’s remoteness appears to have increased. This reflects the rapid growth experienced in Europe and the United States over that period, which tended to shift the balance of world GDP away from Australia. Since World War II, growth rates in those areas have slowed relative to the rest of the world, particularly Asia, and the balance of world GDP has begun to shift back towards Australia.
The important trend not captured by the calculations of remoteness above is the influence of technology, in particular technologies that reduce transportation costs such as air transport, containerisation or, looking back to the earliest days of Australia’s settlement, the introduction of steam ships over sail ships. So while the balance of world GDP was apparently more favourable to Australia in 1820 than in 1998, it is almost certain that the ‘cost’ of remoteness on all countries has fallen overall.
Australia became less remote over the past 50 years, as economic growth in the world has favoured the regions closer to us, in particular Japan and China. This fall in remoteness is likely to have positive effects for the economy, as discussed in the following section. Despite this improvement, Australia is still one of the most remote countries in the world, which poses important challenges for economic policy.
The effect of remoteness on Australia’s economy
Remoteness increases the natural protection afforded to industries within an economy because high transport costs limit trade in some or all markets. This means that remoteness may reduce the expected level of trade for Australia, as well as the expected level of productivity (by keeping market size smaller than otherwise). However, the obvious question is ‘to what extent is this the case?’.
A ‘gravity trade model’ provides a way to examine the role that remoteness has in explaining the level of trade for Australia. A gravity trade model relates the value of imports and exports between trading partners to the size of their economies and the distance between them, and allows the expected levels of Australian trade to be calculated.8
The predictions of one gravity model for Australia’s total trade are presented in Chart4. These predictions suggest that Australia moved from a point of underperformance with respect to trade in the early 1980s to a continued period of better than expected performance through the late 1980s and 1990s. Indeed, the model suggests that Australia’s level of trade has been above expectations that take account of Australia’s remoteness since about 1984.
The predictions of the gravity model also suggest that Australian trade levels were fairly resilient through the turbulent period of the later half of the 1990s. It was around this time that many of Australia’s nearby trading partners were struggling through the economic woes of the Asian financial crisis. This model suggests that Australia’s trade levels could have turned downwards much more sharply than they did. However, Australia’s actual aggregate trade levels were relatively stable through this period.
More interestingly, though, the gravity model allows exploration of a number of ‘what if?’ scenarios. For instance, what would be Australia’s expected level of trade if Australia were located where the United Kingdom is? Because this would place Australia closer to global economic output, the model suggested that, between 1980 and 2001, Australia
’s expected level of trade with the rest of the world would have been, on average, around 50 per cent greater each year. This gives an indication of the role that Australia’s remoteness plays in determining the extent to which Australia trades with the rest of the world.
Chart 4: Actual and predicted aggregate trade for Australia
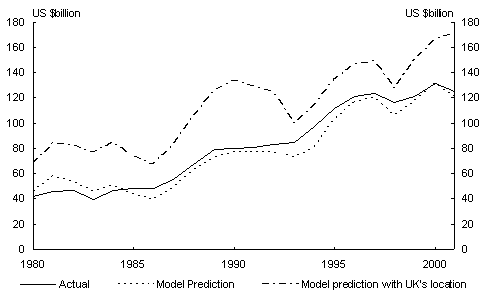
Notes: Predictions were calculated using a gravity trade model specified in Battersby and Ewing (2005). The model prediction with the UK’s location substitutes the Australian distance to bilateral trading partners and remoteness variable with the UK’s equivalent variables. Source: Battersby and Ewing (2005).
This natural disadvantage also has implications for the rest of the Australian economy. This was noted in the Commonwealth Treasury’s Budget Strategy and Outlook 2003-04:
‘Efficient resource allocation will lead to activities of the highest value being carried out. On the one hand, resources will be allocated to activities where distance is not a barrier or where Australia’s advantages are clear. For example, in some areas of mining and agriculture, and potentially some areas of the international trade in services. On the other hand, it also means that, to a greater extent than for many other countries, resources will be allocated to activities where distance confers natural protection by decreasing the competitiveness of imported goods or services.’ (pp. 4-22)
This effectively reinforces the importance of accounting for effects of economic remoteness when comparing Australia’s performance internationally and when defining appropriate policy options for Australia. It is unlikely that the costs of distance can ever be completely overcome and, because of this, it is probably necessary that those characteristics that make Australia unique continue to be evaluated at a policy level.
Conclusion
Australia is a very remote country. Among OECD countries, only New Zealand is more remote from the rest of the world’s economic activity than Australia. The rapid growth of countries in Asia in recent decades has helped to reduce this remoteness somewhat, but as even these countries are relatively far from Australia this improvement is limited.
Altering Australia’s remoteness and distance variables in a gravity trade model to reflect those of the United Kingdom highlights the tyranny of distance that is so often aptly remarked of Australia. Importantly, this suggests that while Australia does face challenges in its geographical location, Australia’s actual trade performance has improved relative to the model predictions since the early 1980s, reflecting the benefits of the wide range of macroeconomic and microeconomic reforms in Australia over recent decades, which have helped to counter the adverse effects of distance and transport costs.
This remoteness matters not only in the case of international trade, where the evidence suggest it is a very important factor, but also in the other benefits that flow from international trade. Openness to international competition and markets promotes productivity growth by encouraging firms to become more efficient, and expanding the range of technologies available to them. Remoteness creates a natural barrier to trade, and can block these benefits. As one of the most remote countries in the world, Australia may need to make more effort than most to overcome these barriers and make the most of international engagement.
References
Battersby, BD & Ewing, RJ 2005, ‘Gravity Trade Models, Remoteness, and Australia’s Trade Performance’, Treasury Working Paper in preparation, Australian Government Treasury, Canberra.
Coe, D, Subramanian, A & Tamirisa, N 2002, ‘The Missing Globalization Puzzle’, IMF Working Paper WP/02/171, International Monetary Fund, Washington DC.
Commonwealth Treasury 2003, ‘Sustaining Growth in Australia’s Living Standards’, Budget Paper No.1, Fiscal and Economic Outlook 2003-04, Statement 4, Commonwealth Government, Canberra.
Maddison, A 2001, The World Economy: A Millennial Perspective, Organisation for Economic Co-operation and Development, Paris.
Rose, A 2004, Macroeconomic Determinants of International Trade, NBER, New York, NY, viewed 27 January 2005,
http://www.nber.org/reporter/fall04/rose.html.
1 Domestic Economy Division and Macroeconomic Policy Division, Australian Government Treasury. We are grateful for comments and suggestions received from Graeme Davis, JohnHawkins, Paul O’Mara and Martin Parkinson. The views in this article are those of the authors and not necessarily those of the Australian Government Treasury.
2 Australian Bureau of Statistics, International Trade in Goods and Services, cat. no. 5368.0, November2004.
3 That is, services unaffected by distance make up only 30percent of services trade, which are themselves only 20percent of imports and exports.
4 GDP throughout is measured in purchasing power parity terms, which adjusts for the different price levels that can prevail in different countries.
5 Measured in 2002-03 Australian dollars.
6 Details on the methodology for calculating these numbers can be found in Battersby and Ewing (2005).
7 A disproportionate number of countries close to Australia are excluded. Hence the remoteness calculated will tend to be overstated. It excludes several countries that have grown relatively rapidly since World War II, such as Malaysia, the Philippines, Thailand and so on. This bias is the reason why Australia’s remoteness in 1998 is higher in Chart 3 than that shown in Table 1.
8 Details on the gravity trade model used, its estimation, and the results are provided in Battersby and Ewing (2005). Further details on gravity trade models in general can be found in several sources, such as Rose (2004).
