Address to the ABE Forecasting Conference
By Dr Martin Parkinson, Executive Director, Macroeconomic Group, Australian Treasury
14 December 2004
By any measure the Australian economy has performed very well over the last decade, largely due to a series of economic reforms since the early 1980s that have delivered improved macroeconomic stability and allowed us to raise productivity closer toward the world’s best. But there remain significant medium-term challenges involved in maintaining this performance and closing the productivity gap further.
These challenges include random events, such as a further rise in oil prices; economic imbalances, such as high house prices and household debt, which has been the main driver of the current account deficit; and structural changes, such as the ageing population, the rapid integration of China into the world trading system and the slowing in Australian exports. How Australia responds to these imbalances and structural developments will be critical to our future growth path. Further reforms to enhance flexibility in labour and product markets will position the economy to meet these known challenges while helping shock-proof Australia against random events.
Thank you for inviting me to speak today. I have been asked to discuss the medium-term challenges facing the Australian economy. In doing so, and without attempting to be comprehensive, I will outline some of the risks to the global and Australian economies — how these risks play out will shape the global backdrop and, in turn, shape the nature of the medium-term challenges we will confront.
Previous challenges and responses
Before discussing today’s medium-term challenges, though, it might be useful to reflect on how we would have characterised the challenges facing the Australian economy if this was 1984, rather than 2004.
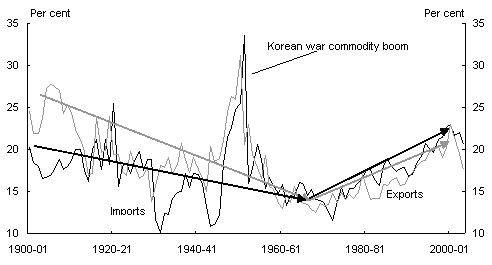
By the early 1980s, many years of poor macroeconomic policy choices, high protection and inflexible institutional arrangements had resulted in a progressive deterioration in our international competitiveness. Rather than embracing the explosion of post-war trade, we had to some extent turned our back on the world.
Chart 1: Australia’s exports and imports as a share of GDP
Source: Reserve Bank of Australia Preliminary Annual Database, Australian Bureau of Statistics.
And when hit by external impulses — whether negative, like the 1973 oil shock, or positive, like the resources boom — our wage-fixing system quickly propagated these into generalised inflationary pressures. As a result, wage growth was running in excess of 12 per cent in 1982 and 1983, and unemployment reached a post-depression high of 10.4 per cent in September 1983. Inflation was rampant, peaking at 12.5percent in September 1982, the Commonwealth fiscal deficit was 3.4 per cent of GDP in 1983-84, and nominal interest rates were well above 10 per cent for most of the 1980s.
In response to these economic challenges, Australia embarked on a series of reforms which, broadly, had bipartisan political support, even if there were debates about the speed and extent of reform. These reforms included financial deregulation, floating the exchange rate, lowering tariff barriers, major changes to the tax system, beginning the process of freeing up labour and product markets — a process which is still ongoing — and implementing credible medium-term monetary and fiscal policy frameworks.
In a large part as a result of these reforms, the Australian economy is a dramatically different creature today than it was 20 years ago. The fact that Australia weathered the Asian crisis, the global slowdown of 2001, the uncertainty from 9/11 and SARS, and now higher oil prices, is a function of the flexibility and adaptability of the economy. Virtually all of these shocks would have triggered a dramatic slowdown and/or higher inflation in years past.
In other words, the floating exchange rate has done what it was intended to do — buffer us from external shocks. The medium-term focus of macro policy has achieved its aims — over the business cycle, low and relatively stable inflation and a Commonwealth public sector that makes no call on national saving. Structural reforms have succeeded — wages are more sensitive to firm-specific conditions, productivity and competitiveness are much improved, and resources flow more easily to their most productive uses.
But just as the economy has changed, and hence the way it responds to shocks has evolved, the nature of the shocks themselves has changed. This is important to recognise, because it can be tempting to extrapolate from the past even when the macroeconomic drivers, the nature of shocks, and the structural underpinnings of the economy are very different.
Equally, while we should acknowledge the broad success of many of the past reforms, we also need to recognise they will not guarantee future economic success. And in many ways, the Australian economy faces just as many, albeit different, challenges today as it did in the early 1980s; we simply have the benefit of confronting these from a far better base.
Australia’s relative growth performance
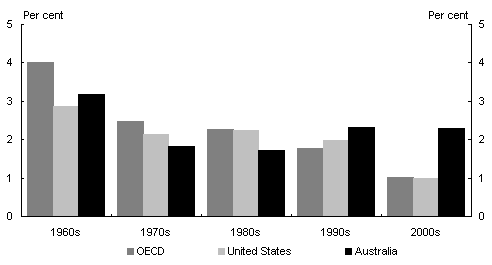
In assessing our performance since the 1980s, it is also instructive to consider our growth relative to that of comparable countries. On this measure, Australia has performed very well, and particularly so over the past decade.
For instance, since 1990 our GDP per capita — a highly aggregate indication of living standards — has increased by more than a percentage point per annum faster than that of the United States or the OECD area.
Chart 2: Per capita GDP growth comparisons
Source: Groningen Growth and Development Centre and The Conference Board.
Having said that, the level of Australia’s GDP per capita is still below that of the best performers in the OECD.
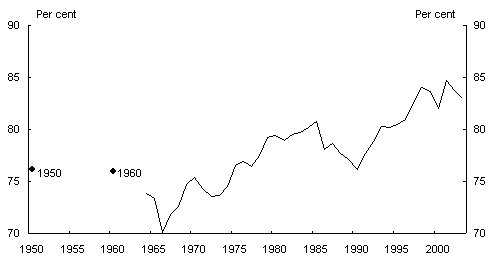
Over the last 20 years, Australia’s GDP per capita has risen relative to that of the US, from around 75 per cent in 1983 to around 79 per cent in 2003. While this catch-up might seem small in percentage terms, it represents an increase in real terms of around $2000 per person.
Chart 3: Australian labour productivity level relative to the US
(Per hour worked)
Source: Groningen Growth and Development Centre.
This catch-up has occurred mainly due to improvements in Australia’s relative productivity level. In 1990, our productivity was around 76 per cent of that in the US. By 2003, this had increased to around 83 per cent. While the historical data are difficult to interpret and should be treated with caution, there are some indications that this relative productivity level is higher than it has been since at least 1950.
Furthermore, an analysis of this catch-up on an industry basis reveals some interesting trends. Preliminary analysis suggests that some Australian industries have made significant productivity gains relative to their US counterparts since the mid-1980s. In addition, the number of industries with productivity levels above that of their US counterparts has increased over this period.
As a result, the proportion of employment engaged in industrie
s with productivity levels greater than their US counterparts has increased from around 22 per cent in 1985 to around 40 per cent in 2001.
This is indicative of the effectiveness of Australia’s labour and product market reforms, allowing resources to move toward those industries for which we have a comparative advantage. But it also highlights the key medium-term challenge confronting us — how to improve our economic performance closer to that of other leading economies on a sustainable basis.
Risks to the economy
Identifying risks to our economic performance, and developing contingent policy responses, is one of the greatest challenges confronting us in the medium-term.
Indeed, it is often a source of frustration to us in Treasury that, when the Treasurer releases forecasts, commentators focus on the point estimates. To us, just as important, if not more so, is the discussion of the risks around the forecasts.
In recent budgets, for example, we have discussed the risks around higher house prices and the increase in household sector debt, movements in world oil prices, changes in weather conditions and the increase in the US fiscal and current account deficits, to name but a few.
Identifying the risks and thinking about how they might unfold is integral to our economic analysis. This allows us to provide better policy advice to our ministers; advice that takes account of alternative, but plausible, economic scenarios.
For the sake of exposition, let me classify risks into three groups:
- random or unpredictable events;
- economic imbalances where, once the imbalance is recognised, the risk is often around how and when it might correct; and
- risks around the appropriateness and timeliness of policy responses to foreseeable structural changes in the economy.
Of course, classification of risks into these three categories is somewhat arbitrary, with substantial overlap in how risks might arise and play out.
Random shocks and oil prices
In the first category — that of random events — we could, for example, include drought, the outbreak of a virus such as SARS and terrorist attacks. While the impact of these events can be large, they are — by their nature — very difficult or impossible to predict. The effects of these shocks will in a large part depend on an economy’s underlying flexibility and the strength of its institutions and markets.
Large and unforeseen increases in oil prices are often considered an example of a random shock. And, to some extent, the increases in oil prices in the past did reflect unpredictable changes in supplier behaviour. It is more difficult to categorise the recent increase in oil prices in this way. Factors that have been driving high oil prices include strong world demand and low inventories, coupled with insufficient investment in appropriate refining capacity and supply capacity in general.
While the recent increases in oil prices reflect a set of less random events than past increases, it is clearly still very difficult to forecast oil prices themselves and the effects they may have on the world and domestic economies.
Even if one could correctly forecast oil prices, the effects of higher oil prices are difficult to determine. In Australia, higher oil prices lead to higher petrol prices, which lower real household disposable incomes and increase business input costs. On the other side, higher oil prices benefit Australian oil producers through increased profits. As Australia is a net oil importer, the negative effects would dominate.
And given that Australia’s major trading partners are predominantly net oil importers, higher oil prices will lead to lower trading partner growth and reduced demand for Australian exports.
However, the strong world demand that has contributed to the recent increase in the price of oil has also increased the prices of other forms of energy — including apparently doubling the $US contract price for coking coal from April 2005. As Australia is a net exporter of energy products taken together — that is including oil, liquefied natural gas and coal — the overall effect of an increase in oil prices is likely to be an improvement in Australia’s terms of trade. Therefore, the net effect of an oil price increase in the medium-term is not at all clear cut.
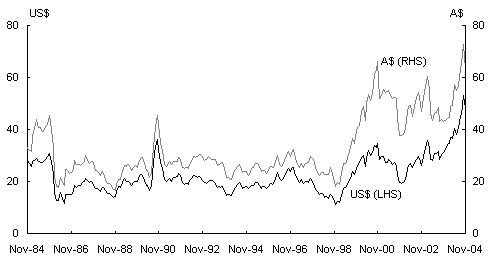
Furthermore, changes in the US dollar price of oil do not directly flow through into the Australian economy. Fluctuations in the Australian dollar also have a major impact on the price that Australian consumers and business pay at the pump. And looking at the Australian dollar price of oil, we can see that the Australian economy has already endured — and overcome — an oil price shock in recent times.
Chart 4: A$ price of oil
Source: Australian Government Treasury.
The Australian dollar price of oil increased by 250 per cent between February 1999 and November 2000, due to the combination of an increase in the US dollar price of oil and around a twenty per cent depreciation of the Australian dollar. What’s more, this has been a long lived increase, with the average Australian dollar price of oil over the new decade almost double the average of the previous decade.
Yet the Australian economy has managed to absorb this increase, without the (inevitable) direct inflationary effects being passed through into second and third round wage and price increases. This is undoubtedly a result of the credibility of macroeconomic policies over the last decade. And this illustrates the importance of credible medium-term policy in dealing with shocks to the economy.
Economic imbalances
The second category of risks is those that arise because of imbalances in the economy. It is not always easy to identify an imbalance at the time it is building up.
An example of an imbalance in the global economy at the moment is the high level of the US current account and fiscal deficits. In Australia, an example may be high house prices and the increases in household debt over recent years.
Let me speak to the latter example first.
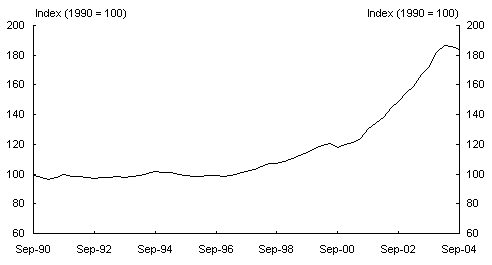
Over the last decade, Australia has experienced a housing boom of unprecedented proportions. Both construction activity and house prices have increased dramatically, driven by low interest rates, greater consumer access to housing finance, an increase in net immigration, and continued increases in household income. House prices have also been affected by supply side constraints, particularly on land release.
Chart 5: Real house prices
Source: Australian Bureau of Statistics.
Strong investment in housing has boosted national investment.
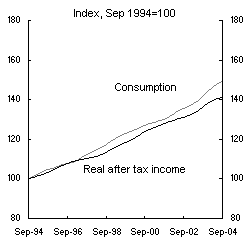
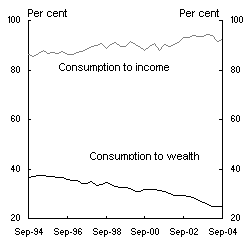
Rapid growth in house prices — the real price of established homes has increased by around 80 percent since the beginning of 1998 — has boosted household wealth. This in turn has supported rapid growth in private consumption, and has underpinned a fall in the household saving ratio.
While the fall in the household saving ratio gets attention, recall that the national accounts measure of saving does not include capital gains (including on houses) that most households would likely consider as a form of saving. Moreover, while household consumption has risen faster than income, households have not fully exploited all the consumption possibilities of the increase in household wealth.
Chart 6: Consumption, income and wealth
|
|
|
Source: Australian Bureau of Statistics.
Even if households have not increased consumption by as much as they otherwise may have done, their housing investment and consumption behaviour has significantly increased domestic financing requirements, which have been met by increased borrowing from overseas, contributing to a rise in the current account deficit (CAD).
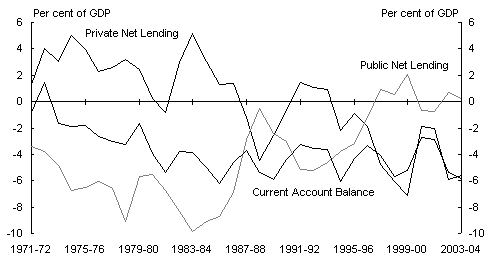
This can be illustrated using a net lending framework — that is, a framework that splits an economy’s investment financing requirement into domestic and foreign sources. An economy that saves more than it invests will be a net lender of capital to the rest of the world, while an economy that saves less than it invests will need to be a net borrower of capital.
Chart 7: Australian net lending
Source: Australian Government Treasury and Australian Bureau of Statistics.
Australia’s current account deficit is entirely a reflection of an excess of private investment over savings. Importantly, and in contrast to the United States, the Australian public sector is a net lender, and therefore is partly offsetting the private saving-investment imbalance.
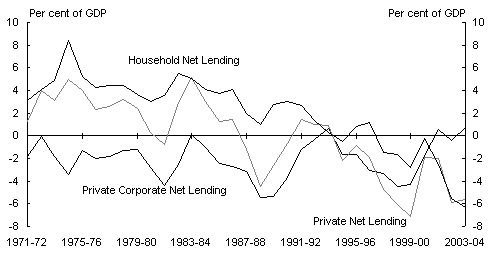
Chart 8: Private net lending
Source: Australian Government Treasury and Australian Bureau of Statistics.
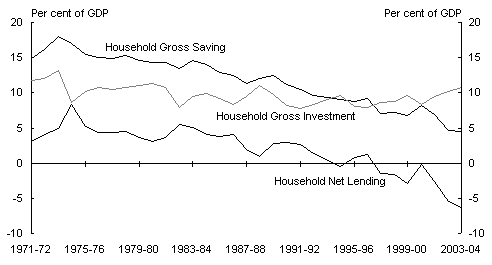
Further decomposing the private side of Australia’s net lending position into households and corporations reveals that private corporate net lending, like public net lending, is around balance. Hence, the current account deficit, as it stands, is largely a reflection of the net borrowing of households.
Chart 9: Household net lending
Source: Australian Government Treasury and Australian Bureau of Statistics.
Taking this framework one step further, we can see the impact of the housing boom. Household (dwelling) investment has risen substantially as a share of GDP, although it should be noted that it has been higher in the past. And household saving has continued to fall, to record low levels.
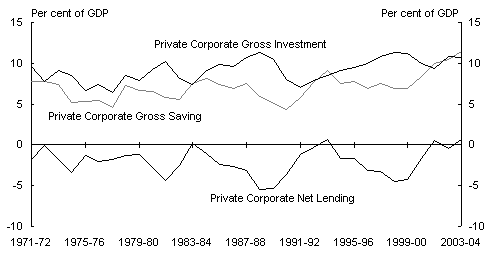
Chart 10: Corporate net lending
Source: Australian Government Treasury and Australian Bureau of Statistics.
On the private corporate side, there are also some interesting features. While this is not the first time that the corporate sector has been in balance, previous instances have generally occurred when the economy was in a period of slowdown that coincided with a decline in investment expenditure.
In this instance, corporate investment has been quite strong and it has been a sharp increase in corporate saving — largely undistributed profits — that has brought the corporate net lending position into balance. This is one example of the beneficial effects of the increase in the terms of trade.
Returning to the housing market, there remains considerable uncertainty about the future path of adjustment. We continue to forecast a benign adjustment. There is a risk, however, that falling house prices could prompt a sharper correction in investment and consumption and, hence, in overall economic activity.
Just as for unpredictable shocks, the ability of an economy to adapt to the unwinding of an imbalance — especially if it is combined with, or triggered by, some other shock— depends upon the flexibility and resilience of its markets and institutions. A small shock to an inflexible economy could have more negative and longer-lasting effects than a larger shock to a more flexible economy.
United States current account
Let’s now consider developments around the US CAD. In particular, I want to share with you a line of thinking recently set out by US President Nixon’s Secretary of Commerce, Peter Peterson. 1
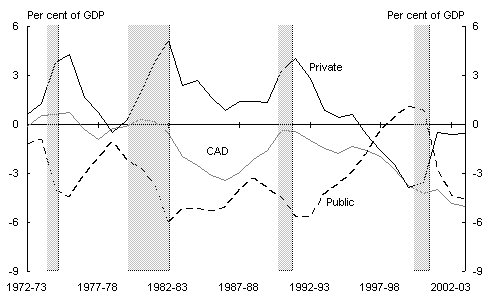
As you know, in contrast to the situation of the 1990s, the widening of the US current account deficit since 2000 has reflected a turnaround in the public net lending position, as federal, state and local government budgets have moved into deficit. In fact, as it currently stands, the US CAD is mostly a reflection of an imbalance in public saving and investment.
Chart 11: US net lending position
Source: Bureau of Economic Analysis.
Much of the discussion among the economics profession has revolved around the need to engage in fiscal consolidation to address the US twin deficits. Yet there are a broader set of issues at play here that get little attention from economists but which could potentially influence significantly the medium-term economic and geo-political backdrop for the Australian economy.
In Peterson’s view, the US is rightly regarded as the sole superpower, pre-eminent in military and economic strength for the foreseeable future. Yet it faces what we might term an impossible trinity — fighting a global war on terrorism while the US’s financial dependence on foreigners grows dramatically, all in the face of an ageing developed world.
As Peterson (and Federal Reserve Board Chairman Greenspan) has put it, the US CAD may well be sustainable at current levels for a while — but it will increase and it is not sustainable in the long run.
Peterson also believes that the US’s scope to move dramatically on fiscal policy is constrained. For the first time since World War II, the US faces a situation in which every major category of federal spending is projected to grow as fast, or faster than, the economy for many years to come. This not only includes increased pension and health care spending for retiring baby boomers, but also increased defence spending for the war against terrorism.
The problem, as Peterson sees it, is that the US is reliant on the ageing developed world for help in financing — at least part of — the fiscal and current account deficits. He believes that the ability of the developed world to assist the US will diminish as they struggle with the fiscal costs of their own ageing populations. This will increasingly place the burden of adjustment on the US, and increase the risk that other world events could trigger a disruptive correction. And while Peterson doesn’t go this far, if the developing world continues to fund the US deficits, this can only come at th
e cost of reduction in their own growth prospects.
As I noted earlier, imbalances are extremely hard to identify, given that they often occur at the same time as the economy is undergoing structural change. When imbalances arise in an economy, adjustment is inevitable. Thus, how adjustments take place and the ability of the economy to cope with adjustments become the key concerns of policy makers. And as the Peterson’ material emphasises, imbalances can have consequences that go well beyond the narrow economic.
Structural changes
The third category of risks is those that can arise from policy inaction, or the inability of the economy to adjust to major structural shifts. The ageing of the population is an example of this type of risk. Much has been said by the Treasurer and Treasury on this issue and I do not intend to reprise that material here.
Instead, I will take a few minutes to discuss two other major structural changes which will pose challenges for us.
First, the rapid integration of the Chinese economy into the world trading system will continue and see China increasingly become a key contributor to global growth. The productive potential of China’s 1.3 billion people is attracting investment and technology from around the world. And since China’s accession to the WTO, its share of world exports has increased at an unprecedented rate — from 3.9 per cent of global exports in 2000 to over 6 per cent this year.
China’s growth, and the nature of its industrialisation, is raising global demand for resources, and hence their prices. At the same time, the movement of manufacturing to China and other low cost economies is gradually reducing the world price of manufactures.
Since Australia is a resource exporter and a net importer of manufactures, these global developments are raising Australia’s terms of trade and living standards. Developments in China, India and elsewhere also appear to be generating a significant, and potentially long lived, shift in Australia’s comparative advantage, in favour of resource exports and away from manufactured exports.
For China’s part, it needs to continue to manage its economic opening while pursuing reforms that will drive and support its growth and development. This is particularly important given the increased interdependency of growth prospects in the region, including Australia’s. Key challenges for China are to achieve more balanced growth, reform the financial system, and address medium-term fiscal and demographic pressures.
There is no precedent for the economic transformation currently underway in China. The magnitude of the task means that it is unrealistic to expect the transition to take place without disruptions to growth which, in turn, would affect Australia and the region.
For the rest of the world, we need to support China’s integration into the global economy in a way that minimises disruption globally and for China. In particular, as we saw in the recent US election, protectionist sentiment in the developed economies can emerge quickly and needs to be deftly handled.
China has been under pressure to allow greater flexibility in its exchange rate. While a more flexible exchange rate will help the adjustment of global imbalances, it is also in China’s own interest to allow greater flexibility. This would allow the pursuit of an independent monetary policy and a smoother process of adjustment to shocks. But the timing of such flexibility will need to recognise the concomitant need to strengthen the financial system.
The second issue I want to address concerns the slow growth in Australia’s exports over the past few years, particularly in light of the emphasis in our forecasts on a gradual shift from domestic to external sources of growth.
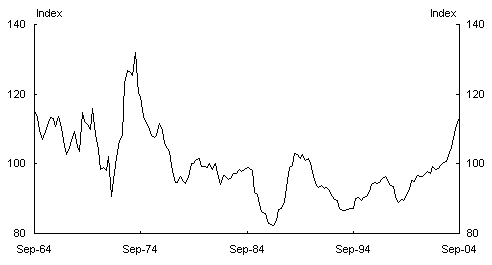
To some extent this export performance is not surprising given recent events including slow world growth in 2001-02, drought, the outbreak of SARS, and the 37 per cent appreciation of the exchange rate since its low in 2002. While export volumes have been slow to respond, Australia has benefited significantly from dramatic increases in export prices and in the terms of trade more generally.
Chart 12: Terms of trade
Source: Australian Bureau of Statistics.
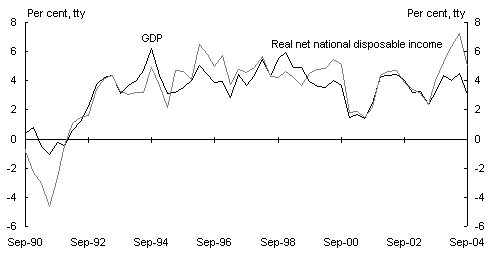
This improvement in the terms of trade is reflected in the difference between GDP and real net national disposable income, a broad measure that includes increases in purchasing power driven by the terms of trade effect. Growth in this measure through the year to the September quarter was around 2 percentage points higher than GDP.
Chart 13: Impact of the terms of trade
Source: Australian Bureau of Statistics.
None of this is to suggest we should be sanguine about the sluggish export response. After all, the world has been growing strongly for some time now. But the nature of that growth appears to have caused a change in the nature of Australia’s export growth. Examining those changes will give us some feel for what the future may hold.
Given the impact of China’s growth on Australia’s comparative advantage that I referred to earlier — towards resources and away from manufactures — it seems likely that resource exports are set to grow strongly for a number of years, while growth in manufacturing exports seems likely to remain more subdued than the strong rates achieved in the 1990s.
Resource exports are set to increase substantially as a result of significant investment under-way to raise capacity.2 Of course, these projects have substantial lead times before they start exporting — which is one reason why export volumes have not yet significantly increased.
Prospects for our manufactured exports are likely to be somewhat different, though we continue to expect growth.
Over the past two decades, the gradual removal of trade protection has exposed the Australian manufacturing sector to heightened global competition. This has generated rising efficiency in the sector and led to a substantial re-orientation of production from supplying the domestic market to exporting.
Since the mid-1980s, manufacturing output has grown at an average annual rate of about 2 per cent. Manufactured exports, by contrast, grew at an average annual rate of over 12 per cent from the mid-1980s to the turn of the century, but at a much more subdued rate of less than 4 per cent since then.
It seems unlikely that the kind of structural change that drove export growth over the 1980s and 1990s can continue. Disaggregated data suggest that manufactured export growth has been gradually slowing for quite some time. Of 35 sub-components of manufactures exports, 27 experienced double digit annual real growth from 1985-86 to 1993-94, while only 11 did from 1993-94 to 2000-01, and only 6 from 2000-01 to 2003-04.
Manufacturing export performance

Source: Australian Government Treasury.
Beyond the maturation of the export orientated manufacturing sectors, there may be other reasons for the slowdown in manufacturing export growth since the turn of the century.
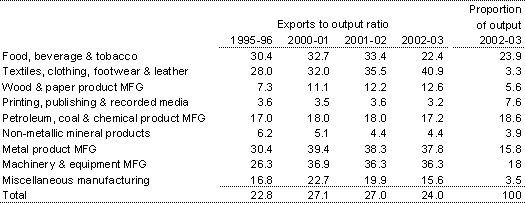
One possibility is that manufacturers have been diverting sales away from export markets toward the booming domestic market. If this were the case
, export to output ratios in manufacturing sectors would be expected to stabilise or fall. Preliminary analysis suggests that this is the case, with the export to output ratios of most industries remaining flat over the first part of the current decade (see Attachment 1).
In summary, it seems possible that manufacturing export growth will remain relatively subdued over the next several years, for three main reasons:
- Double-digit annual export growth rates are possible off a low base, but much harder to achieve when exports already account for a sizeable fraction of output— essentially a maturation argument.
- The gradual global shift of manufacturing production to low cost countries, including China, is continuing to place competitive pressures on parts of Australian manufacturing.
- The rise in world resource prices has underpinned a sizeable appreciation of the Australian dollar, with the real trade weighted exchange rate now around 10percent above its average since 1990 and nearly 15 per cent above its average over the past five years. This appreciation has reduced the competitiveness of Australian manufacturing exporters. While some part of the current strength in resource prices may not be sustained, the changing global demand/supply balance suggests that resource prices may remain strong for some time.
Again, the key challenge to policy makers in dealing with this kind of structural shift in Australia’s comparative advantage is to maintain and enhance the flexibility of labour and product markets. This will enable the economy to adapt to these global changes with less short-term dislocation.
Concluding comments
A primary medium-term challenge for Australia is to sustain the conditions for growth. Maintaining and further enhancing flexibility in labour and product markets allows the economy to adapt to structural changes, such as aging of the population and the rise of China — which provides great opportunities as well as challenges — and shocks such as higher oil prices.
The economic reforms of successive governments over the past two decades have played a major role in Australia’s recent economic performance. Although it is difficult to quantify the extent to which government policy has been responsible for this impressive performance, it is certainly the case that Australia’s economic growth would have been diminished in the absence of these reforms.
Australia now has more coherent and disciplined monetary and fiscal policy frameworks than in the past. Increased flexibility and competition in labour and product markets have allowed for the more efficient allocation of resources within the Australian economy. These reforms have seen wage and price pressures remain relatively subdued, even in an environment of continued strong GDP and employment growth.
The micro reforms that were undertaken over the last two decades are clearly paying off, and will continue to do so. But further reforms will be required if we are to maintain productivity and economic growth. Only a flexible and resilient economy will be able to deal with the challenges that confront us, be they unforseen shocks, emerging imbalances or long term structural changes.
Attachment 1
Manufacturing export to output ratios
1 ‘Riding for a Fall’, Foreign Affairs, September/October 2004.
2 For example, recently completed projects include the North West Shelf fourth train, the Bayu/Undan oil and gas fields, and BHP’s MAC iron ore mine; projects currently underway include the Mutineer/Exeter oil fields, and Yandicoogina iron ore mines; while projects currently being planned include the North West Shelf fifth train and Gorgon LNG fields, the Enfield oil project, and further expansion of iron ore mines in the Pilbara.
