Benjamin Ford and Karen Taylor1
The yield curve typically slopes upwards as bond investors require higher interest rates to hold bonds of longer maturities. For most of 2005, the Australian yield curve has been close to flat, or negatively sloped. The traditional interpretation of such a development is that the bond market expects lower future short-term interest rates and weaker future economic activity. However, this conclusion is at odds with the recent performance of the Australian economy and the outlook for 2005-06. The paper argues that a combination of domestic and international developments have suppressed long-term bond yields.
Introduction
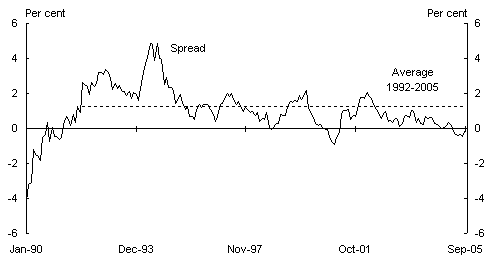
The Australian yield curve has been close to flat or negative for most of 2005, with the spread of the 10-year Government bond yield over the cash rate averaging minus 13basis points and reaching a low of minus 44 basis points in August 2005.
In contrast to previous episodes of a flat or negatively sloped yield curve, the movements in the spread have been driven by a fall in long bond rates rather than rises in short-term interest rates resulting from monetary tightening. As movements in Australian long-term bond yields are strongly correlated with those in the UnitedStates (US) and globally, it may be difficult to isolate the relative contributions of domestic and international factors. In particular, it is possible that there may be a speculative element in global bond prices for some of this period. In this case, current long-term bond yields may not be an accurate reflection of market expectations about future real economic activity and bond prices would be expected to adjust downwards (that is, yields rise) as the speculative element moderates.
On the other hand, economic commentators have identified a range of longer term factors which suggest current low bond yields may be a rational reflection of longer term factors being taken into account by bond markets. Such factors include a structural decline in inflation and inflation expectations, excess global savings placing pressure on bond yields (the ‘global savings glut’ hypothesis) and a change in the portfolio preferences of investors, represented by a shift away from equities and shorter maturity bonds to 10-year government bonds.
The purpose of this paper is to provide an overview of recent developments in Australian bond yields and to describe some of the major factors which have driven these developments.
Recent developments in long-term bond yields
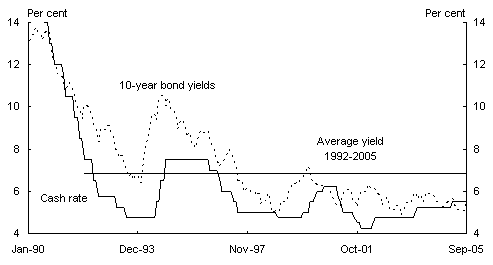
Over the last decade, long-term bond yields have declined in Australia (Chart1). This decline, in part, reflects the presence of more stable economic conditions and the structural decline in both inflation and inflation expectations since the early 1990s.
Chart 1: Australian long-term bond yields

Source: RBA Bulletin Database.
Since mid-2004, long-term bond yields in Australia have declined further, with Australian yields well below their average since 1992. Over this time, the narrowing in the yield spread has primarily resulted from a fall in the long-term bond rate. This is because the fall in the long-term bond yield has been larger than the fall in the cash rate(Chart2).
Chart 2: Australian yield spread(a)

- Spread between 10-year bond yield and monetary policy rate.
Source: RBA Bulletin Database; OECD Main Economic Indicators Database.
The information content of bond yields
The yield curve typically slopes upwards as bond investors require higher interest rates to hold bonds of longer maturities. This is known as the liquidity or term premium. However, bond yields may also provide information about financial market expectations of future real economic activity.
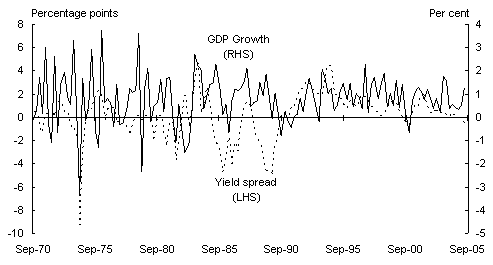
Historically, there has been a correlation between the slope of the yield curve (measured by the spread) and expectations of future inflation and economic activity, with an upward-sloping (flat or inverted) yield curve interpreted as signalling stronger (weaker) real economic activity and inflation in the future (Chart3). This correlation has been supported empirically, with various studies finding a significant relationship in OECD countries between the yield spread and measures of future real economic activity such as real GDP, industrial production and consumption (for a comprehensive review of these studies see Stock and Watson 2003).
Chart 3: Yield spread and GDP growth(a)

- Yield spread is the difference between the yields on 10-year government bonds and 90-day bank bills. GDP data is quarterly and the yield spread is a quarterly average of monthly data.
Source: ABS cat. no. 5206.0; RBA Bulletin Database.
A standard economic explanation for the relationship between the yield spread and future economic growth is that, when the economy is strong, there will be an expectation of higher average short-term interest rates in the future. Expectations of higher average short-term rates will lead to bond yields being higher than present short-term rates and thus to a higher yield spread. Conversely, when the economy is weak there will be an expectation of lower average short-term interest rates in the future, leading to a lower (and possibly negative) yield spread.
The traditional interpretation of a narrowing spread preceding a decline in future real economic activity would suggest that financial markets are expecting weakness in the Australian economy. However, such a view is at odds with the performance of the Australian economy, which has achieved solid real GDP growth and strong employment growth. The outlook is also positive, with solid real economic growth expected in 2005-06. In addition, the narrowing spread over the last few years has primarily been driven by a fall in long-term bond yields, rather than monetary tightening. This contrasts with previous episodes of narrowing yield spreads, such as in the late 1980s, which were primarily driven by rising short-term rates due to monetary policy tightening.
Given the recent performance of the Australian economy and the positive outlook for 2005-06, the fall in the Australian yield spread may well be a rational response by bond market participants to improved economic conditions. That is, the fall in long-term bond yields will have been driven, in part, by a structural decline in inflation and inflation expectations due to more credible monetary policy and more stable economic conditions. This would decrease the spread as long-term bond investors are willing to bear risk at a lower level of nominal return. This suggests that some flattening of the slope of the yield curve may well be consistent with a market view that the economy is expected to grow at, or around, its trend rate and is not facing significant inflationary pressures.
That said, portfolio preference considerations would continue to suggest, other factors unchanged, some upward slope to the yield curve. This is because higher interest rates are generally required for bond investors to hold bonds of longer maturities. This suggests that factors other than expectations about future conditions in the Australian economy have been influencing long-term bond yields.
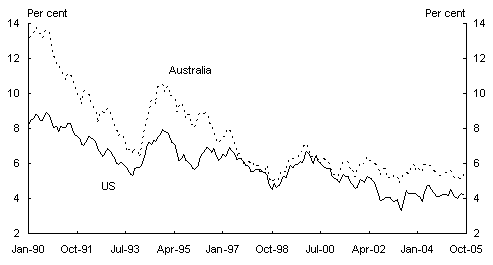
Economic and financial developments
Movements in the long end
of the Australian yield curve are strongly correlated with movements in the long end of the US yield curve (Chart4). Consequently, the influences which are affecting bond yields in the US most likely explain some of the movements in Australian bond yields.
Chart 4: Australian and US long-term bond yields

Source: RBA Bulletin Database.
Similar to Australia’s experience, there has been a structural decline in both inflation and inflation expectations in the US and elsewhere. This has occurred as a result of increased central bank credibility in combating inflation, which has been supported by enhanced global competition and additions to world production and trade, most prominently from China and India, which have put downward pressure on the prices of some traded goods. This may explain, in part, the fall in bond yields in the US, but as in the case of Australia, not all of the fall. As in Australia, there are concerns in the US that long-term bond yields are low relative to the economy’s fundamentals and future growth prospects. This is what the current Chairman of the US Federal Reserve, Alan Greenspan, referred to in Congressional testimony in February 2005, as the ‘conundrum’ of the current behaviour of world bond markets, noting that movements in bond prices may well be a short-term aberration.
A possible explanation for current US and global bond rates is the ‘global savings glut’ hypothesis. The hypothesis proposes that global imbalances in saving and investment are largely due to the supply of saving being significantly higher over the past decade compared to desired investment in Asia and other parts of the world. A prominent proponent of this view is US Federal Reserve Chair nominee BenBernanke, who argues that a global savings glut helps to explain the increase in the US current account deficit and the relatively low levels of long-term real interest rates around the world. In particular, according to the Bernanke thesis, the current account deficits in the US and other industrialised nations are being funded by the current account surpluses of Asia and increasingly the MiddleEast.
A global savings glut relative to investment is likely, however, to be just one part of the story. As the International Monetary Fund (IMF) explains, global saving and investment rates have been falling in recent years. According to the IMF’s recent Global Financial Stability Report (GFSR), the decline in global saving has been largely due to the decline in public saving in the US, increases in asset prices, and demographic changes in Japan and Europe; while changes in investment have been due to the investment slump in Asian economies (excluding China). The global nature of these factors means that the unwinding of imbalances will require policy responses across many countries.
The IMF’s GFSR highlights another potential structural influence on the low levels of bond yields at the long end of the curve across mature markets: a possible shift in the portfolio preferences of investors, particularly large overseas pension funds and insurance companies. These pension funds and insurance companies are showing signs of increasing their holdings of long-term fixed-income securities and reducing the share of equities in their portfolios. While evidence of a substantial preference shift is far from conclusive at present, it has emerged that there exists a duration mismatch between assets and liabilities.
The IMF notes that defined benefit pension funds and life insurance companies have increased their level of interest in longer dated fixed-income assets. This increased interest has been influenced by growing awareness among pension fund administrators and regulators that there is a mismatch between the underlying assets and liabilities of many defined benefit pension funds. Financial market commentary (see, for example, a recent Goldman Sachs report entitled The Impact of Pension Reform on the Capital Markets) has identified three drivers of this mismatch.
First, some overseas pension funds are underfunded, meaning that the present value of their assets is less than their obligations. Underfunding has arisen because lower returns from traditional equity classes have reduced the value of underlying assets and because of historically low fund cash contributions, which were a response to previously high asset returns and optimistic expectations about future returns. Second, the asset mix of these pension funds tends to be of short duration relative to the length of liabilities. As a result, lower interest rates increase the present value of liabilities faster than the fund’s underlying assets. Third, increased life expectancy has increased the average length of time over which benefits must be paid, further raising the present value of liabilities.
The extent to which the response of pension funds to this asset-liability mismatch has influenced bond yields is difficult to separate from the effect of more general pension fund activity across all asset classes. That said, ageing populations in many OECD countries will likely increase the total assets of pension funds and life insurance companies. Given these funds still face significant duration gaps, there may be an ongoing shift in favour of fixed income securities which could influence long-dated yields over the medium to long term.
Conclusions
The flatness of the yield curve in Australia, the US, and elsewhere reflects, in part, the benefits of credible monetary policy frameworks which have kept inflation low and output more stable. However, the current flatness of the Australian curve is difficult to explain by domestic factors alone. There are reasons to believe that the global factors holding down long rates may persist for some time and will, most likely, unwind in an orderly fashion. That said, were there to be a disorderly shift in global markets, it would impact on all countries, including Australia.
References
Bernanke, B 2005, Remarks by Governor Ben S Bernanke at the Sandridge Lecture, Virginia Association of Economics, Richmond, Virginia,.
http://www.federalreserve.gov/boarddocs/speeches/2005/200503102/default.htm.
Estrella, A and Mishkin, FS 1998, ‘Predicting US recessions: Financial variables as leading indicators’, Review of Economics and Statistics, 80, pp. 45-61.
Fisher, C and Felmingham, B 1998, ‘The Australian yield curve as a leading indicator of consumption growth’, Applied Financial Economics, 8, pp. 627-35.
Goldman Sachs 2005, ‘The impact of pension reform on the capital markets’, Global Economics Paper No: 128, September 2005.
Greenspan, A 2004, ‘Globalization and innovation’, Conference on Bank Structure and Competition, sponsored by the Federal Reserve Bank of Chicago, Chicago, Illinois, May6. http://www.federalreserve.gov/boarddocs/speeches/2004/200405062/default.htm
Greenspan, A 2005a, Federal Reserve Board's semi-annual Monetary Policy Report to the Congress before the Committee on Banking, Housing, and Urban Affairs, US Senate, February 16.
http://www.federalreserve.gov/boarddocs/hh/2005/february/testimony.htm.
Greenspan, A 2005b, Congressional, Federal Reserve Board’s semi-annual Monetary Policy Report to the Congress before the Committee on Financial Services, U.S. House of Representatives 20 July.
http://www.federalreserve.gov/boarddocs/hh/2005/july/testimony.h
tm.
IMF 2005a, Financial Markets Update, International Monetary Fund, Washington, June.
IMF 2005b, Global Financial Stability Report, International Monetary Fund, Washington, September.
IMF 2005c, World Economic Outlook, International Monetary Fund, Washington, September.
IMF 2005d, Press briefing for World Economic Outlook, International Monetary Fund, Washington, September. http://www.imf.org/external/np/tr/2005/tr050921.htm.
Moneta, F 2003, ‘Does the yield spread predict recessions in the Euro area?’, Working Paper No. 294, European Central Bank, Frankfurt, December.
Stock, JH and Watson, MW 2003, ‘Forecasting output and inflation: The role of asset prices’, Journal of Economic Literature, Vol 61, no. 3, pp. 788-829.
The Economist 2005, The great thrift shift, 22 September,
http://www.economist.com/displaystory.cfm?story_id=4418328.
1 The authors are from Macroeconomic Policy Division, the Australian Treasury. This article has benefited from comments and suggestions provided by AdamMcKissack, PaulO’Mara, David Parker, Martin Parkinson, Craig Thorburn and David Turvey. The views in this article are those of the authors and not necessarily those of the Australian Treasury.