Angelia Grant, John Hawkins and Lachlan Shaw1
Mining commodities form a large share of Australia’s exports, and Australia is a leading producer of many commodities. Their contribution to the Australian economy can be volatile, however, as commodity prices often rise or fall by large amounts and there are long lags in increasing production.
Contrary to some expectations, there does not appear to be a long-run tendency for the prices of mined commodities to fall relative to the price of manufactures. Recently, mineral prices have been very strong. Most notably, increased demand from steel producers, especially in China, has driven up the prices of iron ore and coal. Australian mining houses are trying to ramp up supply in response, as are producers elsewhere in the world.
An important issue is how quickly supply can expand to meet the rising demand, and what this implies for prices. Looking at past experiences suggests that the projected increase in demand will underpin current prices for at least another year, but beyond that the prospects are less certain.
Introduction
Australia’s mineral resources are an important source of national income. The mining sector accounted for around $43billion, or 5percent, of Australia’s GDP in 2004-05. This share is rising following the large price rises for some of our key resource exports. As mining is a capital-intensive sector, its share of national employment is significantly lower at around 1percent.2 The mining sector is very export-oriented. Australia’s exports of resource commodities amounted to $54billion in 2004-05.3 Mining production and exports come disproportionately from Queensland and Western Australia.
The main resources Australia exports are coal ($17billion in 2004-05), oil and gas ($10billion), iron ore ($8billion), gold ($5billion), alumina ($4billion) and nickel ($3billion). The major markets are now in Asia.
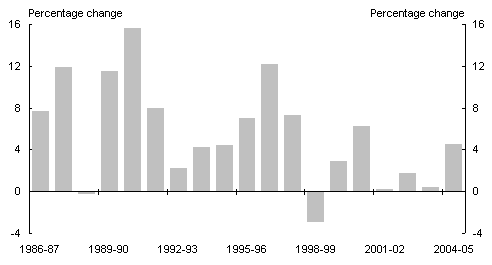
The value of Australia’s resource exports has grown at an average annual rate of 8percent over the past two decades. About 3 percentage points of this reflect changes in prices. Thus, Australia’s exports of resources have grown at an annual rate of around 5percent in volume terms since the mid-1980s. However growth in total resource exports has declined in recent years as falling petroleum exports have offset solid growth elsewhere (Table 1, Chart1).
Table 1: Australia’s exports of resource commodities
(average annual percentage change; chain volume measure)

Sources: derived from data supplied by ABS.
Chart 1: Australian resource export volumes
Source: derived from data provided by ABS.
The historical development of Australia’s resources sector4
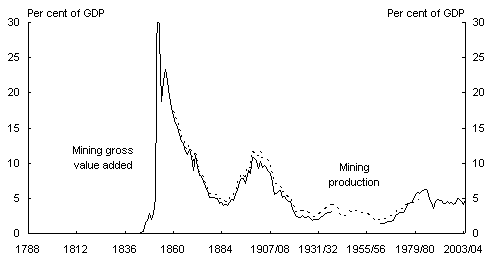
The first mineral resource discovered in Australia was coal, found in 1796 in the region later called Newcastle (after the English coal port), with the first exports (to Bengal) occurring in 1799. By the 1840s, copper was being mined by Cornish immigrants near Adelaide and the first iron ore was being smelted at Mittagong. However mining really only came to prominence during the gold rush of the 1850s, which occurred predominantly in Victoria (Chart 2). This saw the population of Victoria soar from under 100,000 to over half a million in the space of a decade.
Following further discoveries at Kalgoorlie in the 1890s, gold still accounted for the majority of mining production in the early years of federation — with Australia being the world’s leading gold miner in some years. However, copper, lead and silver (notably from the mines at Broken Hill) had also become important. The end of World War I saw metal prices collapse and many mines closed. In the 1930s mining commenced at Mount Isa, initially of silver, lead and zinc, and later copper.
Coal production slumped during the 1930s depression, and was subsequently held back by competition from petroleum products. Prolonged industrial unrest exacerbated the decline.
Chart 2: Mining activity
Source: based on data from ABS, Saddler (1987), Butlin (1987).
Pessimism emerged during the 1930s about the future of the mining industry as the view became common that Australia was not well-endowed with resources. In 1938 reserves of iron ore were thought so low that the government placed an embargo on their export (which was not lifted until 1960).
More systematic surveying, better understanding of Australian geology (assisted by the establishment of the Bureau of Mineral Resources), technological advances in mining and increased exploration by foreign mining companies led to many discoveries of viable deposits in the 1950s and 1960s, notably the iron ore and nickel deposits in Western Australia. At the same time the rapid growth of Japan’s economy provided a ready market. During this period, iron ore and coal became more important exports than gold and base metals.
While minor discoveries of oil and gas date back to the nineteenth century, substantial production only commenced in the 1960s following the development of the oil fields in Bass Strait. The oil shocks of 1973 and 1979 transformed the economics of the industry. As well as increased onshore production and exploration, attention turned to offshore exploration and development. The first of the North West Shelf gas fields had been discovered in 1971 and further exploration found more reserves there, while Jabiru in the Timor Sea was discovered in 1983.
Australian resource production boomed in the 1970s but by the early 1980s it was evident that global demand had slowed for most resources and production stagnated for a time. (An exception was gold, where new technology allowed increased production from old fields.) Solid growth in the world economy, and particularly the industrialisation of Asia, underpinned resource production for the latter 1980s and 1990s, although the Asian financial crisis of 1997 led to a temporary decline in metal prices. As discussed below, demand for resources picked up substantially in the new millennium.
Australia is one of the world’s leading miners and exporters of many minerals (Table 2).5 Australia has also become a leading exporter of mining software and expertise.
Table 2: Australia’s ranking for major minerals

Source: Australian Bureau of Agricultural and Resource Economics (ABARE).
Long-term trends in relative commodity prices
The conventional wisdom has long been that the relative price of commodities would decline over time.6 The argument is that as wealth increases, demand will shift towards services and sophisticated manufactures.
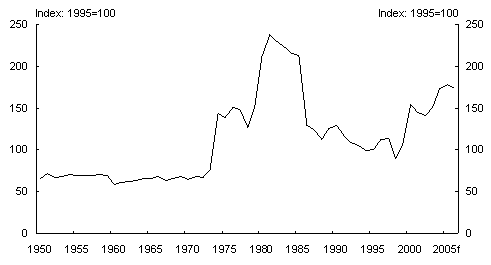
Over the period since 1850, the oft-cited Economist index of commodity prices7 dropped by around 80 per cent relative to overall prices. However, overall mineral resource prices have increased relative to the prices of manufactures over the past half-century (
Chart 3). This period has been dominated by supply shocks driving up oil prices in the 1970s and the more recent increases in prices driven largely by demand (discussed further below). From the mid-1990s the increase in relative commodity prices has been reinforced by falls in prices of manufactures.
Chart 3: Relative price of global mining exports
(World mining export prices / manufactures exports)
Source: based on data from World Trade Organization.
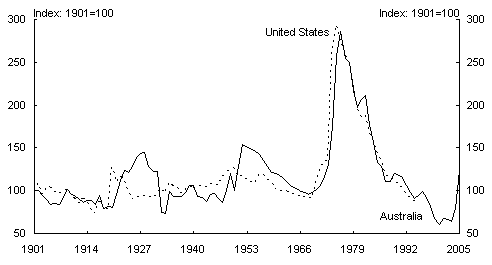
Looking more specifically at the price of one of Australia’s key commodity exports, coal (Chart 4), the relative price surged during the 1970s energy crisis and then fell back until the recent rises. But there is no clear trend over the past century.
Chart 4: Relative price of coal
(US dollar price of coal exports relative to US CPI)
Source: ABARE, Mitchell (2003), IMF and Treasury derived.
Cyclical variations in commodity prices
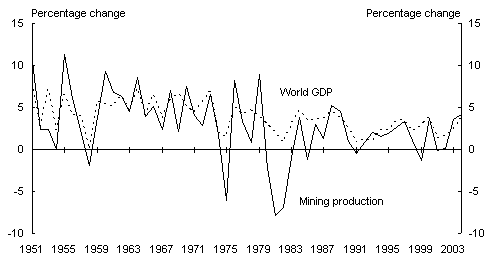
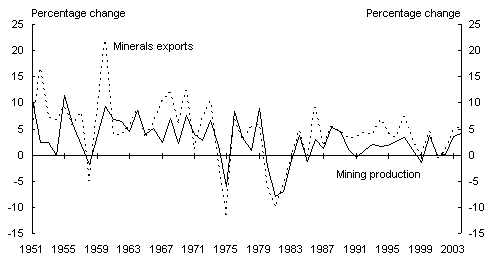
Global mining production moves with global economic activity but with more pronounced swings (Chart 5). Whereas real GDP for the world as a whole has not fallen for almost 60 years, mining production contracted quite heavily during the global slowdowns in 1975, 1981 and 1982. Mineral exports are in turn even more variable than mineral production (Chart 6).
Chart 5: World GDP and mining production
Source: Derived from World Trade Organization data.
Chart 6: World minerals production and exports
Source: derived from World Trade Organization data.
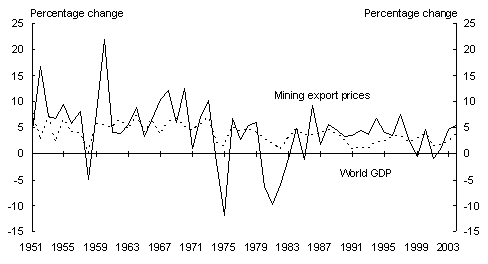
Mining export prices are highly pro-cyclical, with absolute price falls common during global slowdowns in activity (Chart 7). In part, this reflects the fact that mining companies attempt to increase production when prices rise, but due to the large fixed costs and capital-intensive nature of modern mining technology, new production may lag the initial investment decision by a number of years. As a result, prices run up more than ‘desired’ and are followed by periods of weakening as global supply expands, with prices falling in absolute terms during recessions. However, it is hard to identify the lags involved using aggregate data. Cashin and McDermott (2002) identify cycles in real commodity prices, with the median duration of booms and slumps both around four years. (See also the box on Cobweb models below.)
Chart 7: World mining export prices
Source: derived from World Trade Organization data.
Current surge in demand for coal and iron ore
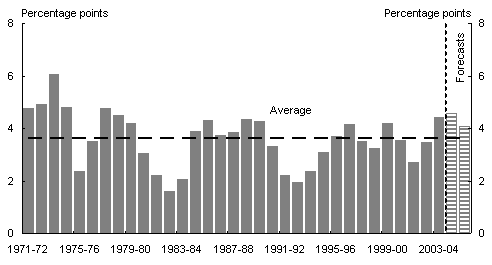
World GDP growth in recent times has been strong, underpinned by the continued industrialisation of China (chart 8). Industrial production in China has grown rapidly over the last decade. As a result, China’s demand has increased for a wide range of raw materials to generate electricity and supply inputs for its burgeoning construction, investment and manufacturing sectors.
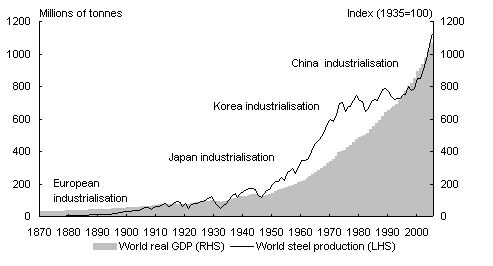
Stimulated by stronger world growth, global production of many products has grown at well above long-run average rates in recent times. Steel production, for instance, has grown at an annual average rate of around 6percent over the last five years, compared with a long run annual average rate of under 2percent since 1970.
|
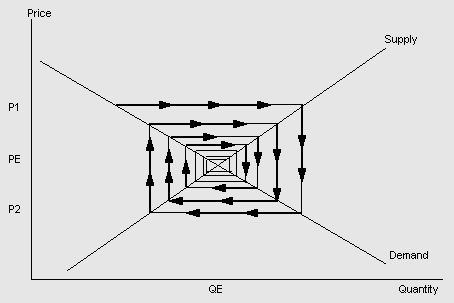
Cobweb models Cobweb models provide a framework for considering the fluctuating nature of prices in the mining industry. They were developed in the 1930s (for example Kaldor (1934)) to explain the price fluctuations seen in many agricultural markets. The models apply to markets where production takes time, the quantity produced depends on an anticipated price and supply at the time of sale determines the actual market price. That is, the model applies to situations where there is a lag between the responses of producers to a change in the price. This is the case for the mining industry. Basically, according to cobweb models prices can over- and under-shoot along the way. If the price is anticipated to be high, producers will increase production over time and the actual price will be lower given the increased supply. The lower price results in a lower anticipated price and a subsequent reduction in supply over time, which works to increase the actual price. Depending on the slopes of the demand and supply curves (the elasticities), this process continues until equilibrium is reached. The models get their name because, when stable, the market follows a cobweb-like path to the equilibrium price.
The theory behind cobweb models was first developed under the assumption of static price expectations — the predicted price equals the actual price in the last period. However, in 1958 Nerlove instead assumed adaptive expectations, where economic agents form their expectations of the price on the basis of past prices and errors in their earlier price predictions. In 1961 Muth developed the implications of rational expectations for cobweb models, where the expectations of future prices incorporate all available information and are based on the predicted economic structure of the market. If the strong assumption of rational expectations holds, it implies that price fluctuations are explained by the cyclical pattern of exogenous variables or by the summation of random shocks. |
Chart 8: World GDP growth
Source: IMF, Treasury.
Chart 9 shows that periods of above-average steel production growth correspond to periods of Japan’s industrialisation (1950s and 1960s) and South Korea’s industrialisation (1980s). More recently, the chart shows global steel production entering an above-average growth phase that corresponds to China’s present industrialisation.
Chart 9: World GDP and steel production growth
(Levels)
Source: derived from various sources, especially Maddison (2003) and Mitchell (2003).
Strong growth in steel production has, in turn, stimulated demand for the key inputs into steel production — iron ore and metallurgical coal — resulting in dramatic price increases of about 120percent for metallurgical coal and about 70percent for iron ore earlier in 2005. In addition, global prices for thermal coal grew by 20percent this year in response to power companies, especially in Asia, competing to secure additional coal feedstock to meet growing electricity demand.
The demand shock that has precipitated these price increases has, in turn, been due to growth in China’s construction, investment and manufacturing sectors. And this growth is likely to continu
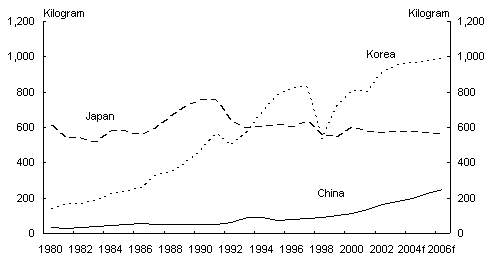
e for some time. Maurer et al (2004) observe that on a per capita basis, China lags well behind developed regional neighbours such as Japan and Korea for consumption of a range of resources and resource-intensive manufactures, such as steel (Chart 10).8
Chart 10: Per capita consumption of finished steel
Source: ABARE.
In previous eras of industrialisation, growing incomes have led to shifts in the composition of economic activity to encompass higher shares of consumption and services, at the expense of other sectors such as investment, construction, manufacturing and mining commodity industries. While China and India are likely to follow this path also, the sheer size of their population means that this transition could be expected to take years, possibly decades. Given this, it is likely that growth in their consumption of raw materials will remain robust for some time yet.
Recent investment and production
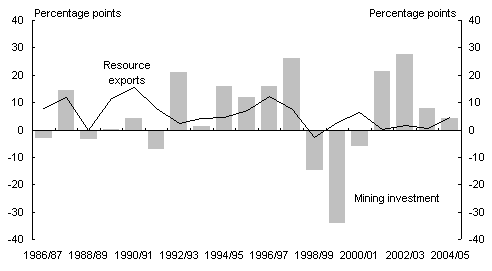
Mining investment has grown strongly in recent years, with mining companies investing almost $30billion over the last three years alone (Chart 11). However, this has been slow to translate through to similarly impressive rates of growth of resource export volumes. This is due to the nature of the mining industry. Projects are highly capital-intensive, typically requiring extensive supporting infrastructure, as well as complex and sophisticated plant and equipment. The complex nature of many resource projects explains why a lengthy lag is usual between the decision to expand capacity and the additional capacity coming into production. Given recent strong world demand, these lags in the supply response have contributed to the recent growth in mining commodity prices.
Chart 11: Mining investment and resource exports
(annual percentage change: volumes)
Source: derived from ABS Cat. No. 5204 and 5302.
One reason why mining commodity export growth has been muted recently is that while new mines and wells are being developed, older ones are running low or becoming more expensive to tap. For example, oil and gas are usually first extracted under the field’s own pressure. But as more oil and gas are produced, the field pressure declines, which leads to lower volumes of oil and gas exiting the well. Miners have evolved a range of technologies to extend field production rates, ranging from pumping water or gas into a field, to fracturing the geological structure to allow the oil and gas to flow to the well heads more easily, to injecting steam into fields to superheat the oil to make it more viscous and easier to extract. However, all these technologies involve higher capital expenditure and per unit costs.
In Australia’s case, production from our largest oil and gas field is in decline. ABARE (2005) reports that production from the Bass Strait fields off the Gippsland coast in south-east Victoria has declined at an annual average rate of 17percent since 1999-2000. Many billions of dollars have been invested in new oil and gas production across Australia, but most of this has just offset the decline from our largest field.
Supply responses and implications for prices
Mining firms in Australia have responded to higher prices with increased investment. Recently completed projects include the North West shelf 4th train, the Mutineer/Exeter oil fields, the Hail Creek coal mine, the first stage of the Bayu/Undan oil and gas fields, and BHP’s MAC iron ore mine. In addition, projects currently underway include the second stage of the Bayu/Undan fields, the Rolleston coal and the Yandicoogina iron ore mines.
Overseas producers are also expanding capacity. ABARE’s (2005) judgment in September was that increases in global production of coal and iron ore are likely to allow world stocks to increase sufficiently to place downward pressure on negotiated prices, with Japanese financial year 2006-07 prices forecast to fall between 14 and 18percent.
ABARE predicts that world seaborne metallurgical coal trade will grow by 4percent in 2005 and a further 5percent to 227million tonnes in 2006. Australia is forecast to supply almost 60percent of this, drawing on new operations that are in development or ramp-up stage, and the expected commissioning of a number of new projects.
Stronger growth is forecast in world seaborne iron ore volumes, with ABARE forecasting a 9percent rise in 2005 and a further 7percent to 699million tonnes in 2006. Brazilian and Australian producers are providing the lion’s share of supply growth over this time, with Australian producers forecast to gain market share due to cost advantages conferred by our proximity to the burgeoning Chinese steel industry.
Conclusions
Mining commodity prices have risen strongly recently. This appears more than a fluctuation around a long-term downward trend. Rather it reflects the strong state of world demand, and in particular the rapid industrialisation of China. However, the long lead times in developing mining projects mean there is a ‘cobweb’ aspect to the market. As more productive capacity comes into operation around the world, commodity prices will slow or fall back somewhat.
References
Australian Bureau of Agricultural and Resource Economics 2005, Australian Commodities, vol 12, no. 3, September quarter, released 19 September 2005.
Blainey, G 1963, The Rush that Never Ended: A History of Australian Mining.
Butlin, N 1987, ‘Australian National Accounts’, in Vamplew, W (ed) Australians: Historical Statistics. Fairfax, Syme and Weldon Associates, pp. 126-44.
Cashin, P and McDermott, C 2002, ‘The long-run behaviour of commodity prices: small trends and big variability’, IMF Staff Papers, vol 49, no. 2, pp. 175-99.
Doran, C 1984, ‘An historical perspective on mining and economic change’, in Cook, L and Porter, M (eds) The Minerals Sector and the Australian Economy, George Allen & Unwin, Sydney, pp. 37-84.
Gillitzer, C and Kearns, J 2005, ‘Long-term patterns in Australia’s terms of trade’, Reserve Bank of Australia Research Discussion Papers, 2005-01, April.
Grilli, E and Yang, M 1988, ‘Primary commodity prices, manufactured goods prices, and the terms of trade of developing countries: what the long run shows’, World Bank Economic Review, vol 2, no. 1, pp. 1-47.
Kaldor, N 1934 ‘A classificatory note on the determinateness of equilibrium’ Review of Economic Studies 1, February, pp. 122-36.
Maddison, A 2003, The World Economy: Historical Statistics, OECD.
Mitchell, B 2003, International Historical Statistics, 3 volumes, Palgrave.
Maurer, A, Tristan, W, Curlotti, R, Johnston, T and Haine, I 2004, ‘China’s minerals sector: strong growth providing opportunities for Australia’, Australian Commodities, vol 11, no. 2, June quarter, pp. 306-18.
McKay, B, Lambert, I and Miyazaki, S 2000, ‘The Australian mining industry: from settlement to 2000’, October, (
Muth, J F 1961 ‘Rational expectations and the theory of price movements’ Econometrica 29, July, pp. 315-35.
Nerlove, M 1958 ‘Adaptive expectations and cobweb phenomena’ Quarterly Journal of Economics 72, May, pp.227-40.
Prebisch, R 1950, ‘The economic devel
opment of Latin America and its principal problems,’ Economic Bulletin for Latin America, vol 7, no. 1, United Nations.
Saddler, H 1987, ‘Minerals and energy’, in Vamplew, W (ed) Australians: Historical Statistics. Fairfax, Syme and Weldon Associates, pp. 86-99.
Singer, H 1950, ‘U.S. foreign investment in underdeveloped areas: the distribution of gains between investing and borrowing countries’, American Economic Review, vol 40, May, pp. 473-85.
1 The authors are from Macroeconomic Division, the Australian Treasury. This article has benefited from data and suggestions provided by Simon Richmond at the Australian Bureau of Agricultural and Resource Economics. The views in this article are those of the authors and not necessarily those of the Australian Treasury.
2 A further 4 per cent are employed in manufacturing industries which process minerals. These industries contribute 5 per cent of GDP.
3 In this paper, the terms ‘mining’ and ‘resources’ are used synonymously to refer to Standard International Trade Classification divisions 27, 28, 32, 33, 34 and 97. This means they include oil and gas extraction and non-monetary gold, but not resource-based manufactures such as smelted iron and steel.
4 Short histories of Australia’s mining industry are given in Doran (1984), McKay, Lambert and Miyazaki (2000) and Saddler (1987). A more detailed and literary history is provided by Blainey (1963).
5 In addition to the major exports listed, Australia is one of the world’s leading producers and exporters of diamonds, lead, manganese, titanium, zinc and zircon.
6 This is sometimes termed the Prebsich-Singer hypothesis after Prebisch (1950) and Singer (1950). Gillitzer and Kearns (2005) survey empirical studies which broadly support the hypothesis, noting that Grilli and Yang (1988) have been particularly influential. Cashin and McDermott (2002) find a small downward trend in real commodity prices since the 1860s, but note it is swamped by the (increasing) volatility.
7 The Economist index includes rural commodities as well as minerals. The ‘real’ version is calculated by deflating by the US GDP deflator. See Gillitzer and Kearns (2005) for a description.
8 Other commodities included aluminium and copper, but as the main focus in this paper is iron ore and coal, the analysis here focuses on steel.
