The Australian economy grew by 2.3 percent in 2004-05, following strong growth in the previous year. This outcome was weaker than the 2004-05 Budget and MYEFO forecasts.1
Notwithstanding modest output growth, employment increased by a strong 3.0 percent in 2004-05, reducing the unemployment rate to a 28-year low of 5.0 percent by the end of the year. In addition, the participation rate rose to a then record high of 64.6 percent by June 2005. Nominal wages growth was contained, with significant wage pressures confined to a small number of industries. Inflation remained around the middle of the RBA target band, with little evidence of any substantial second-round price effects from the 34percent increase in oil prices over the year.
Household consumption growth moderated in line with a mild downturn in the dwellings sector, with household wealth accumulation slowing as house prices flattened. The decision by the Reserve Bank to increase the cash rate by 25 basis points in March 2005 may have also impacted upon growth in both of these sectors. Business investment grew strongly in 2004-05, supported by solid growth in corporate profits and high rates of capacity utilisation across a broad range of industries.
Although the world economy grew at its fastest pace in close to 30 years, led by China and the United States, this was not reflected in Australia’s export volumes — due largely to lingering effects of the rapid appreciation of the exchange rate in 2003-04 and a variety of constraints in the resources sector. Import volumes, on the other hand, grew strongly, supported by solid domestic demand. However, strong world growth did generate surging commodity prices, pushing the terms of trade to 30-year highs. The current account deficit widened to 6.4 percent of GDP in 2004-05 from 5.6 percent in the previous year.
The domestic economy – forecasts and outcome
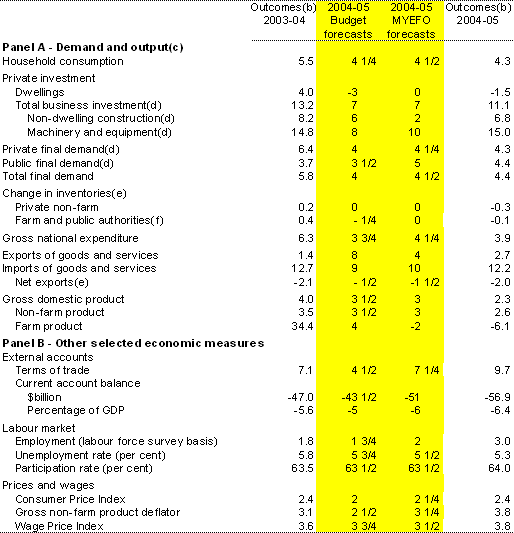
Real GDP growth in 2004-05 was weaker than in the preceding year, and less than forecast at Budget (in May 2004) and MYEFO (in December 2004). Table 1 provides details.
At the time of the 2004-05 Budget, the Australian economy was forecast to continue to grow solidly, with the sources of growth expected to rebalance from the domestic to the external sector. Household consumption growth was expected to moderate in line with a modest fall in dwelling investment, while exports were expected to rebound as the recovery in the world economy gained strength and rural production increased.
At MYEFO the forecast for GDP was revised down, largely reflecting expectations of weaker export growth. This was primarily due to prospects of lower yields from grain harvests and lower production in the resources sector. A stronger forecast for domestic final demand provided a partial offset, with consumption expected to respond to a number of Budget initiatives (including tax cuts and increases in the Family Tax Benefit).
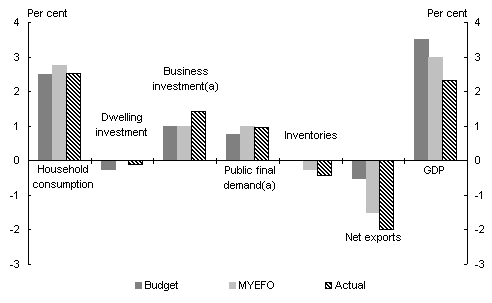
Chart 1: Contributions to GDP growth in 2004-05
Source: ABS cat. no. 5204.0 and Treasury.
- Excludes second-hand asset sales between business investment and public final demand.
GDP growth in 2004-05 was below both the Budget and MYEFO forecasts, with the anticipated rebalancing of growth not unfolding to the degree that was expected (Chart1). As forecast, growth in domestic demand moderated in 2004-05, although the composition of growth differed somewhat from the forecasts. Consumption growth was slightly weaker than expected at MYEFO (as households appeared to save a more substantial proportion of the proceeds from the Budget initiatives than anticipated), while business investment growth was considerably stronger than forecast at Budget and MYEFO.
Table 1: Domestic economy forecasts(a)
- Percentage change on preceding year unless otherwise indicated.
- Calculated using original data.
- Chain volume measure.
- Excluding second-hand asset sales between the business and public sector.
- Percentage point contribution to growth in GDP.
- For presentation purposes, changes in inventories held by privatised marketing authorities are included with the inventories of the farm sector and public marketing authorities.
Source: ABS cat. no. 5204.0, 5302.0, 6202.0, 6345.0, 6401.0, unpublished ABS data and Treasury.
However, Australia’s net export position did not improve in 2004-05. Export growth was weaker than expected, largely reflecting constraints in the resources sector and a fall in farm production, while imports were stronger than expected. The anticipated rebalancing of growth from the domestic to the external sector nevertheless began to emerge in the second half of 2004-05.
Household consumption
Household consumption increased by 4.3 percent in 2004-05, following 5.5 percent growth in the previous year, in line with the Budget forecast.
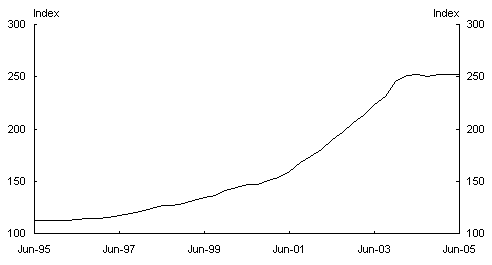
As anticipated at Budget, consumption growth moderated as household wealth accumulation slowed, reflecting the long-anticipated easing in the housing cycle. Nominal house prices were flat in 2004-05, with falls in Sydney and Melbourne balanced by modest rises in Brisbane and Perth (Chart2). Growth in real household wealth eased as a result, increasing by 9.5 percent in 2004-05 (compared to 17.9 percent growth in the previous year), with the strong rise in the stock market in 2004-05 contributing to this increase.
Chart 2: ABS established house prices
Source: ABS cat. no. 6416.0.
With household income continuing to grow strongly in 2004-05, the slowing in consumption growth was associated with a modest improvement in household saving. This development was neither unexpected nor unwelcome, as consumption had been growing ahead of income for a number of years, supported by strong increases in household wealth and facilitated by increased access for consumers to their housing equity and other forms of credit.
Dwelling investment
Dwelling investment decreased by 1.5 percent in 2004-05, a very mild downturn relative to previous dwelling investment cycles.
The downturn was smaller than forecast at Budget, when the lagged effects of previous interest rate increases and an apparent weakness in underlying demand for dwellings were expected to lead to a modest fall in detached housing construction. Medium-density construction was also expected to fall at Budget amid concerns of oversupply in the Sydney and Melbourne inner-city apartment markets.
The mild nature of the downturn reflected the absence of the usual triggers for a downturn, such as sharp increases in interest rates or the unemployment rate. It also reflected strong growth in household incomes through 2004-05, underpinned by strong employment growth and solid wages growth.
Business investment
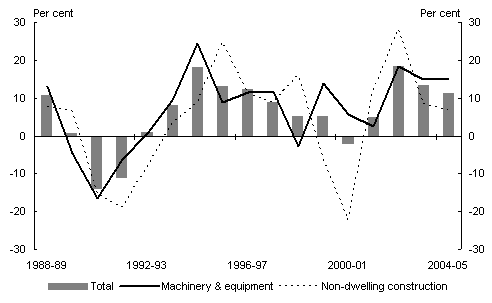
Business investment grew strongly in 2004-05, supported by a solid increase in corporate profits, strong corporate balance sheets and a low cost of capital (Chart3). The 11.1 percent increase was greater than the Budget and MYEFO forecasts.
Chart 3: Business investment
Annual percentage change
Source: ABS cat. no. 5204.0 and Treasury. Excluding second-hand asset sales from the public sector.
Investment in machinery and equipment increased by a very strong 15.0 percent in 2004-05, well above forecasts. Growth was strong across a broad range of industries, consistent with sustained high rates of capacity utilisation in most sectors and ongoing solid profit growth.
Investment in non-dwelling construction increased by 6.8 percent in 2004-05. Engineering construction investment grew strongly, following three years of very strong activity — driven largely by investment in road infrastructure, particularly ongoing investment by the private sector in public infrastructure. Non-residential building investment increased solidly, underpinned by investment in the retail sector. The MYEFO forecast for non-dwelling construction investment was downgraded from Budget amid concerns that some of the larger proposed engineering construction projects, particularly in the resources sector, could be delayed due to firms having difficulty in finding appropriately skilled labour.
Public sector
Public final demand increased by 4.4 percent in 2004-05, stronger than the Budget forecast (but weaker than the MYEFO forecast), with both Commonwealth and State and local final demand growing above trend.
Public sector consumption growth was solid, with all levels of government increasing spending at around trend rates of growth. However, public sector investment increased strongly at all levels of government. In particular, Commonwealth defence investment rebounded very strongly after a substantial fall in 2003-04. Investment by State and local public corporations also increased strongly after a small decrease in the previous year.
External sector
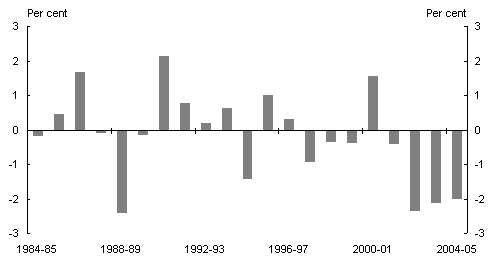
Net exports subtracted 2.0 percentage points from output growth in 2004-05, as the anticipated rebalancing of growth failed to unfold as expected (Chart4). This outcome was substantially weaker than forecast, with stronger-than-expected growth in import volumes and the anticipated boost in commodity export volumes taking longer than expected to materialise. Nevertheless, the anticipated rebalancing did begin to emerge in the second half of 2004-05.
Export volumes increased by 2.7 percent in 2004-05, well below forecasts. All categories of goods exports recorded subdued growth, while service exports were flat.
Despite a stronger-than-anticipated increase in world growth, non-rural commodity exports were weaker than expected.2 There has been significant investment undertaken in the resource sector in recent years in response to burgeoning global demand for commodities. However, as the lead times associated with some projects have been longer than anticipated, production has taken longer to come on-line. Although strong, coal export volumes were hampered by a variety of constraints in coal supply chains, while declining productivity in some oil fields and a number of unexpected gold mine closures curbed production in these sectors.
Chart 4: Net exports
Contribution to annual percentage change in real GDP
Source: ABS cat. no. 5204.0.
Rural exports were also weaker than expected, reflecting a fall in rural production (following a record winter grains harvest in 2003-04). Rural production was hampered by unfavourable rainfall distribution and timing in several crop-growing regions in late 2004 and early 2005.
Exports of manufactures were again weak in 2004-05, although in line with expectations. The ongoing poor performance of this export category reflects increased competition as low-cost economies increase the complexity of their exports, the maturation of the sector within Australia and a relatively high exchange rate.
Service exports were much weaker than expected, following three years of poor outcomes, with both tourism and education-orientated service exports posting weak results. The impact of increased security concerns and a relatively high exchange rate are important factors in explaining this trend.
Imports increased by 12.2 percent in 2004-05.3 This result was stronger than the Budget forecast, in part reflecting a greater-than-expected increase in gross national expenditure. The strong outcome was led by very strong growth in capital goods imports, particularly machinery and industrial equipment, reflecting the strong outcome for business investment. Growth in consumption goods imports was also strong.
Although the expected growth in export volumes failed to materialise, the price of exports increased strongly in 2004-05, most notably for iron ore and metallurgical coal. This is reflected in the terms of trade, which increased by almost 10 percent in 2004-05, significantly greater than was forecast.
Chart 5: Current account balance and components
Per cent to GDP
Source: ABS cat. no. 5204.0.
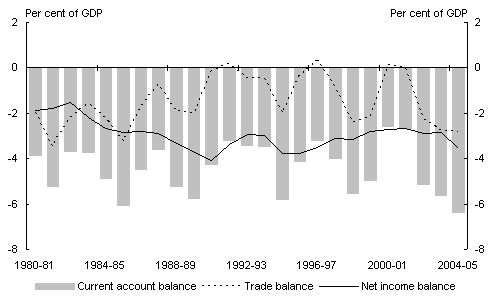
The CAD widened from 5.6 percent of GDP in 2003-04 to 6.4 percent in 2004-05, well above forecasts (Chart5). Despite the large increase in the terms of trade, the nominal trade deficit remained relatively unchanged, with growth in import volumes exceeding growth in export volumes. At the same time, the net income deficit widened from 2.9 percent of GDP to 3.5 percent, reflecting increased income flows overseas (largely a consequence of the level of foreign ownership of Australian mining companies).
Labour market
Employment growth was significantly stronger than expected in 2004-05. At Budget, employment growth was expected to ease in 2004-05, in line with the forecast moderation in economic growth, particularly given that much of the expected growth in 2004-05 was anticipated to be in capital-intensive industries, such as mining. While economic growth moderated in 2004-05, employment did not follow (see Box1:Perplexing labour market trends).
The strong employment outcomes recorded throughout 2004-05 reduced the unemployment rate from 5.6 percent in June2004 to a 28-year low of 5.0 percent by June2005.
Wages
Wage increases were solid but contained in 2004-05, with the Wage Price Index (WPI) increasing by 3.8 percent in year-average terms, in line with Budget expectations.
Despite the stronger-than-expected increases in employment in 2004-05, and a low unemployment rate, strong wage increases remained confined to particular occupations and industries. This can be attributed, in part, to Australia’s more flexible labour market. Within the private sector, the most significant increases in wages were in the fast-growing construction and mining industries. In contrast, the most subdued outcomes were recorded for the accommodation, cafes and restaurants sector and the transport and storage sector.
Public sector wages continued to increase at a greater rate than private sector wages in 2004-05, with the WPI for public sector employees rising by 4.3 percent compared to 3.7 percent growth for private sector employees.
Prices
Inflation was moderate in 2004-05, with the Consumer Price Index (CPI) increasing by 2.4 percent in year-average terms. This outcome was greater than forecast, primarily due to the larger-than-expected increase in oil prices.
Automotive fuel was a major contributor to inflation in 2004-05. Oil prices increased substantially over the year, from $54.8 per barrel (WTI) in the month of
June 2004 to $73.4perbarrel in June 2005 (an increase of 34.0 percent). Abstracting from the direct effect of oil prices, inflation was subdued, with the CPI excluding automotive fuel increasing by 2.0 percent in 2004-05. This suggests that the increase in oil prices did not result in any significant second-round price effects.
House purchase prices were also a major contributor to inflation, reflecting ongoing increases in material and labour costs in the construction industry. Other significant contributors to inflation included food, health services and education.
|
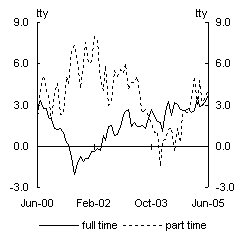
Box 1: Perplexing labour market trends The labour market surpassed all expectations in 2004-05. The unemployment rate reached a 28-year low, a record 10million people were in employment at the end of the year and the participation rate reached a record high. Strong employment growth in 2004-05 was recorded in both full-time and part-time jobs (ChartA). Chart A: Full-time and part-time employment growth
Source: ABS cat. no. 6202.0. Trend rates of growth in economic output generally produce around trend rates of employment growth with a lag of around two quarters. However, employment grew by 3.0 percent in 2004-05, well above the |
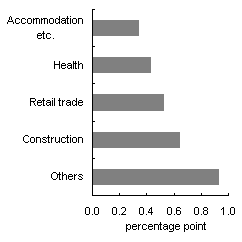
10-year average of around 2 percent,despite the non-farm economy growing slightly below trend. Part of the underestimation can be explained by a disjoint that developed between growth in the non-farm economy and growth in employment. That said, the exceptionally strong employment growth was driven by strong growth in some key sectors of the economy. The construction sector grew strongly through the year to June 2005 which led to very strong employment growth. While domestic consumption eased slightly from the very strong growth rates in the previous two years, employment growth in the retail sector remained strong (ChartB). Chart B: Industry contribution to employment growth
Source: ABS cat. no. 6291.55.001. |
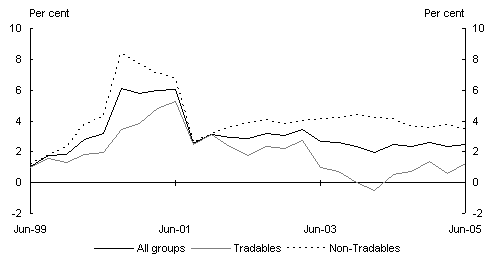
The difference between non-tradable and tradable inflation diminished in 2004-05 relative to the previous year (Chart 6). Non-tradable inflation decreased from 4.2 percent to 3.6 percent (in through-the-year terms), consistent with easing domestic demand, while tradable inflation increased from 0.2 percent to 1.0 percent, largely reflecting the increase in oil prices.
Chart 6: Consumer price inflation
Percentage change through the year
Source: ABS cat. no. 6401.0.
The world economy
The world economy grew by 5.1 percent in 2004, its fastest pace in close to 30 years, after expanding by 4 percent in 2003. This outcome exceeded both the Budget and MYEFO forecasts of 4 percent. Growth was strong across most regions, but emerging market and developing economies in particular recorded surprisingly strong growth.
Global growth moderated over the latter part of 2004, as the effects of high oil prices and tighter policy, particularly in the United States and China, took hold. Growth in Japan and the euro area was much weaker; indeed, the Japanese economy recorded two quarters of negative growth in the middle of 2004.
The impact on growth from higher oil prices was not as significant over 2004 as had been widely predicted. The common ‘rules of thumb’ relating oil price rises to output slowdowns were largely based on episodes of supply contractions rather than the current experience of strong increases in demand.
One channel through which high oil prices affect the global economy is the response by monetary policy authorities to higher energy prices and, potentially, broader inflation and inflation expectations. Whilst the impacts of higher oil prices raised headline inflation in some countries, measures of core inflation remained contained, with little evidence of a systemic increase in inflationary pressure. Consequently, monetary authorities did not respond to higher oil prices with interest rate rises as they had in previous episodes, as credible policy frameworks served as an anchor for inflation expectations in many developed economies.
Chart 7: World growth(a)
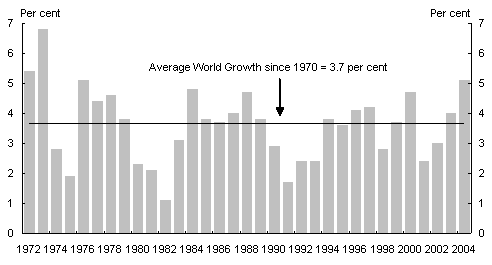
- World GDP growth rates are calculated using GDP weights based on purchasing power parity.
Source: International Monetary Fund.
Global growth picked up in early 2005, with a number of countries, such as China, the US and Japan, recording strong outcomes. During the second quarter of 2005, signs of potential weakness emerged, but leading indicators remained consistent with continuing expansion in the global economy.
Developments in key regions
In the United States, GDP grew by 3.7 percent in 2004-05. Private consumption and business investment were the major drivers of growth. Net exports detracted from growth, as the US trade deficit expanded further. Employment growth was strong over 2004-05, with the US economy adding 2.1million jobs. Strong corporate profits resulted in unexpectedly high corporate taxes, helping the US fiscal deficit to contract slightly in 2004-05.
An interesting, and significant, feature of the global economic landscape over the course of 2004-05 has been the response of financial markets to the removal of monetary stimulus by the US Federal Reserve. Over the course of 2004-05 the USFederal Reserve increased the benchmark federal funds rate by 225 basis points to 3.25 percent. Over that time, the yield on long-term US Treasury bonds fell by nearly 70 basis points to be 3.94 percent at the end of June 2005, with the spread over cash rates falling by around 300 basis points.
An excess of saving over investment in a number of regions, including emerging Asian economies and oil exporters, flowed into US asset markets, resulting in low long-term US bond yields.4 Low bond yields resulted in US consumers enjoying a sustained run of low mortgage interest rates.5 The consequent increase in borrowing activity by US households has resulted in US house prices rising at their fastest pace in more than 25 years in 2004-05.
As a result of significant borrowing by the US public sector and US households, the US current account deficit increased over the course of 2004-05, reaching a record US$750billion, or 6.2 percent of GDP.
China’s GDP grew by 9.4 percent in 2004-05. Policy tightening, such as industry specific investment restrictions, undertaken by the Chinese authorities over 2003 and 2004 was successful in dampening investment. Investment growth remained the main component of GDP growth in 2004-05, though net exports made an increasingly important contribution. Whilst investment in the sectors targeted by the Chinese authorities moderated, investment levels remained elevated. Increasingly, funds have flowed into some of the bottleneck sectors of the Chinese economy, such as rail and power infrastructure.
The Japanese economy began 2004-05 in recession, though the contraction was not
apparent until another of the frequent and large revisions to national accounts data had occurred. The economy recovered over the course of 2004-05 to expand by 1.7 percent. Economic fundamentals have improved in recent years, and structural reforms have lifted business sentiment and corporate profits. The labour market picked up, with the unemployment rate reaching near seven year lows in June 2005.
The rest of East Asia6 grew by 4.7 percent in 2004-05. Domestic demand has remained solid across East Asia, although some weakness remained in Korea, as the economy continued to recover from the unwinding of the household credit bubble in 2003. Growth in East Asia’s large export sector eased, due to a slowing in the global information and communication technology cycle, and, more generally, moderating world demand. Weaker import demand from China affected exports from Korea and Taiwan in particular.
Euro area growth remained subdued, with the expected recovery faltering, as GDP expanded by 1.5 percent in 2004-05. Net exports were the major contributor to growth with weakness in domestic demand continuing. Monetary policy remained accommodative, but inflation has been around the target band of close to, but below, 2 percent. Euro area fiscal policy remained loose, with the major economies exceeding the euro area’s Stability and Growth Pact limit of budget deficits of 3 percent of GDP, in some cases by significant amounts.
Whilst the United Kingdom economy outperformed that of the euro area in 2004-05, GDP growth of 2.2 percent was weaker than expected at Budget. Higher interest rates and a cooling housing market caused consumption to slow sharply in early 2005.
Higher oil and commodity prices were a significant factor in the exceptionally strong performance of many developing and emerging market economies in 2004. Favourable financial market conditions also supported activity.
Growth in Latin America exceeded expectations, with the region recording its highest rate of growth since 1980. In particular, Mexico, Venezuela and Argentina benefited from strong prices and robust demand for oil and other commodities. Oil revenues and increased agricultural production facilitated sub-Saharan Africa growing at its fastest rate in almost a decade. The economies of emerging Europe also performed strongly, particularly Turkey.
1 This article is based on the annual national accounts, and was completed prior to release of the September quarter accounts.
2 Mining commodity exports are discussed further in another article in this issue of the Economic Roundup, see pages 1 to 15.
3 Imports were discussed in an article in the Summer 2004-05 issue of the Roundup.
4 A further discussion of low bond yields in the US and Australia appears in the article on this topic in this issue of the Economic Roundup.
5 Only around a third of US household mortgages are on variable interest rates. The majority are fixed, often over the life of the mortgage, and are driven by long-term bond yields.
6 Hong Kong, Indonesia, Korea, Malaysia, the Philippines, Singapore, Taiwan and Thailand.
