Sian Fenner1
Japan continues to be a major source of trade and direct foreign investment for Australia and the Asia Pacific region more broadly. In the coming decades Japan is facing major challenges including profound demographic pressures. This paper examines Japanese growth prospects through a 3P framework—population, participation and productivity—and illustrates the importance of productivity growth in offsetting the effects of declining population and aggregate labour force participation. Without further structural reforms, particularly in the labour market and non-tradeable sectors, labour productivity growth will remain subdued and Japanese potential GDP growth constrained.
Japan and the region
Japan is the third largest economy in the world and continues to be one of Australia’s and the region’s largest trading partners.2 Australia’s exports to Japan are nearly 20percent of total exports, and the stock of Japan’s foreign direct investment in Australia is over A$49billion.3 Despite growing export demand from the rest of Asia, in particular China, Japan’s relative importance to Australia’s economy will remain strong.
Japan continues to play a strong economic role in the region. It has been the largest source of foreign direct investment and bank lending to East Asia although this has declined since the Asian financial crisis. Japan is also a major export destination for East Asia particularly Southeast Asia.
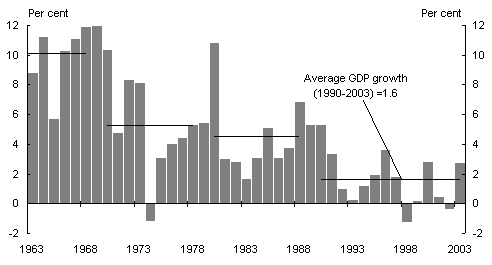
The focus of this paper is on Japan’s medium-term economic prospects using simple growth accounting methods. To start, it is useful to briefly look at Japan’s transition from an economy enjoying sustained strong rates of growth to one experiencing average GDP growth of just 1.6per cent since 1990.
Japanese economic growth post World War II
After World War II, the Japanese economy experienced a sustained expansion. GDP growth averaged around 10.1per cent in the 1960s, 5.2percent in the 1970s, and 4.6percent in the 1980s, slowing because the economy had essentially caught up to the levels of other OECD countries (Chart1).
Chart 1: Japanese GDP growth
Source: CEIC database.
The rate of economic growth, in both GDP and GDP per capita terms, saw Japan acclaimed as a model economy for developing countries, especially across East Asia. The formula for success was thought to be built on a comparative advantage in the manufacturing sector over many industrialised economies. The Japanese were quick to implement new technologies, and their culture of a strong work ethic and company loyalty were touted as keys to success.4 The heavy involvement of government in the economy and links between government, banking and industry also played a large part in Japan’s economic development. But this same system proved unsustainable for an advanced industrialised economy with an increasingly uncompetitive non-tradeable sector.
The bursting of the bubble in the early 1990s undermined Japanese economic growth, with GDP growing at an average annual rate of just 1.4 per cent in the four years immediately following the crash. In the 13 years since the bubble burst, there have been recessions in 1993, 1997-98 and 2000-2001, with the economy growing at an average annual rate of just 1.6 per cent.
Low levels of growth in the 1990s have been due to a combination of factors including banks’ inability to lend, low investment from firms trying to improve the health of their balance sheets, and poor economic management (Hayashi and Prescott (2002), Posen (2000) and the OECD (2000)).
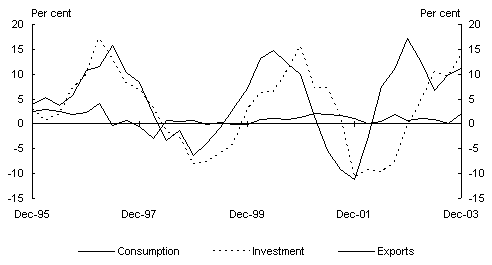
More recently, economic activity in Japan has rebounded with Japanese GDP growth exceeding expectations in 2003, growing at 2.7 per cent. The drivers of growth have been robust exports and strong investment (Chart 2). Although consumption remained weak for most of 2003, a continuing trend from the 1990s, it began to show signs of recovery in the December quarter of 2003 as labour market conditions stabilised. Nevertheless, a sustained pick up in consumption depends on improvements in employment and income.
Chart 2: Japanese exports, investment and consumption
(Through the year)
Source: CEIC database.
Exports remained robust in 2003, growing by about 10 per cent, despite an 8percent appreciation of the yen/US$ exchange rate in 2003. Growth was underpinned by strong demand from East Asia, especially China. The increase in demand for exports from this region offset the decline of about 10 per cent over the year in exports to the United States.
Another source of growth was private investment, which grew by 10 per cent in 2003 after contracting in 2002. Strong investment has been the result of an improvement in corporate profits and business expectations, as well as successful balance sheet adjustment.
GDP growth may have been exaggerated by underestimation of GDP deflators, especially for private investment. This has raised questions among analysts and Japanese officials over the true magnitude of the economic recovery and, in particular, the true extent of growth in investment. Yet, regardless of Japan’s current cyclical recovery, Japan’s medium-term growth potential will be determined by how effectively it responds to the related challenges of demographic change and reform of its non-tradeable sectors.
Raising Japan’s growth potential
This section focuses on the first of these challenges by examining Japan’s growth prospects through a 3P framework — population, participation and productivity. Population provides an indication of the total amount of labour resources available to produce goods and services; participation determines the number of hours worked for those who are economically active; and productivity determines the volume of goods and services produced per hour worked.
Population
Japan’s population growth rate has been declining since the early 1970s, with the fertility rate falling from 2.2 per cent in 1971 to 1.4percent in 2001, and immigration remaining low. According to World Bank projections, Japan’s population is expected to fall by 2 per cent by 2015 and continue to decline over the next 50 years (Chart 3).5
Chart 3: Population projections
Source: Health, Nutrition and Population statistics (HNP), World Bank.
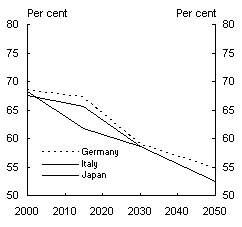
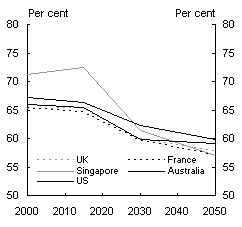
Japan’s economy is already being affected by these demographic pressures. Indeed since 1998 the 15-64 age group has been declining and is expected to fall by an additional 31 million by 2050. The ratio of the number of 15-64 year olds to total population is also expected to decline from 67percent in 2003 to 52percent by 2050 (Chart 4). The accelerated decline in the numbers in 15-64 age group will have an increasingly adverse effect on potential GDP growth (estimated currently at 1-2percent), reducing it by 0.4 percentage points a year between 2003-2008.6
Chart 4: Proportion of population of 15-64 years
|
|
|
Source: Health, Nutrition and Population statistics (HNP), World Bank.
Projected declines in the proportion of the population aged 15-64 years are common among developed countries but, with the exception of Italy, the decline is generally not as severe.
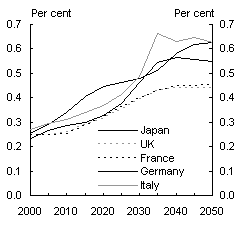
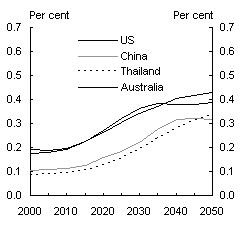
A related economic pressure caused by Japan’s demographic transition is the increase in the proportion of the aged population (65 years and over) relative to the 15-64 age group, the age dependency ratio (Chart 5). This trend is also a characteristic of a number of developed and developing countries but in the case of Japan (and Italy) the rise in the age dependency ratio is much more prominent.
Chart 5: Age dependency ratio
|
High ratios |
Medium ratios |
|
|
Source: Health, Nutrition and Population statistics (HNP), World Bank.
The increase in the age dependency ratio has the potential to worsen Japan’s already heavy fiscal burden. Less labour will be available to produce goods and services, while at the same time there will be more people needing to be supported through welfare. This places stress on the government’s fiscal balance with a smaller tax base available to fund increased outlays on health and welfare. The OECD and IMF note that Japan’s large fiscal deficit of 7.4percent of GDP and large gross government debt of around 154percent of GDP in 2003 is unsustainable in the longer term given the pressures presented by an ageing population.7
Several measures have recently been announced to help alleviate the expected fiscal burden. For example, in December 2003, the government put forward a number of reforms to help reduce the under funded liabilities of the national pension scheme. This includes raising the premium rate of employee pension plans from the current level of 14 per cent to 18 per cent by the year 2018. 8 However, more will be needed in the years ahead to ensure fiscal sustainability.
Participation
Changes in employment growth, or more broadly total labour input, reflect the combined impact of changes in the labour force (aged 15 years and above), labour force participation, unemployment, and average hours worked.
The Japanese labour force will decline in line with the falling working age population. However, the extent of the decline will be influenced by future trends in labour force participation.
Labour force participation rate
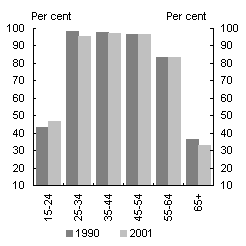
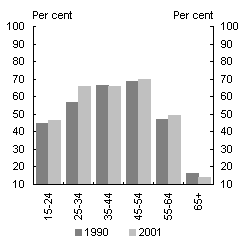
Over the past decade, Japan’s labour force participation rate, for those aged 15 years and above, has declined from around 63 per cent in 1990 to about 62 per cent in 2001.9 Although both male and female participation rates have fallen, males have experienced a larger decline of around 2 percentage points. This largely reflects the fall in the male participation rate for those aged 65 years and above (Chart 6).
Chart 6: Japanese labour participation rate, gender and age cohorts
|
Male |
Female |
|
|
Source: International Labour Office, Year Book of Labour Statistics (2002) and OECD Labour Statistics.
To illustrate the demographic effects, if the 1990 age distribution were applied to the 2001 participation rates for each age cohort, the aggregate participation rate for 2001 would be 64 per cent, compared with the actual rate of 62 per cent. This is because older age cohorts, particularly males, who traditionally work less, constituted a l
arger proportion of the total workforce in 2001 than in 1990. If Japan’s age distribution had not changed, participation would have been 2 percentage points higher and GDP around 2 per cent higher.10
This trend is expected to continue given the projected increases in the proportion of males and females aged 65 years or more. The proportion of people aged 65 years and over is projected to reach 29percent by 2015 and continue to rise after that (Table1).
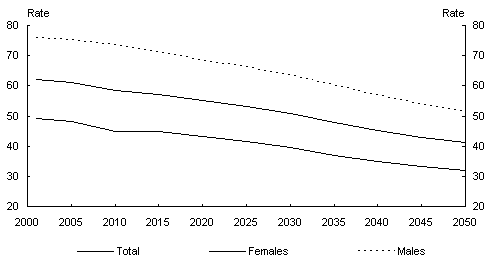
Assuming no change in age specific participation rates, this alone would have the effect of decreasing aggregate labour force participation from 62per cent in 2001 to 57percent in 2015 (Chart 7).
Table 1: Age cohorts as a proportion of working age population
Source: World Bank and Treasury calculations.
The Japanese Ministry of Health, Labour and Welfare (2003) have also projected participation rates, assuming a similar age distribution, to 2025. However, these projections are higher than those in Chart 8 because of an underlying assumption that female and older male participation rates will increase significantly in the future. This highlights two population groups, women and older men, as potential sources of additional labour supply.
Chart 7: Projected labour force participation rates
Source: International Labour Office, Year Book of Labour Statistics (2002), and Treasury calculations.
Men in the 55-64 age group have a participation rate higher than the OECD average, although the rate falls off sharply from the 55-59 year age group to the 60-64 year age group. This largely reflects the existence of a mandatory retirement age of 60 years. Increasing the retirement age has been recognised as a mechanism to improve labour supply in the face of an ageing population by a number of countries facing demographic pressures.
The other source of labour supply identified is females. Although the female participation rate is slightly above the OECD average, there are a number of policies that could increase female participation rates further. Recent policy responses aimed at increasing female participation include increasing child-care facilities and promoting long-term care insurance for the elderly.
Immigration could also be increased to offset part of the decline in labour supply. According to United Nations projections, an average net increase of 381000 immigrants a year, or 17 million immigrants over 2005 to 2050, would be required to maintain Japan’s population at its 2005 level over this period.11
Unemployment rate
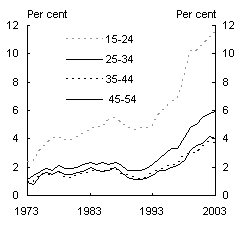
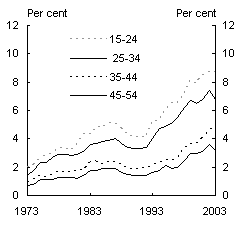
Japan’s unemployment rate has more than doubled from around 2.1 per cent in 1990 to an average of 5.2 per cent in 2003, but still remains one of the lowest among industrialised economies.
Chart 8: Unemployment rate, gender and across age cohorts
|
Male |
Female |
|
|
Source: CEIC database.
Unemployment rates have increased for males and females across all age groups, but most notably for males in the 15-24 and 25-34 years age groups (Chart 8). The rapid rise in youth unemployment may have negative implications for future labour productivity growth, because of reduced work experience. However, this negative effect would be reduced if people in this age group are acquiring education to increase their human capital.
Employment conditions weakened in Japan after 1990 due to sluggish demand, firm restructuring and structural rigidities in the Japanese labour market that impede employment growth. Firm restructuring has tended to focus on replacing permanent employees with temporary workers and reducing the level of new recruits. This partly reflects court rulings inhibiting firms’ ability to retrench labour, fostering firms’ reluctance to permanently hire employees.
The OECD suggests that a possible consequence of the current labour market environment is the underdevelopment of the labour market external to the firm.12 This has resulted in skill mismatch whereby there is a mismatch between the skills of potential employees and those required for employment. It is usually manifest in an outward shift in the ratio of the unemployment rate to vacancies rate (Beveridge curve), a trend that has accelerated in Japan since the late 1990s.
Average hours worked of employees
Over the past two decades the average number of hours worked in Japan has declined by 11 per cent. This is largely attributable to the widespread adoption of a five-day work week, an increase in national holidays and a rise in part-time employment.
The rise in part-time employment seems in part to be the result of current policies distorting the incentive to work full time. For example, there are tax benefits for spouses who work less than 75percent of full time hours and earn less than 1.3million yen a year (about $16250 Australian dollars at an exchange rate of 80yenper Australian dollar). In addition, those meeting these criteria are exempt from contributing to pensions and health insurance.
According to Japan’s Ministry of Labour, about 40 per cent of female part-time workers limit their working hours in response to these policies.13 Removal of some or all of these benefits has the potential to increase the employment of labour resources increasing the efficiency of the declining labour force.
Labour productivity14
Japan’s potential growth has slowed from 4 per cent in the second half of the 1980s to now be around 1-2 per cen
t. 15 This reflects the combination of falling labour inputs and low labour productivity growth. In the absence of any major change to labour inputs, productivity growth will need to strengthen to produce higher potential GDP. Higher productivity growth can be achieved through reforms, particularly to a number of non-tradeable sectors.
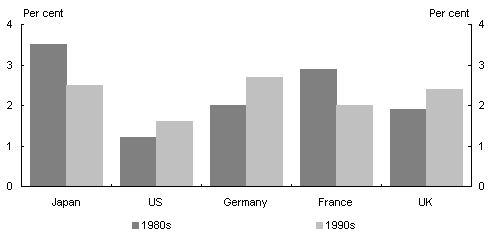
Japanese labour productivity experienced robust growth in the period leading up to the 1990s, driven by high levels of capital accumulation. It slowed in the 1990s, but at an average of 2.5 per cent a year, labour productivity growth was still above that of many OECD countries (Chart 9).
Chart 9: Labour productivity growth across countries
Source: OECD Productivity Database.
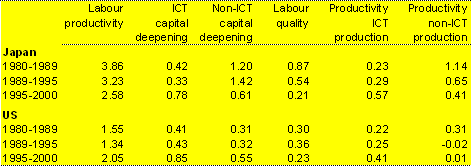
The slowdown in Japanese labour productivity growth has generally been attributed to Japan investing less in information and communication technology (ICT) than the United States. However, Jorgenson (2003) argues that there is an inconsistency between the measure of capital investment in the United States and Japan and once this is rectified levels of ICT investment growth are stronger during the 1990s. However, overall labour productivity still slowed because of reduced growth in non-ICT capital investment and multifactor productivity growth (see Box 1 for further details).
|
Box 1: Jorgenson’s study of Japanese labour productivity Jorgenson (2003) argues that if measurement inconsistencies are remedied, the slowdown in Japanese labour productivity recorded during the 1990s cannot be solely attributed to a slowing of investment in ICT as has been the view of the OECD and various private sector institutions. If Japanese capital investment is measured in a similar manner to the United States, investment in ICT and productivity associated with ICT investment increased over the 1990s and was of a similar magnitude to that in the United States. Jorgenson’s study improves the comparability of Japanese National Accounts and the US National Income and Product Accounts (NIPA) by adjusting Japanese capital investment to include in-house software and package software investment. To ensure consistency, Information Technology (IT) prices for both countries were treated similarly and were derived using a constant-price index that holds performance constant. The resulting harmonised national accounts for Japan suggest that the slowdown in Japanese labour productivity between the 1980s and the late 1990s primarily reflected a fall in non-ICT capital deepening (Table 2). In addition, labour productivity over this period was adversely affected by the slowdown in productivity growth of firms not involved in IT production. For firms in IT production, IT capital deepening and productivity grew more quickly in the latter half of the 1990s compared to the early 1990s. Table 2: Labour productivity growth—Jorgenson Source: Jorgenson (2003). |
Drivers of Japanese labour productivity growth
Labour productivity growth can be decomposed into capital deepening, defined as growth in capital per unit of labour, and multifactor productivity growth, which reflects changes in output not accounted for by changes in combined inputs, such as structural change or technological advance.
According to both the OECD and Jorgenson, the slowdown in Japanese labour productivity in the 1990s reflects a large decline in multifactor productivity (MFP) and a relatively smaller fall in capital deepening for the non-ICT sectors.
Capital deepening
The ratio of capital per unit of labour fell during the 1990s with the fall in labour input being smaller than the fall in the level of capital accumulation. The slowdown in capital accumulation reflects the economic slowdown following the bursting of the asset price bubble as firms restructured their balance sheets and reduced debt instead of investing. In addition, the rate of return to capital declined by 21percentage points during the 1990s.16 This, combined with anaemic demand for goods, may have reduced the incentive for firms to accumulate capital at levels previously experienced.
Incentives to increase the level of capital accumulation such as research and development subsidies, in combination with the projected decline in units of labour, will likely increase labour productivity growth. It will also help promote movement to more higher value added sectors.17 However, capital deepening is only one of the drivers of productivity. It is also important that capital is allocated appropriately to ensure that multifactor productivity does not decline to offset any of the gains from capital deepening.
Multifactor productivity
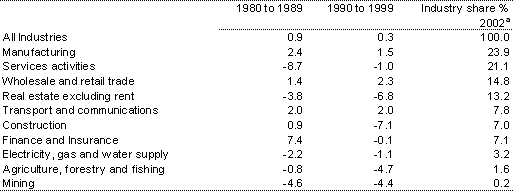
During the 1990s Japanese multifactor productivity (MFP) growth declined by 0.6of a percentage point relative to average growth in the 1980s (Table 3). The manufacturing and wholesale and retail trade sectors, which make up about 40percent of Japanese industry, continued to report strong MFP gains while the level of MFP actually fell in construction, and real estate.
Table 3: Sectoral multifactor productivity growth, annual percentage change
(a) Industry shares are calculated for the represented sectors.
Source: OECD and CEIC database with Treasury calculations.
The disparity in MFP growth across industries has led to the characterisation of Japan as a dual economy with some leading export industries and lagging non-tradeable industries. This is supported by a study undertaken by Baily and Solow (2001) on the inter-sector differences in MFP growth rates (Table 4).
Table 4: Open sectors have high labour productivity, 1999 (US=100)
Source: Baily and Solow (2001) in association with the McKinsey Global Institute.
Japan remains highly productive in export industries such as autos, steel, machinery tools and consumer electronics but non-tradeable sectors such as construction and food processing are less than half as productive as their United States counterparts.
The difference in export and non-tradeable industries has been related to the different competitive pressure and regulation faced by these industries. In addition, government policies and continued lending by banks has sustained the more vulnerable sectors despite declining profitability and high debt levels. This has allowed many low productivity firms to continue to operate with high levels of excess capacity, exacerbating the misallocation of resources.
Concluding comments
After a decade of disappointing growth Japan appears to be experiencing an economic recovery. But Japan’s medium term economic prospects will be constrained by a profound demographic transition as its working age population declines and ages.
By 2050, people aged 65 years and over are projected to account for 38percent of the total working age population. Without changes to labour force behaviour this would decrease Japan’s aggregate labour force participation from 62percent in 2001 to 41percent by 2050.
In the absence of significant immigration and changes to labour input behaviour, Japan’s future growth potential will be largely determined by productivity gains. Achieving these gains will require substantial restructuring and reform of the non-traded goods sector. As shown in Table 3, there is significant potential to increase productivity in such sectors as real estate, finance and insurance and construction. Such reforms would be expected to increase overall productivity through improved resource allocation of labour and capital from low productivity sectors to high productivity sectors, particularly were they to be accompanied by broader reform of the labour market and public sector.
Delaying these reforms will result in continued weakness in Japan’s economic performance and only add further pressure to Japan’s fiscal position and debt burden.
References
Baily, M. and Solow, R. (2001), International productivity comparisons built from the firm level, Journal of Economic Perspectives, vol 15, no.3, pp.151-172.
CEIC database
Department of Foreign Affairs and Trade, Country Brief Japan.
http://www.dfat.gov.au/geo/japan/index.html
Fujiwara, I., Hara, N., Hirose, Y., and Teranishi, Y., (2004), The Japanese Economic Model: JEM, Bank of Japan Working Paper, no.04-E-3
Fukao, K. and Miyagawa, T., (2003), Japan’s economic growth seen through Industry level and firm level data, prepared for ESRI International Conference ‘Potential Growth of the Japanese Economy,’ Tokyo.
Hayashi, F. and Prescott, E.C., (2002), The 1990s in Japan: A lost decade, Review of Economic Dynamics, vol.1, no.5, pp.206-235.
International Monetary Fund, (2003), Japan Article IV.
International Labour office, (2002), Year Book of Labour Statistics.
Jorgenson, D., (2004), Information Technology and the G7 Economies.
http://post.economics.harvard.edu/faculty/jorgenson/papers/papers.html
Ministry of Health, Labour and Welfare (2003), Economic and Social Change and Diversification of Working Styles, White Paper on the Labour Economy.
Ministry of Health, Labour and Welfare, (1995), General Survey on Part Time Workers.
National Institute of Population and Social Security Research, Selected Indicators for Japan.
http://www.ipss.go.jp/English/S_D_I/Indip.html
Organisation for Economic Cooperation and Development, (2001) Economic Outlook June no.69.
Organisation for Economic Co-operation and Development, (2003), Economic Surveys Japan.
Organisation for Economic Co-operation and Development, (2002), Labour Force Statistics 1981-2001.
Organisation for Economic Co-operation and Development, (2004), Productivity database.
Posen, A., (2001), Unchanging innovation and changing economic performance in Japan, Institute for International Economics.
United Nations, (2000), Replacement Migration: Is it a solution to declining and ageing populations?, Department of Economic and Social Affairs (DESA).
World Bank, Health, Nutrition and Population statistics.
http://devdata.worldbank.org/hnpstats/DPselection.asp
1 The author is from the International Economy Division, Australian Government Treasury. Helpful comments and suggestions were received from Steven Kennedy, Brenton Goldsworthy, GordondeBrouwer, BrianThomas, Heather Smith, David Gruen, Ron Foster, and MartinParkinson. The views in the article are those of the author and are not necessarily those of the Australian Treasury.
2 Ranking of the Japanese economy is based on a purchasing power parity (PPP) measure of GDP.
3 Latest available data from the Department of Foreign Affairs and Trade.
4 Posen (2001).
5 The Japanese National Institute of Population and Social Security Research forecasts a slightly lower population over the time horizon out to 2050.
6 OECD (2003).
7 OECD (2003) and IMF (2003).
8 Ministry of Health, Labour and Welfare (2003).
9 The latest data available from the International Labour Office for Japan is 2001. These data are used to make labour force participation rates internationally comparable.
10 Based on Bank of Japan’s labour input share of output.
11 United Nations (2000).
12 OECD (2003).
13 Ministry of Labour Report (1995), General Survey on Part Time Workers.
14 Labour productivity is measured as the amount of goods and services produced divided by the units of labour used to produce them.
15 Japan’s potential growth rate has been estimated at 1.3 per cent by the OECD (2003).
16 OECD ( 2001).
17 Fukao and Miyagawa ( 2003).
