Jason Russo and David Hedley1
Aggregate labour market outcomes mask some significant compositional developments at the State and industry level. Solid employment outcomes in the past couple of years have been concentrated in sectors that have benefited from strong domestic demand, but this has partially been offset by a drag on employment growth from adverse shocks to the economy such as the impact of drought. In a distributional sense, employment growth has been strongest in the States that have recently experienced strengthening population growth.
Additionally, there have been longer-term changes in the structure of the Australian labour market, particularly the composition of hours worked. The growing share of part-timers in the labour market may point to a potential source of additional labour supply, as part-timers may inherently be more willing (and able) to work additional hours.
Looking ahead, demographic projections suggest significant changes in labour market trends in future, which have longer-term policy implications. Even if relatively positive assumptions are made about population growth, the ageing composition of Australia’s population is likely to act as a constraint on employment growth by the end of this decade.
Introduction
This article examines several compositional aspects of the Australian labour market. Whilst the unemployment rate is a key macroeconomic barometer, a slightly more disaggregated examination of developments in the labour market can provide additional insights. As such, industry and State dynamics are pivotal to examining the impact of economic developments on labour market outcomes.
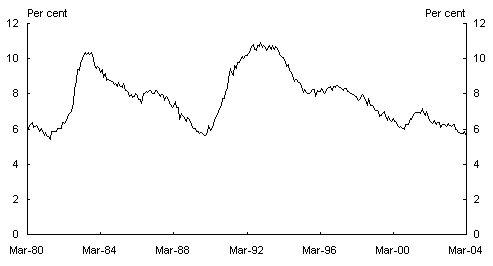
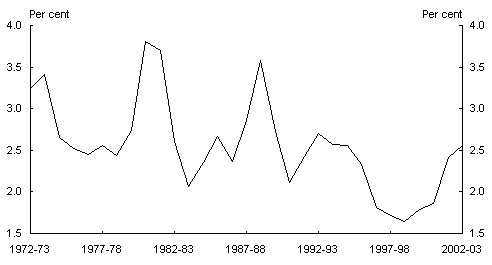
Over the past year Australia has enjoyed robust labour market conditions. For the first time in over a decade Australia’s unemployment rate has fallen below 6percent (Chart 1).
Chart 1: Unemployment rate
Source: Australian Bureau of Statistics cat.no.6291.0.55.001.
This has occurred despite several shocks to the economy, such as the impact of drought and a substantial subtraction from GDP growth by the external sector. The Australian labour market appears to have acquired the capacity to better adjust to significant overall shifts in the economy, including adverse shocks.
Indeed, in recent times the Australian economy has displayed considerable resilience in the face of several shocks. This ability to ride through economic shocks while still recording solid GDP growth and low inflation may point to the cumulative dividends from previous economic reforms, although a full analysis of this issue is beyond the scope of this paper.
Over the longer term, there have been fundamental changes in the composition of the labour market. In particular, strong growth in part-time employment has seen part-time workers increase significantly as a share of total employment. There are some reasons to believe this trend may continue, which are canvassed below.
The growth in part-time employment may have some positive spin-offs in terms of the ability of the labour market to respond to economic shocks, as part-timers may inherently have a greater capacity to accommodate changing work patterns or to work additional hours.
These compositional aspects of the Australian labour market are reviewed in further detail below, before ending with a brief examination of some of the implications from the projected age composition of Australia’s population.
Industry developments in the labour market
In recent times, the labour market has been able to respond to significant shifts in the drivers of economic growth. Solid employment outcomes have been concentrated in areas of strong domestic demand (but partially offset by adverse shocks, such as a weak external sector).
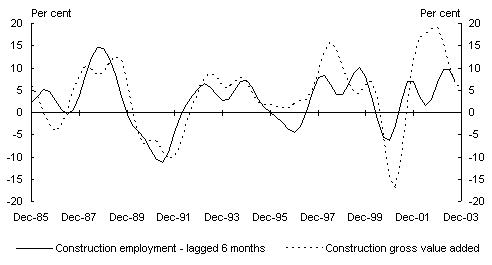
Australia’s employment growth in recent years has been driven by industry-specific developments in the economy, such as the construction cycle (Chart 2).
Chart 2: Construction output and construction employment(a)
(Quarterly, through-the-year growth)
(a) Growth in construction employment is presented with a six month lag to illustrate activity typically leading employment growth.
Source: Australian Bureau of Statistics cat.no.6203.0 and 5206.0.
The construction cycle produces a multiplier effect for other industries, such as manufacturing and property and business services. However, such industry specific developments do not necessarily permeate the entire economy.
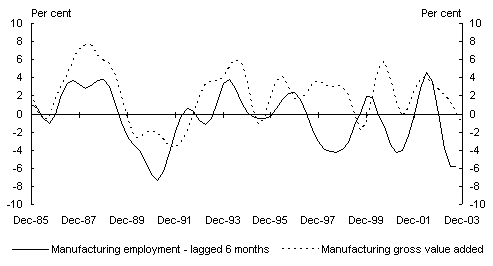
Whilst particular segments of the manufacturing industry have benefited substantially from the construction cycle, employment in this industry (Chart3) is influenced by many other economic developments.
Chart 3: Manufacturing output and manufacturing employment
(Quarterly, through-the-year growth)
Source: Australian Bureau of Statistics cat.no.6203.0 and 5206.0.
For example, export oriented manufacturing sectors have also been influenced by less favourable external conditions, particularly weak economic growth among some of Australia’s major trading partners.
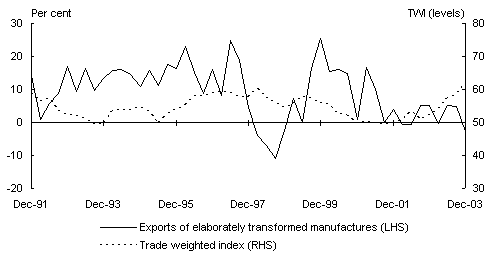
Australia’s exports of elaborately transformed manufactures have grown weakly in the past couple of years, which partly reflects weak international conditions and a sharp appreciation in the exchange rate more recently (Chart 4).
Chart 4: Exports of elaborately transformed manufactures and TWI
(Quarterly, through-the-year growth and level)
Source: Australian Bureau of Statistics cat.no.5302.0.
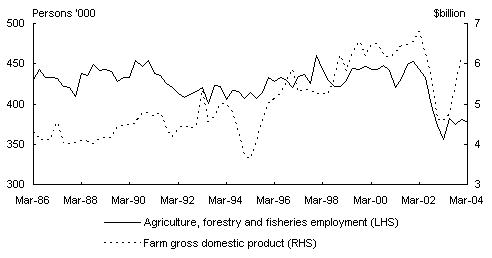
Moreover, recent years have seen several shocks to the Australian economy. For instance, farm employment declined by almost 100,000 persons in the wake of the 2002-03 drought, albeit from high levels fol
lowing a couple of years of favourable conditions (Chart5).2
Chart 5: Farm employment and real farm gross domestic product(a)
(Quarterly, levels)
(a) Farm domestic product data only available to the December quarter 2003. Australian Bureau of Statistics cat.no.5206.0.
Source: Australian Bureau of Statistics cat.no.6203.0 and 5206.0.
Despite adverse shocks from the drought and a weak external sector, changes in the compositional drivers of economic activity have seen continued solid employment growth and the unemployment rate decline steadily. The ability of the Australian labour market to respond to these developments, suggests an inherent degree of flexibility.
Geographic distribution of recent labour market outcomes
The composition of labour market trends can also be viewed in a distributional sense, to assess whether there are particular States or regions that are driving aggregate outcomes. For the purpose of this article, distributional outcomes are confined to examination at the State level.
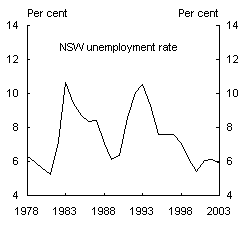
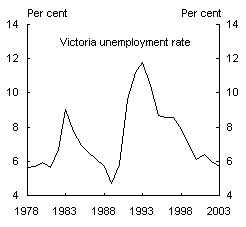
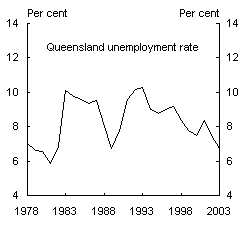
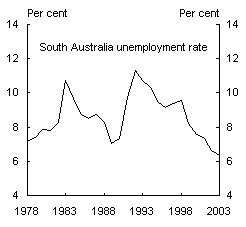
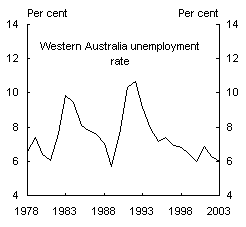
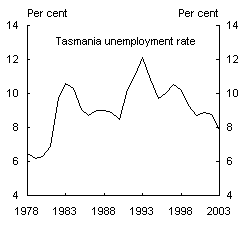
Some interesting pictures emerge from examining labour market outcomes across Australia’s States.3 In aggregate terms, most States have experienced a gradual reduction in their unemployment rate over the past decade (Chart 6).
Chart 6: State unemployment rates
(Annual average)
|
|
|
|
|
|
|
|
|
Source: Australian Bureau of Statistics cat.no.6291.0.55.001.
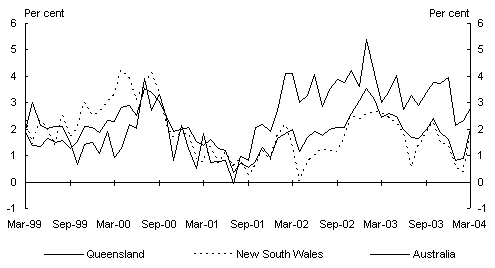
One exception is Queensland, which has experienced relatively stronger employment growth in the past couple of years (Chart 7), which has in-turn been supported by relatively strong population growth.4
Chart 7: Employment growth in Queensland, NSW and Australia
(Monthly, through-the-year growth)
Source: Australian Bureau of Statistics cat.no.6291.0.55.001.
Queensland accounts for around one-fifth of employment in Australia, but it contributed almost half of the total employment growth in Australia through the year to February 2004.
Queensland’s annual employment growth has been stronger than the national average since the middle of 2001, corresponding with its surge in population growth over that period (Chart 8).
Chart 8: Annual growth in the number of people of workforce age5—Queensland
(Year-average growth)
Source: Australian Bureau of Statistics, Population by Age and Sex, Australia, cat.no.3201.0.
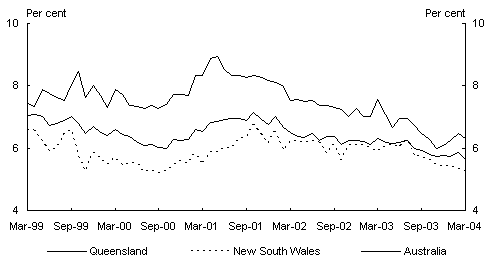
Queensland’s relatively stronger employment growth also saw a relatively faster reduction in that State’s unemployment rate through 2003, although its unemployment rate has risen slightly in recent months (Chart9).
Chart 9: Unemployment rates, Queensland, NSW and Australia
Source: Australian Bureau of Statistics cat.no.6291.0.55.001.
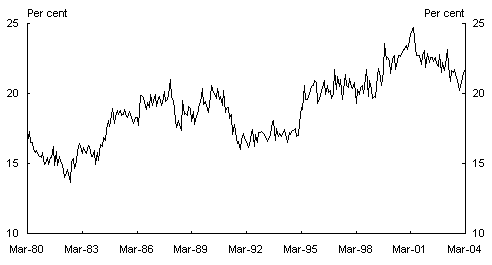
Nevertheless, Qu
eensland’s unemployment rate has declined from a higher starting point in 2001. Queensland’s share of the total number of unemployed persons has therefore also fallen (Chart 10).
Chart 10: Queensland’s share of total unemployment
Source: Australian Bureau of Statistics cat.no.6291.0.55.001.
Tasmania has also recently recorded labour market outcomes stronger than the national average. The surge in employment growth in Tasmania over the past year has seen the unemployment rate decline more sharply than its long-term trend, albeit from a relatively higher starting point compared to other States.
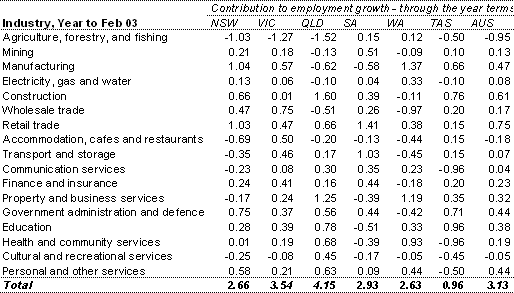
It can also be useful to examine these State labour market outcomes at the industry level (Appendix 1). Queensland’s relatively strong employment outcomes over the past couple of years has been driven by several industries, including construction, retail trade, and property and business services. Queensland’s industry employment outcomes may in turn be generally consistent with Queensland’s relatively strong population growth.
Trends in the hours that people work6
Having looked at recent developments at the industry and State level, it is timely to examine some of the longer-term compositional trends in the labour market.
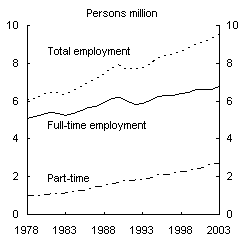
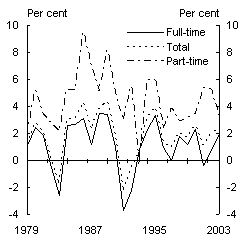
The past 25 years have seen a dramatic change in the composition of the hours that people work. In particular, there has been an increase in the proportion of workers in part-time employment, both male and female (Chart 11).7 On average, part-time employment has grown almost four times as fast as full-time employment in the past 25 years (in through-the-year terms).
Chart 11: Full-time and part-time employment
(Annual, levels and growth)
|
|
|
Source: Australian Bureau of Statistics cat.no.6291.0.55.001.
Nevertheless, the majority of people employed in Australia are still employed as full-time workers, currently around 6.9 million people or a little over 70 per cent of total employment. Part-time workers currently total around 2.7 million people (Chart11).
There are some longer-term trends that may support continued strong growth in part-time employment. An examination of gross flows data for the Australian labour force reveals that people who do not currently have a job (either unemployed or outside the labour market) are more likely to initially find part-time work, rather than full-time work.8
The ageing of Australia’s workforce may see increasing numbers of older workers opting to work on a part-time basis, rather than retiring early altogether. Broader demographic trends are discussed further below.
There also appear to be industry drivers of the trend towards a growing share of part-time employment. Analysis at the industry level indicates that the increasing share of part-time work is a phenomenon occurring across a range of industries.
The majority of the increase in part-time employment growth reflects a more general move to part-time employment whilst a smaller but not insignificant proportion of the change reflects changing industry composition (that is the relative size of industries) within the economy (Appendix 2).
In essence a general increase in part-time employment within industries has remained the main driver of the overall increase in employment (Appendix 2). This shift to part-time work has probably benefited from increasing flexibility in work arrangements, which has allowed people to elect for part-time work.
Average hours worked
Having examined employment on a ‘heads’ basis (that is the levels and proportions of people working part-time and full-time), trends in the actual number of hours worked can be reviewed.
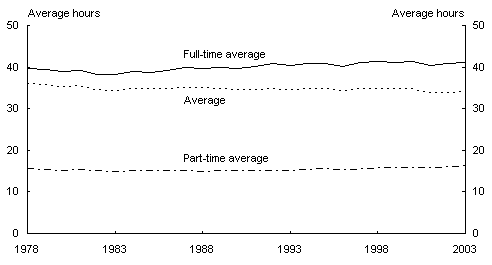
Over the past 25 years, the average number of hours worked by full-time and part-time employees has remained relatively stable (Chart 12), despite significant structural change in the economy and a range of economic shocks.
Chart 12: Average hours worked, full-time, part-time and total
(Annual average)
Source: Australian Bureau of Statistics cat.no.6291.0.55.001.
The average number of hours worked by full-time employees has increased slightly, by around 1.6 hours per week over the past 25 years. Over the 1980s and early 1990s the average number of hours worked by part-time employees was relatively unchanged, but in the past decade the average number of hours worked by part-timers increased by around 1 hour per week.
Whilst the average number of hours worked by both part-timers and full-timers has increased slightly, the rising share of part-time employees in the labour market has actually produced a gradual decline in total average hours worked across the labour market.
Capacity to work additional hours
The share of part-timers in the labour market has grown over time and some of these people may have the capacity to work additional hours. This may be viewed as a potential source of additional labour supply.
The ABS produces estimates of the number of part-time workers that would like to work additional hours.9 On average there were around 725,000 part-time workers that desired additional hours in 2003, or about one-quarter of part-timers. These part-time workers wanted an average of a little over 15 additional hours of work per week.
For illustrative purposes, if these additional hours of labour supply were fully utilised, it would be equivalent10 to almost 320,000 full-time jobs, or more than double that number of equivalent part-time jobs.
To place this figure in context, total
employment grew by around 190,000 persons through the year to March 2004, underpinned by strong economic growth in 2003. This was comprised of around 170,000 full-time jobs and about 20,000 part-time jobs.
Interestingly, the average number of hours sought by part-timers wanting extra hours appears to have gradually declined over time. However, rapid growth in the total number of part-time workers in the labour market is likely to have seen this potential source of spare labour hours grow significantly in aggregate terms over time.11
If part-time employment continues to grow strongly, this source of spare labour hours is likely to expand further. Nevertheless, it is not certain how quickly this source of spare labour supply can be taken up to meet the productive demands of the economy.
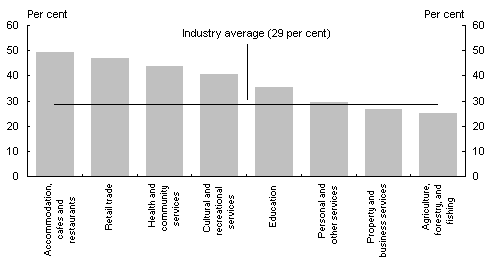
This potential labour supply may be stronger in those industries that have a greater concentration of part-time employees (Chart 13).
Chart 13: Concentration of part-time employment for selected industries
(Year average for 2003)
Source: Australian Bureau of Statistics cat.no.6291.0.55.001.
Broader demographic trends and the labour market
A review of compositional changes in the labour market is not complete without some examination of demographic trends, particularly in the context of Australia’s ageing population.
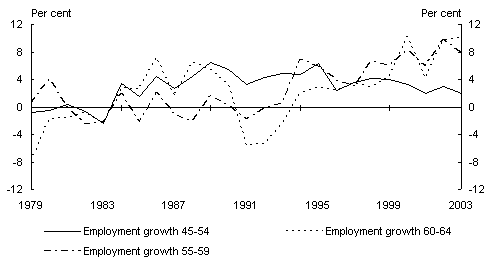
In recent times, there has been strong growth in employment amongst people aged 55to 64 (Chart 14). This may be a positive sign that participation among older workers has been encouraged by continued strength in the economy, or that people are showing a greater willingness to decide against early retirement, as more people move into these age cohorts over time.
Chart 14: Employment growth amongst older cohorts(a)
(Year-average growth)
(a) That is, older cohorts within the population of typical work force age. Typical work force age is generally defined as ages 15-64 for the purposes of this article.
Source: Australian Bureau of Statistics, Labour Force Statistics. Australian Bureau of Statistics cat.no.6203.0.
As a result, the participation rate of older cohorts rose solidly in the past couple of years. The participation rate among people aged 60 to 64 rose most significantly, although, participation rates among older cohorts remain quite low relative to younger cohorts.
Looking further ahead, labour market outcomes will be significantly influenced by the anticipated slowing in population growth and resultant ageing. This has significant implications for labour market participation and employment growth, which are pivotal to sustainable economic growth.
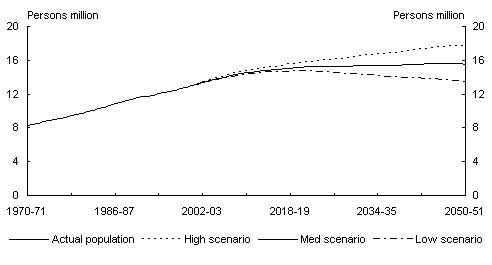
The ABS has produced projections of the number of persons aged 15-64 to the year 2051 (Chart 15).
Chart 15: Population projections ages 15-64
(Annual average)
Source: Australian Bureau of Statistics, Population Projections 2002 to 2051, cat.no.3222.0.
These projections are based on three scenarios that might broadly be characterised as high, medium or low—based on assumptions about fertility, life expectancy and immigration flows.12
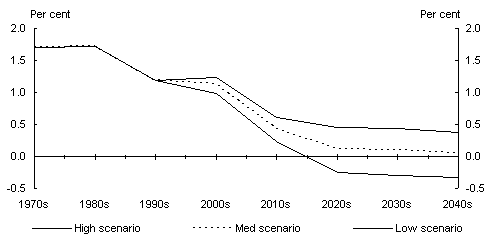
In the context of potential employment growth and labour market participation, it is important to focus on projections for growth among the number of people of typical workforce age (Chart 16).13
Chart 16: Decade-average population growth (ages 15-64)
(Based on projected year-average growth)
Source: Australian Bureau of Statistics, Population Projections 2002 to 2051, cat.no.3222.0.
Relatively high assumptions about population growth could potentially see the numbers of people of workforce age continue to grow at moderate rates this decade. However, the slight increase seen in the higher end of the growth spectrum for this decade in fact reflects relatively solid growth in the decade to date.
Even after allowing for relatively high assumptions about population growth, this is likely to be overcome by the cumulative effects of demographic trends in recent decades. Population growth amongst cohorts of typical workforce age is expected to slow over the remainder of this decade.
People not inside the labour force
The composition of the pool of people not inside the labour force (NILF) is potentially a significant source of additional labour force participants.
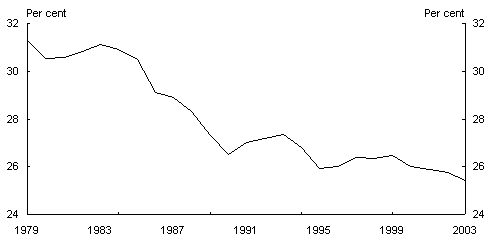
In an aggregate sense, Australia’s continued solid labour market outcomes has seen a decline in the proportion of people of work force age that remain outside the labour force (Chart 17).
Chart 17: Proportion of people aged 15-64 NILF
(Year-average)
Source: Australian Bureau of Statistics cat.no.6291.0.55.001.
As this proportion declines further, policy may have to carry a greater role in encouraging these people to participate in the labour market. Indeed, the rate of decline in the proportion of people remaining outside the labour force appears to have been modest in recent years.
The composition of the pool of persons NILF will be an important consideration in shaping policy. The total number of people NILF who woul
d like to work is estimated by the ABS to be around 1.2 million.14 Yet, significantly, most of them (around 95percent) are not actively seeking work, and around one third of them are unable to start work within a month.
Perhaps of most direct relevance is the group of around 830,000 persons that are classified as being NILF, but characterised as being marginally attached to the labour force.15 This group is largely comprised of persons that would like to work and are available to commence work within four weeks, but are not actively searching for work.
Nevertheless, of the 3.9 million people outside the labour force (aged between 15-69), many of them—around 2.4 million people—do not want to work for a variety of reasons. Encouraging labour market participation among this group may be difficult.
It is possible to argue that many people currently outside the labour market may not be able to work full-time, which may make entry to the workforce more difficult. However, examination of gross flows data for the Australian labour force suggests that people NILF who find jobs are initially more likely to find part-time employment than full-time employment.16 Part-time employment may therefore provide a stepping-stone to labour force participation for some people.
As population growth is likely to slow significantly in coming decades, this will place further emphasis on the need to remove disincentives to work—for example, in order to call on part-time workers to expand their amount of work, or to encourage further people to actively participate in the labour market. Multi-factor productivity gains will also become increasingly important.
Key themes and conclusions
Australia has experienced solid employment growth and a gradual reduction in its unemployment rate in recent years. However, aggregate labour market outcomes can mask some significant compositional changes.
At the industry level, there has been a range of compositional changes in the drivers of economic growth. Strong domestic demand in the past couple of years has seen robust employment outcomes, but this has been partly offset by a drag on growth from a drought affected farm sector and the impact of generally weak external conditions on segments of industries such as manufacturing.
Moderate labour market outcomes have generally been experienced by most States, with gradual declines in unemployment rates. Queensland has experienced relatively stronger employment growth recently, which reflects its stronger population growth.
There is also reason to believe there is a potential source of additional labour supply in the economy, which resides in the growing pool of part-time workers. The ability of part-timers to work extra hours or change work patterns may assist the ability of Australian businesses to respond to changing economic conditions.
Nevertheless, the projected age composition of Australia’s population points to slower growth in the number of people of typical work force age. This is likely to act as a drag on employment growth before the end of this decade.
Policy may therefore play an increasingly significant role in encouraging further participation, removing disincentives to work, and discouraging early retirement. Indeed, the pick up in labour market activity amongst older cohorts in Australia in the past couple of years suggests that such change is possible.
Appendix 1: Industry employment growth by State
Table 1: Industry contributions to employment growth, by State
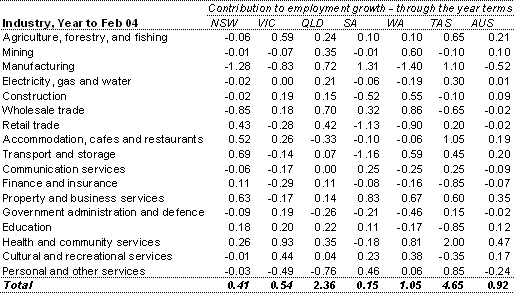 Source: Australian Bureau of Statistics cat.no.6291.0.55.001.
Appendix 2: Decomposing employment growth—
a shift share analysis
Using an adapted shift share formula we found that 73.5 per cent of the increase in part-time employment in the past 20 years was due to the overall change in the proportion of part-time employment to total, and 23.6 per cent of the change was due to changes in industry composition (Table 2).
Table 2: Shift share analysis part-time employment growth 1984-2004
In the shift share equation the first effect (behavioural effect) describes the overall change in the proportion of part-time employment to total employment. The second (composition effect) describes the change in the aggregate ratio due to changes in the relative size of industries. The third or interaction effect is a residual, which represents the interaction of the first and second effects. Typically the interaction effect is quite small.
The growth in part-time employment across industries explains the majority of the pick up in overall part-time employment growth. However, changing industry composition in the economy, with industries having a higher concentration of part-time workers growing faster than others, also explains some of the growth in part-time employment (Table 2).
Shift share equation
Appendix 3: Assumptions underpinning population projections
Background
The Australian Bureau of Statistics has produced three series of population projections. The following paragraphs briefly describe the assumptions behind these projections. The three scenarios are broadly described as:
 |
Series A—High Fertility, High Migration and High Life Expectancy; |
 |
Series B—Medium Fertility, Medium Migration and Medium Life Expectancy; and |
 |
Series C—Low Fertility, Low Migration and Medium Life Expectancy. |
Summary of assumptions
Fertility
For the fertility component, assumptions are made on future to
tal fertility rates (TFRs), age-specific fertility rates, and for the sex ratio at birth. These assumptions are formulated on the basis of past demographic trends, both in Australia and overseas. The three assumptions for Australia’s future levels of fertility are:
 |
The TFR will reach 1.8 babies per woman in 2011, and then remain constant thereafter (high assumption); |
 |
The TFR will decline to 1.6 babies per woman by 2011, and then remain constant (medium assumption); and |
 |
The TFR will decline to 1.4 babies per woman by 2011, and then remain constant (low assumption). |
Mortality
For the mortality component, assumptions are made for future levels of life expectancy at birth for males and females. There are two long-term mortality assumptions; both have life expectancy at birth increasing from the 1999-2001 level of 77.0 years for males and 82.4 years for females to:
 |
84.2 years for males and 87.7 years for females in 2050-51 (Medium assumption). Under this assumption, life expectancy at birth will increase by 0.30 years for males and 0.25 years for females per year until 2005-06, following which improvement will gradually decline until 2050-51. |
 |
92.2 years for males and 95.0 years for females in 2050-51 (high assumption). Under this assumption the assumed rate of mortality improvement (0.30 years for males and 0.25 years for females per year) will continue through to 2050-51. |
Under both assumptions the pattern of change in age-sex specific death rates derived from 1991-2001 data has been assumed to continue until 2050-51. The pattern of the assumed rate of change in age-specific death rates is scaled to conform to the predetermined life expectancies at birth for future years.
Overseas migration
Overseas arrivals on a yearly basis are determined by the Migration and Humanitarian Programs announced by the Australian Government, together with the movement of New Zealand citizens and other long-term migrants who do not come under the Migration Program. Net overseas migration levels (NOM) take into account overseas arrivals and overseas departures on a permanent or a long-term basis. The three assumptions that are made:
 |
Annual NOM gain will be 125,000 by 2005-06 (high assumption); |
 |
Annual NOM gain will be 100,000 by 2005-06 (medium assumption); and |
 |
Annual NOM gain will be 70,000 by 2005-06 (low assumption). |
1 Domestic Economy Division, Australian Government Treasury. This article has benefited from helpful comments from Steven Kennedy, Martin Parkinson, David Gruen, JasonAllford, JimHagan, Yeon Kim and Dehne Taylor. The views in the article are those of the authors and are not necessarily those of the Australian Treasury.
2 This is explored further in The impact of the 2002-03 drought on the economy and agricultural employment, Economic Roundup Autumn 2004.
3 This brief examination excludes outcomes for Australia’s Territories, which account for a relatively small proportion of the overall labour market.
4 The substantially higher population growth in Queensland compared with the national average continues to be primarily driven by net interstate migration. Queensland Budget papers: http://www.budget.qld.gov.au/pdfdocs/strategy.pdf, p. 24.
5 Generally defined as ages 15-64 for the purposes of this article.
6 Full-time employment is defined by the Australian Bureau of Statistics as persons working for 35 hours perweek and over, while part-time employment includes those working up to 35 hours per week.
7 Gender participation trends are discussed in more detail in, Educational attainment and labour force participation in Australia, Economic Roundup Winter 2003.
8 Gross flows data available from Labour Force, Australia, Australian Bureau of Statistics cat.no. 6203.0. Calculations based on average proportions of people not in the labour force or unemployed that shift to part-time employment rather than full-time employment.
9 Estimates of part-time workers who want more hours are available from Australian Bureau of Statistics cat. no. 6203.0. and 6105.0. Annual estimates of the average number of extra hours wanted are available in Australian Bureau of Statistics cat. no. 6265.0.
10 Full-time equivalence assumes the standard ABS definition of full-time employment, being 35hours work (or more) in a week. This could also be calculated using the average full-time hours worked figure of around 41 hours per week in 2003. Part-time equivalence assumes the average part-time hours worked, of around 16 hours per week in 2003.
11 Author derived, based on data from Labour Force, Australia, Australian Bureau of Statistics cat. no. 6105.0., 6203.0 and 6265.0.
12 The assumptions underpinning these scenarios are detailed in Appendix 3. These Appendix notes are paraphrased from those contained in Population Projections 2002 to 2101 (Australian Bureau of Statistics cat. no. 3222.0). For the full and original text, consult the source.
13 Generally defined as ages 15-64 for the purposes of this article.
14 Persons Not In The Labour Force, Australia, ABS cat. no. 6220.0 (September 2003). This Australian Bureau of Statistics publication presents information about persons aged 15 to 69 who are not in the labour force. This will not precisely align with estimates of typical workforce age (generally defined as ages 15 to 64) elsewhere in this article.
15 The Australian Bureau of Statistics defines marginal attachment as persons not in the labour force, but either: wanting to work and are actively looking for work but are not available to start work in the reference week; or wanting to work and are not actively looking for work but are available to start work within four weeks. ABS cat. no. 6
220.0.
16 Gross flows data available from Labour Force, Australia, Australian Bureau of Statistics cat.no. 6203.0. Calculations based on average proportions of people not in the labour force that shift to part-time employment rather than full-time employment.
