Lan Lu and David Hedley1
This article seeks to document some of the economic effects of the 2002-03drought, presenting a summary of the major macro-economic impacts before discussing the effect on agricultural employment in light of longer term trends. The article then examines the agricultural outlook and prospects for recovery from drought.
While agriculture accounts for a relatively small proportion of the aggregate economy, the drought had a significant impact. The drought has led to a decline in agricultural employment to an unprecedented low. While the grain sector has recovered with a record winter crop in 2003-04 a full recovery from the drought is still some way off as serious rainfall deficiencies persist in some areas and have re-emerged in others.
Introduction
Over much of 2002-03, drought affected significant areas of rural Australia. About 90percent of New South Wales, 65percent of Queensland and 48 of 59 municipalities in Victoria had been officially drought declared by August 2003. Below average seasonal conditions were also affecting parts of South Australia, Tasmania Western Australia and the Northern Territory.
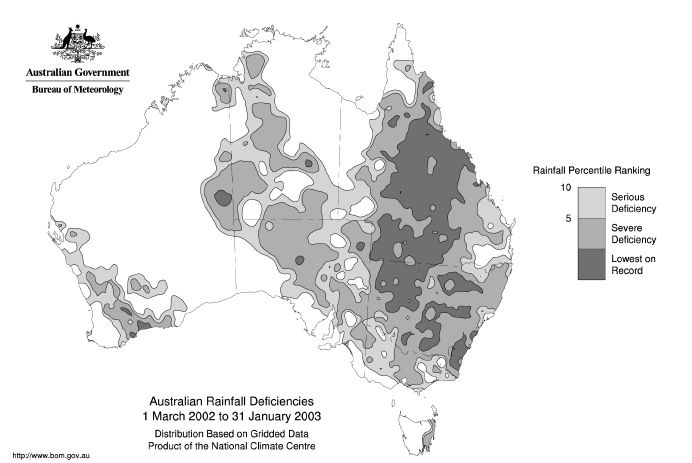
Rainfall deficiencies were widespread with 56.1percent of Australia seriously or severely rainfall deficient for the 11 months from March 2002 to January 2003 (Map1).
Map 1: Areas effected by drought
Source: Bureau of Meteorology.
Clearly, the severity and extent of this drought had significant social implications for rural communities. This impact was partly ameliorated by real farm incomes reaching their highest level since the 1980s prior to the drought.2 Nevertheless, the scale of this drought led to significant economic disruption and individual hardship.
The drought has had a significant contractionary impact on the economy, far greater than the relative size of the farm sector might suggest. To summarise the economic effects of the drought, farm gross domestic product fell by 24.3percent through the year to the June quarter 2003, rural exports fell by 26.6percent, and agricultural income fell by 46.2percent. The drought is estimated to have directly reduced agricultural employment by about 100,000 people.3 Drought related reductions in production have also contributed to increases in food prices since mid2002.
The economic performance of rural and regional Australia has improved significantly during the course of 2003-04, largely reflecting much improved grain production. However, livestock enterprises affected by the drought will take some time to recover, and very dry conditions have returned to many parts of Southern Australia in recent months. Livestock prices remain high, particularly for quality breeding stock. As a result cattle numbers are projected by the Australian Bureau of Agricultural and Resource Economics (ABARE) to take several years to recover from the drought. Furthermore, depleted water storages in many areas has led to a reduction in planting of irrigated summer crops and also severely affected dairying relying on irrigated pasture.4 Horticultural production was also affected by drought.
The initial recovery from the drought during 2003-04 has been reflected in an overall improvement in grain production. Following the aftermath of the drought, farmers turned to cropping where possible in an attempt to improve farm incomes, leading to a record winter cropping area being planted. Winter crop production has been the primary contributor to growth in agricultural output in 2003-04. However, assuming normal seasonal conditions, ABARE predicts modest growth in farm production for 2004-05, reflecting a moderation in winter crop production while the recovery in the livestock and irrigated sectors will take some time.
The article first discusses the overall impact of the drought on the Australian economy, including the impact on farm GDP, farm income, rural exports, agricultural employment and the Consumer Price Index (CPI) measure of food prices. The second section illustrates the impact of drought on agricultural employment. In the third section, the article illustrates some other longer-term trends in agricultural employment and the sector more generally. The final section of the article discusses the outlook for the agricultural sector.
Broad economic impact of the drought on the Australian economy
Whilst the farm sector accounts for only around 3percent of the economy and around 4percent of aggregate employment, the drought subtracted almost 1percent from Australia’s GDP growth in 2002-03. The total impact of the drought on agricultural employment is estimated to have subtracted around 1percentage point from employment growth. The overall effects are likely to have been significantly larger once account is taken of broader downstream effects.
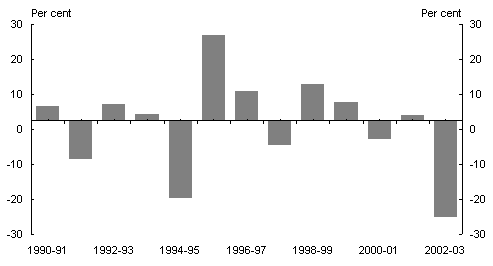
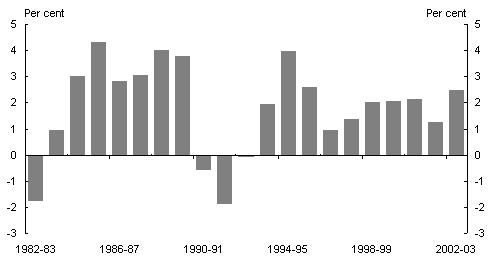
During the course of 2002-03, the drought had a dramatic effect on most aspects of agricultural activity. In 2002-03, farm Gross Domestic Product fell by 24.8percent, directly subtracting 0.9 of a percentage point from overall GDP growth (Chart 1). This was a larger decline than recorded during the last major drought in 1994-95,when farm production fell by around 20percent.
Chart 1: Farm Gross Domestic Product
(Year average, growth — chain volume measure)
Source: Australian Bureau of Statistics, National Income Expenditure and Product, Australia, cat.no5206.0, Canberra, 2003.
Farm production as a proportion of total production has been declining over time as the Australian economy has grown and diversified. That is, production in the farm sector has grown at a relatively slower rate than the average rate of the rest of the economy. This is not surprising considering the rapid growth in services industries. A similar story to that of farm production is found in the mining sector.
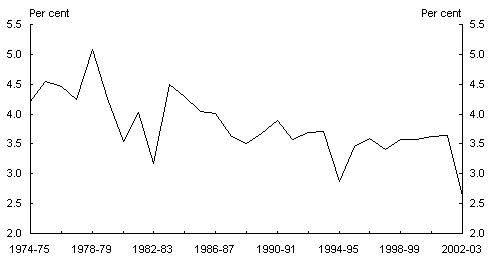
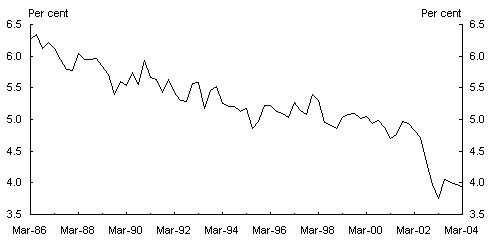
Whilst the farm sector has on average accounted for around 3percent of Australian production; it has contributed around one-fifth of total exports on average. Agriculture’s share of GDP declined from around 3percent in 2001-02 to around 2percentin 2002-03-an historical low (Chart2).
Chart 2: Agriculture share of total production
(Annual, chain volume measure, gross value added)
Source: Australian Bureau of Statistics, National Income Expenditure and Product, Australia, cat.no.5206.0, Canberra, 2003.
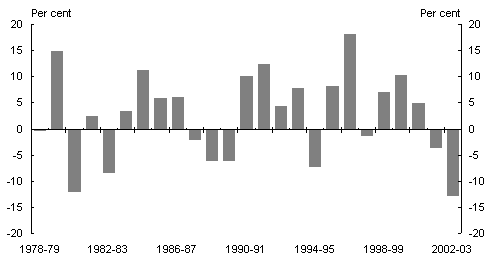
As a res
ult of the drought, rural exports declined by around 13percent in 2002-03. This is the largest decline in rural exports in the history of the series, which began in 1975-76 (Chart 3), and subtracted around 2 percentage points from total export growth in 2002-03.
The fall in grains exports contributed the largest amount to the decline in total rural exports. Grains exports fell by around 32percent in 2002-03. Exports of wool and sheepskins declined by around 20percent in 2002-03. Exports of meat products remained stable, growing by 1percent over the same period, consistent with increased slaughtering and the rundown in herd numbers associated with drought.
Chart 3: Rural exports growth
(Annual, chain volume measure)
Source: Australian Bureau of Statistics, Balance of Payments and International Investment Position, Australia, cat. no 5302.0, Canberra, 2003.
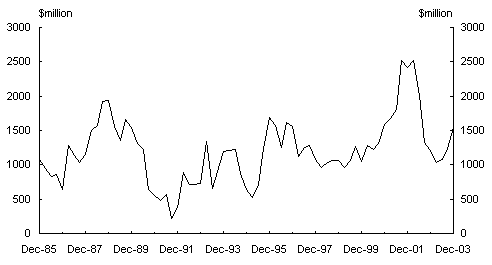
Real farm income, which takes into account changes in production, farm prices and farm costs, fell by 51percent in 2002-03 (Chart 4). Thedrought and an appreciation in the Australian dollar over the course of the year contributed significantly to the decline.
Chart 4: Real agricultural income
(Quarterly)
Source: Australian Bureau of Statistics, National Income Expenditure and Product, Australia, cat.no.5206.0, Canberra, 2003. Australian Bureau of Statistics, Consumer Price Index, Australia, cat.no.6401.0, Canberra, 2003.
Real farm incomes, however, grew by 16percent in 1999-2000, 32percent in 2000-01 and 49percent in 2001-02. As a result, the farm sector, in aggregate, entered the 2002-03 drought in better financial shape had income growth in the preceding years been more moderate. That said not all regions experienced average seasonal conditions in these years. While the aggregate financial position was strong prior to 2002-03, conditions differed markedly between regions.
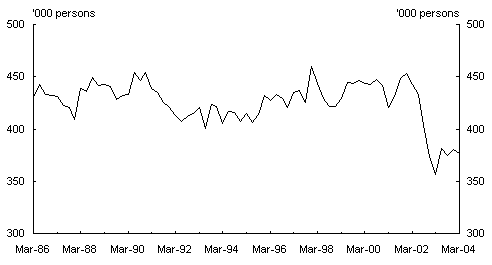
The impact on agricultural employment was large enough to affect economy wide employment growth. It is estimated that around 100,000 jobs were lost in agricultural employment as a direct result of the drought, meaning that around 1 in 4 jobs were lost in the agricultural sector (Chart 5). The employment effect has been larger than that of any drought since reliable statistics became available in the 1960s.
Chart 5: Agriculture, forestry and fishing employment
(Quarterly, seasonally adjusted)
Source: Australian Bureau of Statistics, Labour Force, Australia, Detailed, cat.no.6291.0.55.001, Canberra,2004.
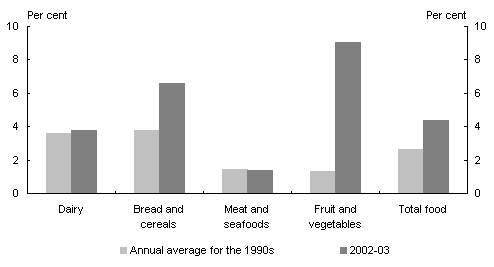
An important impact of the drought felt outside of rural Australia was the effect on food prices, which increased on average by 4.4percent over 2002-03 compared with a general increase in the Consumer Price Index of 2.7percent (Chart 6).
Drought related shortages contributed to increases in food prices from mid 2002; food prices accounted for 18.3percent of the Consumer Price Index in the December quarter 2003. The prices of bread and cereal products increased by 6.6percent in the year to the June quarter 2003, compared with a general increase in the Consumer Price Index of 2.7percent. Over the same period, fruit and vegetable prices increased by 9.1percent, egg prices by 11.7percent and dairy products by 3.8percent. The prices of some other basic food products, such as honey, also increased significantly over this period. Meat prices typically fall in the early stages of a drought, as animal slaughtering increases, and then rise later as supply shortages become evident. Consistent with this pattern, meat prices did not increase significantly as a result of the drought until mid to late 2003.
Chart 6: Year-ended growth in selected food sub-groups
Source: Australian Bureau of Statistics, Consumer Price Index, Australia, cat. no. 6401.0, Canberra, 2003.
The impact of drought on agricultural employment
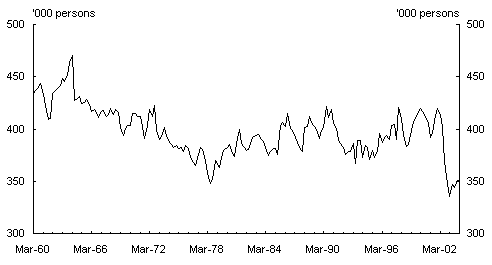
Using a longer series of farm employment clearly shows the severity of the employment shock caused by the 2002-03 drought (Chart 7).5 The size of the decline in farm employment reflects that the drought was spread broadly across the states covering many employment intensive agricultural regions and that the impact of the 2002-03 drought covered both cropping and livestock regions, which are the largest employers in the agricultural industry.
Following the drought in the early 1990s farm employment had been increasing until the December quarter 2001. Normally a delay would be expected between the deterioration in seasonal conditions and declines in employment. However, farm employment declined almost concurrently with farm production, until reaching a trough in the March quarter of 2003.
Chart 7: Farm employment
(Quarterly, seasonally adjusted)
Source: Australian Bureau of Statistics, Treasury special request files, Canberra, 2004.
The trough in agricultural employment in March 2003 has been followed by a very modest pick-up in employment in the agriculture sector to March 2004, indicating that a recovery in employment is now tentatively underway. Employment in the agriculture sector is expected to recover moderately in 2003-04 and should continue in 2004-05 assuming a return to average seasonal conditions. However, until the livestock sector recovers more substantially from the drought, agricultural employment is expected to remain below pre-drough
t levels.
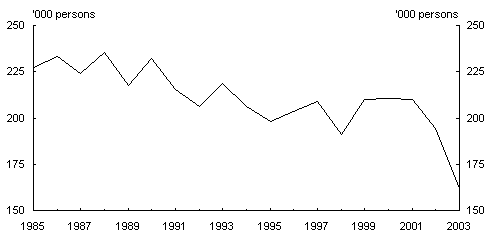
The grain, sheep and beef cattle farming industries accounted for the majority of the decline in agricultural employment (Chart 8). The grain, sheep and beef cattle industries are the largest employers in the sector and shed around 73,000 or around one third of employees from their collective employment. This accounted for 73percent of the overall decline in agricultural employment.
Chart 8: Grain, sheep and beef farming employed persons6
(Yearly average)
Source: Australian Bureau of Statistics, Labour Force, Australia, Detailed, cat.no.6291.0.55.001, Canberra,2003.
Although employment in the agriculture sector declined significantly during the drought, total employment in Australia increased by around 225,000 or 2.5percent in 2002-03 (Chart 9). Whilst the drought had a devastating impact on agricultural employment, the strength of the broader domestic economy saw above trend growth in total employment. In other words, at an aggregate level, employment declines related to the drought were offset by the strong growth in other sectors. In particular, construction employment remained at high levels while employment in retail trade and property and business services grew solidly.
Chart 9: Total employment across all industries
(Annual, growth)
Source: Australian Bureau of Statistics, Labour Force, Australia, cat. no. 6202.0, Canberra, 2004.
Broader trends in agriculture and agricultural employment
Agriculture’s share of total employment has trended downward over time; reflecting the overall trend for Australian industry employment to be largely driven by employment growth in services (Chart 10). This downward trend in the share of agriculture as a proportion of total employment is also reflected by agriculture’s declining share of overall production in the Australian economy (Chart2).
In absolute terms, however, employment was increasing on average until the December quarter 2001 even though the share was declining.
Chart 10: Agriculture share of total employment
(Quarterly)
Source: Australian Bureau of Statistics, Labour Force, Australia, Detailed, cat.no.6291.0.55.001, Canberra,2004.
Typically, strong labour productivity growth has meant that agriculture’s share of overall employment has fallen faster than the sector’s share of overall production since the mid-1980s (when this data series begins).
Farm productivity growth reflects a mix of growth in productivity, capital intensity and improved productivity in land resource use. Solid growth in farm productivity has allowed production to increase at a faster rate than employment.7 In the farm sector between 1985 and 2003 industry gross value added has increased by 27percent, while part-time employment has increased by 16 percentage points and average hours workedper head has declined by 4hours. This combination of factors implies sharply higher farm productivity. For example, productivity gains have driven the substantial increases in grains production in Australia over the past three decades.8
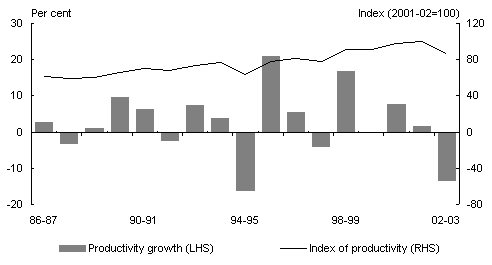
Productivity growth in agriculture has outpaced productivity growth in the broader economy on an hour’s basis (Chart 11). Average productivity growth for the economy on an hours basis is around 2percent, while average productivity in the agricultural sector is around 3percent.
It can be seen that productivity growth, like other agricultural variables, is affected by the seasonal pattern that defines farm production. The decline in productivity growth caused by the drought in 2002-03 was very similar to that in 1994-95. We expect 2003-04 to show a recovery in productivity growth similar to that in 1995-96 (Chart 11).
Chart 11: Productivity in agriculture
(Gross product per hour worked, annual growth)
Source: Australian Bureau of Statistics, National Income Expenditure and Product, Australia, cat.no.5206.0, Canberra, 2003.
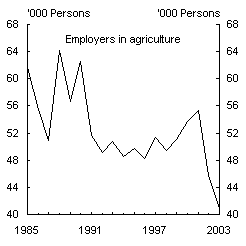
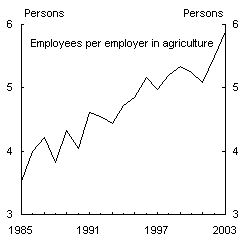
The number of employers increased leading up to the drought peaking in 2001, before declining to the lowest level recorded by the end of 2003 (Chart 12).9
In the mid 1990s, the average number of employers on an annual basis remained reasonably stable. However, the average number of employers over the 1990s was lower and less volatile than in the late 1980s. This suggests that a structural change may have occurred in the early 1990s, which was only partially offset towards the end of the decade. Increases in employer numbers between 1999 and 2001 reflected generally favourable conditions in the sector when farm incomes and commodity prices rose significantly. The drought subsequently reduced the number of employers by almost 15,000, to the lowest level recorded in the series in 2003. Falling numbers of employers in the sector also suggests a more general consolidation is occurring over time.
Chart 12: Employers and average employees in the agricultural sector
|
|
Source: Australian Bureau of Statistics, Labour Force, Australia, Detailed, cat.no.6291.0.55.001, Canberra,2003.
Employment trends in the agricultural sector and the impact of drought are also reflected in the average number of employees (Chart12).10
Consistent with consolidation in the agriculture sector, the average number of employees per agribusinesses enterprise has trended upward over time. Interestingly, the drought did not lead to a reduction in the average number of employees—this suggests that the rate of decline in the number of employers due to the drought has exceeded the rate of decline in the number of employees. Alternatively, it may suggest that the decline in employment (and employers) may have been concentrated in a decline in the number of smaller employers (that is, employers with a below-average number of employees).
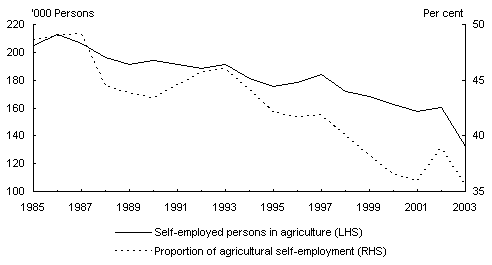
The number of self-employed persons in the agricultural sector is in longer-term decline, falling from over 200,000 persons in 1985 to around 130,000 persons in 2003. Interestingly, the number of self-employed persons in the agriculture sector grew by 3,000 persons in 2002, leading up to the drought—this may have reflected downsizing of very small agribusinesses (for example, 2 or 3 persons) to the ‘owner-level’; that is, carrying no staff and therefore shifting from ‘employer’ status to the pool of self-employed. Similarly, there was an increase in the proportion of self-employed persons in the industry in 2002 (Chart 13).
The proportion of self-employed persons rose in 2002 reflecting that the number of self-employed persons increased whilst total agricultural employment declined sharply (Chart 13). In 2003, the declining proportion of self-employment in agriculture continued. Over the history of the series the proportion of self-employment has declined from around half to around a third of the work force. This suggests that consolidation in the industry has been ongoing from the mid 1980s.11
Chart 13: Self-employed persons and proportion of
self employed in agriculture
Source: Australian Bureau of Statistics, Labour Force, Australia, Detailed, cat.no.6291.0.55.001, Canberra,2003.
Outlook for the agricultural sector12
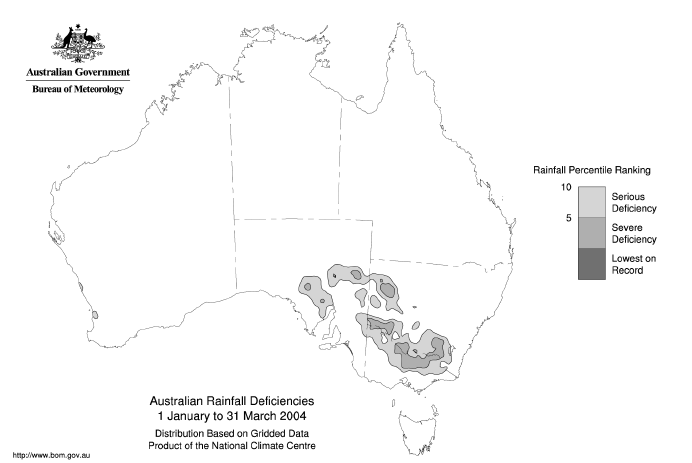
The Bureau of Meteorology has announced that heavy monsoon rain during March removed or significantly eased long-term rainfall deficiencies along the Queensland coast north of Ingam; nevertheless, serious and severe, rainfall deficiencies remain further south along the Queensland coast, through inland eastern Australia, in the southeast of the mainland and in northwest Western Australia (Map 2).13
Map 2: Areas suffering continuing rainfall deficiencies14
Source: Bureau of Meteorology.
In the March quarter publication of Australian Commodities Outlook 2004, ABARE published information on the impact of the 2002-03 drought and how it has differed from previous droughts in 1982-83 and the early 1990s.15 ABARE suggests that much of the difference is related to changes in resource use; agricultural enterprises have moved towards using more arable land for cropping rather than livestock or wool production due to the greater profitability of cropping. As a result much of the impact from the recent drought has occurred through a severe decline in grain production, in contrast to the 1982-83 drought when the majority of the decline in production occurred through the impact on the cattle numbers.
In this vein, the recovery from the drought is also expected to be different. In 1982-83 when the cattle and livestock industries accounted for a larger percentage of total production, farmers were able to switch a relatively larger proportion of resources into crop production due to low livestock numbers — or ‘the cash crop effect’. Essentially, farmers take advantage of seasonal conditions to improve income through cropping while livestock numbers are low. Leading up to the most recent drought, the greater profitability of cropping over time has resulted in less land being available to switch into cropping from livestock.
Australia is expected to record a record grains harvest in 2003-04, estimated at 41.7million tones. As a result farm incomes, especially in the grains sector, are expected to have partially recovered in 2003-04. However, the livestock industries will take a longer timeframe to recover, restocking prices remain at high levels and there are few signs of herd rebuilding at present; a full recovery is expected to roll into 2006-07. In addition, very dry conditions have returned to many parts of southern Australia in recent months and the irrigation sector is suffering from low levels of water storage that will continue to affect production.
The winter crop is expected to be slightly lower in 2004-05, as the area sown to grains is expected to decline. Farm incomes are forecast to decline in 2004-05, largely reflecting lower prices. Assuming a return to average seasonal conditions in 2004-05 ABARE expects total farm production to increase; however, aggregate prices received by farmers are expected to fall.
As indicated by the Australian Bureau of Statistics in the December 2003 National Accounts released on 3 March 2004, Gross Agricultural Product at market prices is expected to increase in chain volume terms by 21.4percent in 2003-04. This is expected to make a positive contribution of 0.6 percentage points to GDP growth in 2003-04.
The outlook for a recovery in farm employment is inextricably linked to the pattern of seasonal conditions over the next 2-3 years. Assuming a return to average seasonal conditions an orderly recovery in farm employment is anticipated. Nevertheless, employment is expected to take some years to recover to pre-drought levels.
Conclusion
The 2002 drought had a significant impact on the Australian economy. The farm sector subtracted around 1 percentage point from GDP growth and around of a percentage point from employment growth in 2002-03. These macro-economic effects are very large in comparison with the size of the farm sector — typically around 3percent ofGDP.
The drought led to the largest declines in employment on record in the agricultural sector. The negative impact of the drought cost the sector around 100,000 jobs, with almost three-quarters of job losses in the grain, sheep and beef cattle farming industries. The size of the decline in employment,
in comparison to other droughts, reflects the widespread nature of the drought across the States.
In aggregate, real farm income growth was relatively strong leading up to the drought. Nevertheless, the sheer scale of the drought would have affected all farmers to some degree, particularity those who had experienced below average rainfall in the period leading up to the beginning of the drought.
An expected record winter grain harvest in 2003-04 will improve farm incomes, but a recovery in livestock is expected to take a number of years, and is currently hampered by the high cost of restocking. Furthermore, depleted water storages in many areas has led to a reduction in planting of irrigated summer crops and irrigated pasture for dairying was also severely affected. The horticultural industry also suffered from the drought.
The outlook for the farm sector has picked up but will require close monitoring as very dry conditions have returned to many parts of southern Australia in recent months. Assuming average seasonal conditions, agricultural employment is expected to recover modestly in 2003-04 and 2004-05 but will remain below pre-drought levels until the livestock and irrigated sectors recover. Variations in seasonal conditions and global markets over the period ahead will determine the prospects for any recovery.
References
Australian Bureau of Statistics, cat. no. 5206.0, National Income Expenditure and Product, Australia, 2003.
Australian Bureau of Statistics, cat. no. 6202.0, Labour Force, Australia, 2004.
Australian Bureau of Statistics, cat. no. 6291.0.55.001, Labour Force, Australia, Detailed - Electronic Delivery, 2004.
Australian Bureau of Statistics, cat. no. 5302.0, Balance of Payments and International Investment Position, Australia, 2003.
Australian Bureau of Statistics, cat. no. 6401.0, Consumer Price Index, Australia, 2003.
Australian Bureau of Statistics, Treasury special request files, Australia, 2004.
Australian Bureau of Statistics, cat. no. 2055.0 — The Micro Dynamics of Change in Australian Agriculture: 1976 — 2001.
Australian Bureau of Agricultural and Resource Economics, Australian commodities outlook 2004, vol. 10, no. 3, September quarter 2003.
Australian Bureau of Agricultural and Resource Economics, Australian commodities outlook, vol.11, no. 1, pg 155- 171, March quarter 2004.
Australian Bureau of Agricultural and Resource Economics, Australian Grains 04.1: Grains Industry Performance & Outlook.
1 Domestic Economy Division, Australian Government Treasury. The authors would like to thank JasonRusso for some of the initial ideas for this article. This article has also benefited from helpful comments from Martin Parkinson, Paul O’Mara, Jim Hagan and Jason Allford. The views in the article are those of the authors and are not necessarily those of the Australian Treasury.
2 Real farm incomes have been calculated using headline Agricultural income from the national accounts, deflated by the Consumer Price Index.
3 This estimate uses the headline ABS industry employment category for agriculture - Agriculture forestry and fishing: This data has been adjusted for a structural break using the methodology supplied by the ABS. The period used to estimate the total employment effect of the drought on agricultural employment is from the December quarter 2001 to the March quarter 2003; this period incorporates the trough associated with the drought and the peak prior to the drought.
4 For a more detailed description of the impact of the drought on specific sectors see the Australian Bureau of Agricultural and Resource Economics, Australian Commodities Outlook2004, vol. 11, no. 1, March quarter 2004.
5 Farm employment is defined as Agricultural forestry and fishing employment (published by the ABS) less the forestry and fishing components. These data suggest that the drought subtracted around 85,000 jobs from farm employment. This indicates that around 15,000 jobs were lost in forestry and fishing industries over the same period. However, the farm employment decline still reflects the largest impact of any drought since the early 1960s.
6 This data can be subject to large standard errors, and should be considered as indicative of broad trends rather than exact point estimates.
7 For the purposes of this article farm productivity is measured a Gross product per hour worked.
8 Australian Bureau of Agricultural and Resource Economics, Australian Grains 04.1: Grains Industry Performance & Outlook.
9 This data only includes persons employing other workers, that is, excluding the pool of self-employed.
10 For the purposes of this article, the average number of employees is measured as the ratio of employees to employers, abstracting from the pool of self-employed.
11 For more detailed information on change in Australian agriculture refer to the Australian Bureau of Statistics publication no. 2055.0 — The Micro Dynamics of Change in Australian Agriculture: 1976 — 2001.
12 The outlook section of this article relies on the information supplied in Australian Bureau of Agricultural and Resource Economics, Australian commodities outlook 2004, vol. 11, no. 1, March quarter 2004.
13 Statement on Drought for the 21- month period ending 31 March 2004. Issued 5 April 2004 by the National Climate Centre.
14 Bureau of Meteorology Statement on Drought for the 3-Months 1 January to 31 March 2004.
15 Australian Bureau of Agricultural and Resource Economics, Australian Commodities Outlook 2004, vol. 11, no. 1, March quarter 2004.
