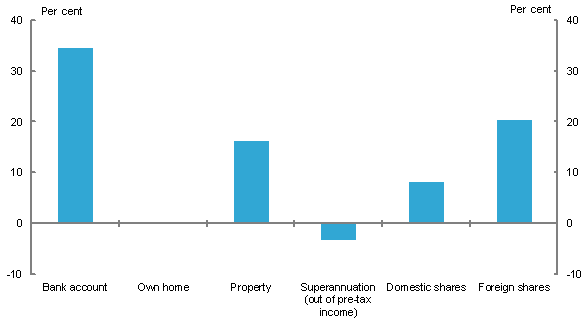
Chart 4.1 Nominal effective marginal tax rates by savings vehicles for an individual on 32.5 per cent marginal tax rate (plus 2 per cent Medicare levy)
 Assumptions: 6 per cent nominal return (except shares, which assumes 6 per cent after company tax); assets are all held for 25 years, and for rental property, 50 per cent of the return is attributable to capital gain and 50 per cent to rental income and superannuation contributions do not exceed the prescribed contribution caps. No assets have been negatively geared. The own home has a nominal effective marginal tax rate of zero, as it is purchased out of after-tax income, but subsequent returns on it are not taxed. Bank accounts, property and shares also use after-tax income but their returns are taxed depending on the vehicle. The nominal effective marginal tax rate for superannuation is negative because contributions to superannuation are made pre-tax and are only taxed at 15 per cent. For example, $100 of pre-tax labour income would result in a super contribution of $85 (after 15 per cent tax) but an individual would only receive $65.50 if they put it into other saving vehicles because of the application of their marginal tax rate (34.5 per cent in this case).
This chart shows the effective tax rate on savings held in different vehicles for an individual on a 34.5 per cent personal marginal tax rate (including the Medicare Levy). It shows that for this individual, savings held in a bank account face higher effective tax rates than savings held in domestic shares, investment property or foreign shares. Returns to savings in the family home are tax exempt. The chart also shows that superannuation faces a negative tax rate. This is because the initial contribution is made out of pre-tax income which is then taxed at the superannuation fund rate of 15 per cent rather than being sourced from income that has been subject to the individual’s higher marginal tax rate.
| Bank account % |
Own home % |
Property % |
Superannuation (out of pre-tax income) % |
Domestic shares % |
Foreign shares % |
|
|---|---|---|---|---|---|---|
| Nominal effective marginal tax rate | 34.5 | 0.0 | 16.1 | -3.4 | 8.1 | 20.4 |
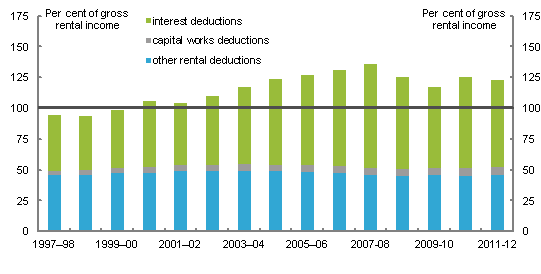
Chart 4.2 Expenses claimed for investment properties over time, as a percentage of gross rental income

Source: ATO 2014, Taxation Statistics 2011-12, ATO, Canberra
This chart shows the expenses claimed for rental properties over time from 1997-98 to 2011-12, including interest, capital works and other rental deductions. The chart shows the deductions as a percentage of gross rental income. From 1997-98 to 1999-2000, the amount of gross rental income exceeded the expenses claimed. From 2000-01 onwards, expenses claimed have exceeded the amount of gross rental income, mainly due to an increase in interest deductions.
| Series | Unit | 1997–98 | 1998–99 | 1999–00 | 2000–01 | 2001–02 | 2002–03 | 2003–04 |
|---|---|---|---|---|---|---|---|---|
| Interest deductions | Per cent of gross rental income | 45.6 | 44.0 | 47.2 | 53.7 | 50.5 | 55.5 | 63.0 |
| Capital works deductions | Per cent of gross rental income | 3.1 | 3.6 | 4.0 | 4.3 | 4.6 | 4.9 | 5.2 |
| Other rental deductions | Per cent of gross rental income | 45.9 | 46.3 | 47.6 | 48.0 | 49.2 | 49.5 | 49.5 |
| Total | Per cent of gross rental income | 94.6 | 93.9 | 98.7 | 106.0 | 104.3 | 109.8 | 117.7 |
| Series | Unit | 2004–05 | 2005–06 | 2006-07 | 2007-08 | 2008-09 | 2009-10 | 2010-11 | 2011-12 |
|---|---|---|---|---|---|---|---|---|---|
| Interest deductions | Per cent of gross rental income | 69.2 | 72.7 | 77.7 | 84.2 | 74.8 | 65.9 | 74.0 | 71.1 |
| Capital works deductions | Per cent of gross rental income | 5.5 | 5.7 | 5.9 | 5.8 | 5.8 | 6.1 | 6.3 | 6.4 |
| Other rental deductions | Per cent of gross rental income | 49.0 | 48.5 | 47.5 | 46.1 | 44.8 | 45.6 | 45.5 | 45.7 |
| Total | Per cent of gross rental income | 123.6 | 126.9 | 131.0 | 136.2 | 125.4 | 117.6 | 125.9 | 123.2 |
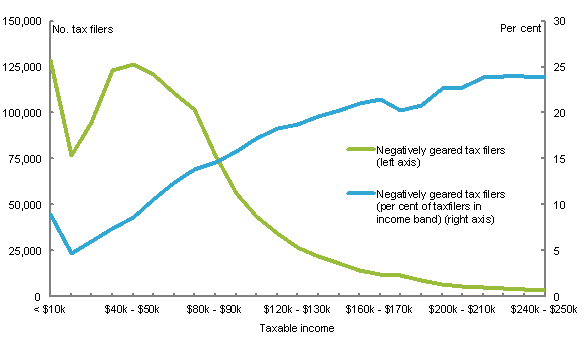
Chart 4.3 Proportion of tax filers with negatively geared investment properties, split according to taxable income, 2011-12
 Source: Treasury calculations using administrative data from 2011-12 tax returns for individuals
This chart shows the proportion of tax filers with negatively geared investment properties, split according to taxable income in 2011-12. It shows that as taxable income increases, the proportion of tax filers with negatively geared investment properties also increases. This chart also shows how the number of negatively geared tax filers varies with income, with around half having a taxable income between $40,000 and $90,000. Taken together, these two lines on the chart highlight the fact that although the majority of negatively geared tax filers are in the lower income bands, tax filers in the higher bands are more likely to take advantage of negative gearing strategies.
| Taxable income 2011-12 | Negatively geared tax filers | % of tax filers in income band that are negatively geared |
|---|---|---|
| < $10,000 | 128345 | 8.89 |
| $10,000 - $20,000 | 76562 | 4.65 |
| $20,000 - $30,000 | 94943 | 5.94 |
| $30,000 - $40,000 | 123346 | 7.41 |
| $40,000 - $50,000 | 126231 | 8.61 |
| $50,000 - $60,000 | 120997 | 10.54 |
| $60,000 - $70,000 | 110865 | 12.37 |
| $70,000 - $80,000 | 101716 | 13.86 |
| $80,000 - $90,000 | 76690 | 14.56 |
| $90,000 - $100,000 | 56144 | 15.82 |
| $100,000 - $110,000 | 43339 | 17.18 |
| $110,000 - $120,000 | 34294 | 18.34 |
| $120,000 - $130,000 | 26802 | 18.71 |
| $130,000 - $140,000 | 21701 | 19.63 |
| $140,000 - $150,000 | 17647 | 20.24 |
| $150,000 - $160,000 | 14305 | 21.07 |
| $160,000 - $170,000 | 11742 | 21.47 |
| $170,000 - $180,000 | 11225 | 20.30 |
| $180,000 - $190,000 | 8456 | 20.84 |
| $190,000 - $200,000 | 6669 | 22.71 |
| $200,000 - $210,000 | 5462 | 22.81 |
| $210,000 - $220,000 | 4715 | 23.86 |
| $220,000 - $230,000 | 4039 | 24.03 |
| $230,000 - $240,000 | 3474 | 23.95 |
| $240,000 - $250,000 | 2986 | 23.86 |