Chart 8.1 VAT rates in OECD, July 2014 and selected Asian countries, January 2015
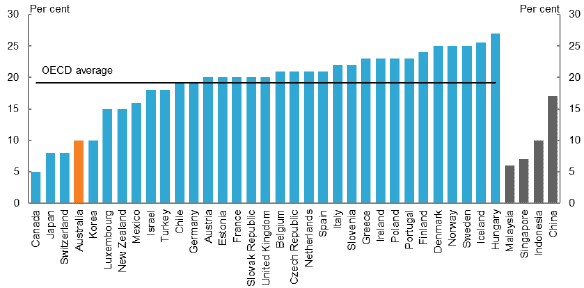
Note: The VAT rate for Japan has been adjusted to account for the increase in the rate from 1 April 2014. The rate for Malaysia reflects the GST scheduled to replace separate sales and service taxes in April 2015. The US and Hong Kong are not included in the list of countries in this chart as they do not have a VAT. India is not included in the chart due to extensive variation in consumption tax rates.
Source: OECD 2014, Consumption Tax Trends 2014, OECD, Paris; Deloitte 2015, Global Indirect Tax Rates, viewed 22 January 2015.
This chart illustrates the different VAT/GST tax rates, as at 1 July 2014, for each of the 32 OECD countries that have a VAT or GST. Four Asian countries (Malaysia, Singapore, Indonesia and China) that have a VAT or GST are also included in this chart. Australia's tax rate is the fourth lowest of the 32 OECD countries which have a VAT or GST and is around half the unweighted OECD average rate of 19.2 per cent. Hungary has the highest tax rate at 27 per cent, while Canada has the lowest tax rate at 5 per cent. All four Asian countries have a tax rate below the OECD average of 19.2 per cent.
| Country | Rate |
|---|---|
| Canada | 5 |
| Japan | 8 |
| Switzerland | 8 |
| Australia | 10 |
| Korea | 10 |
| Luxembourg | 15 |
| New Zealand | 15 |
| Mexico | 16 |
| Israel | 18 |
| Turkey | 18 |
| Chile | 19 |
| Germany | 19 |
| Austria | 20 |
| Estonia | 20 |
| France | 20 |
| Slovak Republic | 20 |
| United Kingdom | 20 |
| Belgium | 21 |
| Czech Republic | 21 |
| Netherlands | 21 |
| Spain | 21 |
| Italy | 22 |
| Slovenia | 22 |
| Greece | 23 |
| Ireland | 23 |
| Poland | 23 |
| Portugal | 23 |
| Finland | 24 |
| Denmark | 25 |
| Norway | 25 |
| Sweden | 25 |
| Iceland | 25.5 |
| Hungary | 27 |
| Malaysia | 6 |
| Singapore | 7 |
| Indonesia | 10 |
| China | 17 |
| OECD average | 19.2 |
Chart 8.2 VAT coverage ratios in OECD countries, 2012
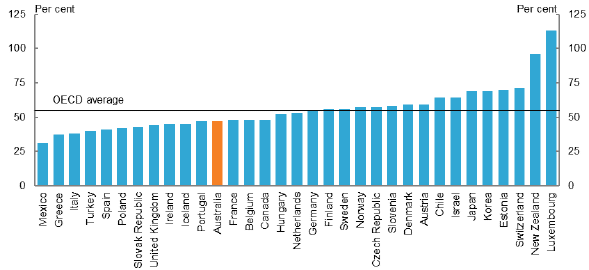
Note: Luxembourg’s VAT coverage ratio of greater than 100 per cent is likely a consequence of its role as an international financial centre and an international centre for e-commerce which can result in Luxembourg collecting VAT revenue even though the final consumption of these services occurs in other countries.
Source: OECD 2014, Consumption Tax Trends 2014, OECD, Paris.
This chart illustrates the VAT coverage ratios in OECD countries for the 2012 year. In Australia there are a range of exemptions that exclude GST from applying to goods and services, meaning that GST was paid only on 47 per cent of the consumption of goods and services. This was a little less than the OECD average of 55 per cent. The country with the lowest VAT coverage ratio was Mexico at 31 per cent, while Luxembourg had the highest VAT coverage ratio at 113 per cent.
| 2012 | |
|---|---|
| Mexico | 31 |
| Greece | 37 |
| Italy | 38 |
| Turkey | 40 |
| Spain | 41 |
| Poland | 42 |
| Slovak Republic | 43 |
| United Kingdom | 44 |
| Ireland | 45 |
| Iceland | 45 |
| Portugal | 47 |
| Australia | 47 |
| France | 48 |
| Belgium | 48 |
| Canada | 48 |
| Hungary | 52 |
| Netherlands | 53 |
| Germany | 55 |
| Finland | 56 |
| Sweden | 56 |
| Norway | 57 |
| Czech Republic | 57 |
| Slovenia | 58 |
| Denmark | 59 |
| Austria | 59 |
| Chile | 64 |
| Israel | 64 |
| Japan | 69 |
| Korea | 69 |
| Estonia | 70 |
| Switzerland | 71 |
| New Zealand | 96 |
| Luxembourg | 113 |
| OECD average | 55 |
Chart 8.3 Estimated per capita consumption and labour income by age in 2003‑04
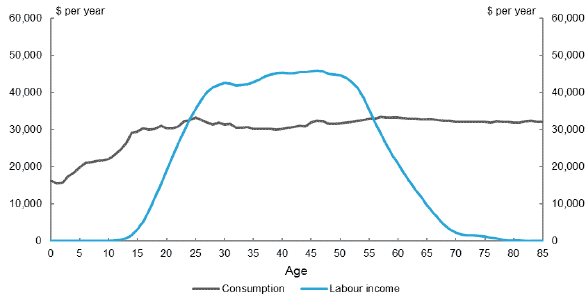
Note: Consumption includes both public and private consumption, such as on housing, education, child care, aged care and health. Labour income comprises labour earnings, including fringe benefits and self-employed labour income.
Source: The National Transfer Accounts Project 2014, National Transfer Accounts, viewed 26 November 2014.1
This chart shows estimates of average per capita consumption and labour income in Australia in 2003-04 by single units of age (from age zero to 85). Consumption rises from around $16,000 per capita at age 0 to around $30,000 at age 23, and then remains around $32,000 per capita until age 85. In contrast, the per capita labour income profile by age has an inverted U-shape and plateaus at $40,000 to $46,000 per capita from age 27 to age 53. From ages 24 to 55 years, labour income exceeds consumption, while at ages below 24 years and ages above 55 years consumption exceeds labour income.
| Age | Australia 2004 Consumption Smooth Mean Nominal | Australia 2004 Labour Income Smooth Mean Nominal |
|---|---|---|
| 0 | 16,243 | 0 |
| 1 | 15,519 | 0 |
| 2 | 15,625 | 0 |
| 3 | 17,380 | 0 |
| 4 | 18,403 | 0 |
| 5 | 19,723 | 0 |
| 6 | 20,941 | 0 |
| 7 | 21,106 | 0 |
| 8 | 21,451 | 0 |
| 9 | 21,750 | 0 |
| 10 | 22,089 | 2 |
| 11 | 23,032 | 44 |
| 12 | 24,515 | 276 |
| 13 | 26,262 | 677 |
| 14 | 29,140 | 1,510 |
| 15 | 29,455 | 3,005 |
| 16 | 30,234 | 5,163 |
| 17 | 29,977 | 8,038 |
| 18 | 30,155 | 11,527 |
| 19 | 31,027 | 15,242 |
| 20 | 30,267 | 19,132 |
| 21 | 30,296 | 22,800 |
| 22 | 30,906 | 26,375 |
| 23 | 32,176 | 29,693 |
| 24 | 32,536 | 32,837 |
| 25 | 33,228 | 35,427 |
| 26 | 32,508 | 38,040 |
| 27 | 31,876 | 40,149 |
| 28 | 31,420 | 41,355 |
| 29 | 31,872 | 42,043 |
| 30 | 31,299 | 42,509 |
| 31 | 31,477 | 42,354 |
| 32 | 30,558 | 41,933 |
| 33 | 30,477 | 42,009 |
| 34 | 30,632 | 42,299 |
| 35 | 30,136 | 42,757 |
| 36 | 30,218 | 43,401 |
| 37 | 30,114 | 44,309 |
| 38 | 30,164 | 44,834 |
| 39 | 29,965 | 45,214 |
| 40 | 30,179 | 45,257 |
| 41 | 30,466 | 45,226 |
| 42 | 30,640 | 45,220 |
| 43 | 30,929 | 45,431 |
| 44 | 30,803 | 45,532 |
| 45 | 31,794 | 45,666 |
| 46 | 32,366 | 45,769 |
| 47 | 32,235 | 45,603 |
| 48 | 31,562 | 44,982 |
| 49 | 31,542 | 44,825 |
| 50 | 31,674 | 44,678 |
| 51 | 31,945 | 44,010 |
| 52 | 32,085 | 42,706 |
| 53 | 32,455 | 41,206 |
| 54 | 32,505 | 38,641 |
| 55 | 32,919 | 35,259 |
| 56 | 32,923 | 31,940 |
| 57 | 33,449 | 28,955 |
| 58 | 33,197 | 25,868 |
| 59 | 33,313 | 23,055 |
| 60 | 33,222 | 20,813 |
| 61 | 33,091 | 18,307 |
| 62 | 32,928 | 15,942 |
| 63 | 32,902 | 13,824 |
| 64 | 32,744 | 11,814 |
| 65 | 32,693 | 9,581 |
| 66 | 32,654 | 7,785 |
| 67 | 32,500 | 5,911 |
| 68 | 32,346 | 4,233 |
| 69 | 32,451 | 2,983 |
| 70 | 32,129 | 2,258 |
| 71 | 32,069 | 1,749 |
| 72 | 32,040 | 1,544 |
| 73 | 32,003 | 1,425 |
| 74 | 31,984 | 1,360 |
| 75 | 32,006 | 1,152 |
| 76 | 31,932 | 844 |
| 77 | 32,286 | 571 |
| 78 | 31,995 | 353 |
| 79 | 31,977 | 170 |
| 80 | 31,952 | 81 |
| 81 | 31,954 | 46 |
| 82 | 32,261 | 14 |
| 83 | 32,367 | 0 |
| 84 | 31,964 | 0 |
| 85 | 32,005 | 0 |
Chart 8.4 GST-exempt spending by gross household income quintile, 2009-10
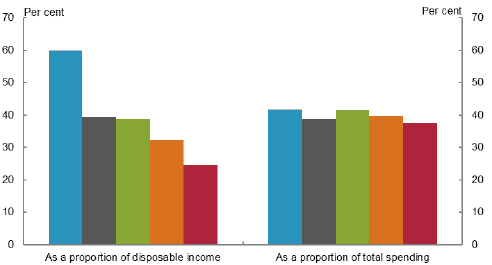
Note: The main categories of GST exempt spending are fresh food, health, education, rent, and financial supplies.
Source: Treasury estimates using ABS 2011, Household Expenditure Survey 2009-10, cat. no. 6530.0, ABS, Canberra.
This chart illustrates the proportion of disposable income and the proportion of total spending that was spent on GST-exempt goods and services in 2009-10 by gross household income quintile.
As a proportion of disposable income, higher-income households spent less on GST-exempt items. While the lowest-income quintile spent around 60 per cent of their disposable income on GST-exempt goods and services, the highest income quintile spent only around 25 per cent of their disposable income on GST-exempt goods and services.
However, as a proportion of total spending, high-income households and low-income households spent a similar amount on GST-exempt goods and services. While the lowest-income quintile spent around 42 per cent of their total spending on GST-exempt goods and services, the highest-income quintile spent around 38 per cent of their total spending on GST-exempt goods and services.
| Lowest 20 per cent | Second | Third | Fourth | Highest 20 per cent | |
|---|---|---|---|---|---|
| As a per cent of disposable income | 59.9 | 39.4 | 38.6 | 32.3 | 24.5 |
| As a per cent of total spending | 41.6 | 38.7 | 41.5 | 39.6 | 37.6 |
Chart 8.5 GST revenue paid and GST revenue forgone (as a result of exemptions to the GST) by gross household income quintile, 2009–10
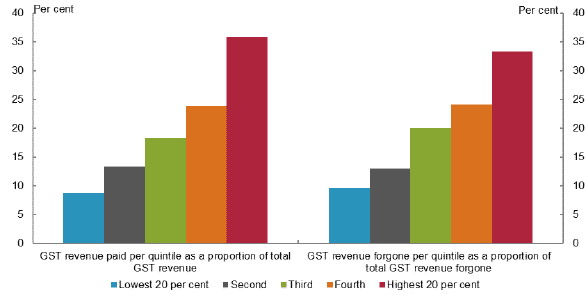
Note: The main categories of GST-exempt spending are fresh food, health, education, rent, and financial supplies.
Source: Treasury estimates using ABS 2011, Household Expenditure Survey 2009-10, cat. no. 6530.0, ABS, Canberra.
This chart illustrates the percentage of GST revenue paid by each household income quintile and the percentage of GST revenue forgone for each household income quintile as a result of GST exemptions.
The proportion of GST revenue paid per household and GST revenue forgone per household both increase with household income. The lowest-income quintile was responsible for around 9 per cent of GST revenue paid and around 10 per cent of GST revenue forgone. These proportions steadily increase as income increases. The highest-income quintile was responsible for around 36 per cent of GST revenue paid and around 33 per cent of GST revenue forgone.
| Lowest 20 per cent | Second | Third | Fourth | Highest 20 per cent | |
|---|---|---|---|---|---|
| GST revenue paid per quintile as a percentage of total GST revenue | 8.7 | 13.3 | 18.3 | 23.8 | 35.9 |
| GST revenue forgone per quintile as a percentage of total GST revenue forgone | 9.6 | 13.0 | 20.0 | 24.1 | 33.4 |
Chart 8.6 GST revenue over time
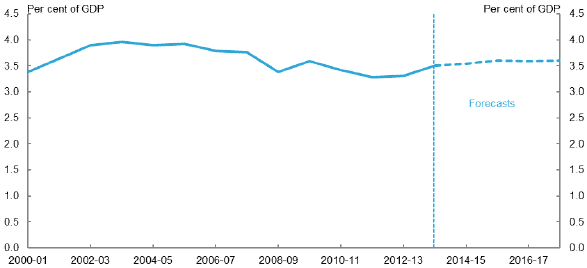
Source: Treasury estimates.
This chart illustrates GST revenue as a percentage of GDP over time. GST revenue as a share of GDP was at a peak of roughly 4.0 per cent of GDP in 2003-04 and gradually fell to around 3.3 per cent of GDP in 2012-13. As a percentage of GDP, GST revenue has increased slightly to around 3.5 per cent in 2013-14, and is projected to increase further to about 3.6 per cent in 2017-18.
| Year | Actual | Forecast |
|---|---|---|
| 2000-01 | 3.4 | |
| 2001-02 | 3.6 | |
| 2002-03 | 3.9 | |
| 2003-04 | 4.0 | |
| 2004-05 | 3.9 | |
| 2005-06 | 3.9 | |
| 2006-07 | 3.8 | |
| 2007-08 | 3.8 | |
| 2008-09 | 3.4 | |
| 2009-10 | 3.6 | |
| 2010-11 | 3.4 | |
| 2011-12 | 3.3 | |
| 2012-13 | 3.3 | |
| 2013-14 | 3.5 | |
| 2014-15 | 3.5 | |
| 2015-16 | 3.6 | |
| 2016-17 | 3.6 | |
| 2017-18 | 3.6 |
Chart 8.7 Sources of state, territory and local government tax revenue, 2012-13
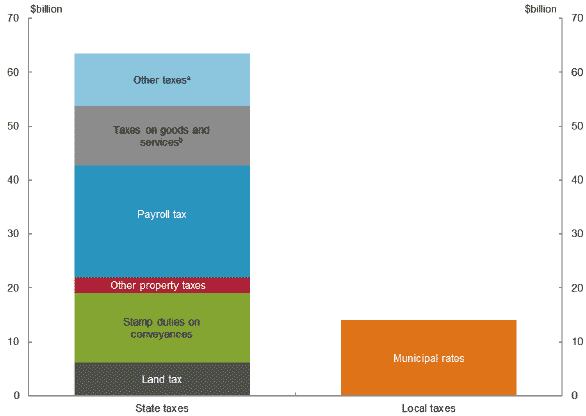
(a) Primarily motor vehicle taxes.
(b) Primarily gambling and insurance taxes. This does not include GST revenue.
Note: Figures are for 2012-13, as this is the most recent year local government data is available.
Source: ABS 2014, Taxation Revenue, Australia, 2012-13, cat. no. 5506.0, ABS, Canberra.
This is a two column chart. The left column shows sources of State and Territory Tax revenue. Reading from the bottom it is split between land tax of around $6 billion, stamp duties on conveyances of around $13 billion, other property taxes of around $3 billion, payroll tax of around $21 billion, taxes on goods and services of around $11 billion and other taxes of around $10 billion.
The right column shows local government revenue which shows that around $14 billion local government tax revenue in 2012-13 came from municipal rates.
| $ billion | Payroll tax | Land tax | Stamp duties on conveyances | Municipal rates | Other property taxes | Taxes on goods and services (b) | Other taxes (a) |
|---|---|---|---|---|---|---|---|
| State taxes | 21 | 6 | 13 | 0 | 3 | 11 | 10 |
| Local taxes | 0 | 0 | 0 | 14 | 0.1 | 0 | 0 |
Note: ACT's municipal rates are included in State - other property taxes
(a) Primarily motor vehicle taxes
(b) Primarily gambling and insurance taxes. This does not include GST revenue.
Chart 8.8 Sources of state and territory tax revenue, 2013-14
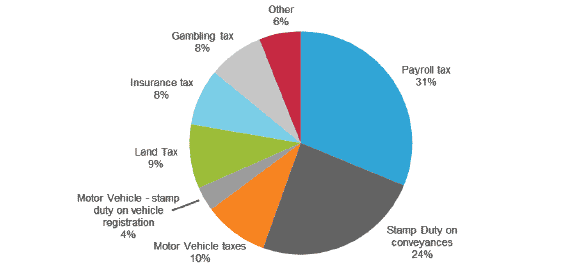
Source: Treasury calculations using state and territory 2013-14 final budget outcomes (or equivalents) and 2014-15 state and territory budgets.2
Note: ‘Motor vehicle taxes’ excludes stamp duty on vehicle registration.
This pie chart shows all of the major sources of state and territory tax revenue. It shows that payroll tax makes up 31 per cent of total state and territory tax revenue in 2013-14, Stamp duty on conveyances 24 per cent, motor vehicle taxes 10 per cent, motor vehicle – stamp duty on vehicle registration 4 per cent, land tax 9 per cent, insurance tax 8 per cent, gambling tax 8 per cent and other taxes 6 per cent.
| Sources of State and Territory tax revenue 2013-14 (Per cent) | |
|---|---|
| Payroll tax | 31 |
| Stamp Duty on conveyances | 24 |
| Motor Vehicle taxes | 10 |
| Motor Vehicle - stamp duty on vehicle registration | 4 |
| Land Tax | 9 |
| Insurance tax | 8 |
| Gambling tax | 8 |
| Other | 6 |
Chart 8.9 Taxes on financial and capital transactions as a percentage of total taxation, OECD countries, 2012
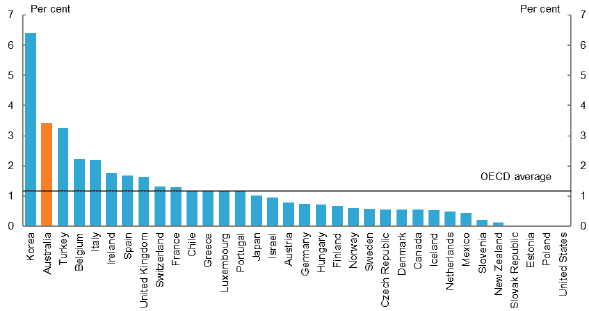
Note: Taxes on financial and capital transactions include taxes on the issue, transfer, purchase and sale of securities, taxes on cheques, and taxes levied on specific legal transactions such as validation of contracts and the sale of immovable property.
Source: OECD 2014, Revenue Statistics 2014, OECD Publications, Paris.
This chart shows taxes on financial and capital transactions as a share of total taxation across the 34 OECD countries in 2012. Transaction taxes were second highest in Australia and highest in South Korea.
| Country | Taxes on financial and capital transactions as share of total taxation |
|---|---|
| Korea | 6.4 |
| Australia | 3.4 |
| Turkey | 3.2 |
| Belgium | 2.2 |
| Italy | 2.2 |
| Ireland | 1.8 |
| Spain | 1.7 |
| United Kingdom | 1.6 |
| Switzerland | 1.3 |
| France | 1.3 |
| Chile | 1.2 |
| Greece | 1.2 |
| Luxembourg | 1.2 |
| OECD Average | 1.2 |
| Portugal | 1.1 |
| Japan | 1 |
| Israel | 0.9 |
| Austria | 0.8 |
| Germany | 0.7 |
| Hungary | 0.7 |
| Finland | 0.7 |
| Norway | 0.6 |
| Sweden | 0.6 |
| Czech Republic | 0.6 |
| Denmark | 0.6 |
| Canada | 0.6 |
| Iceland | 0.5 |
| Netherlands | 0.5 |
| Mexico | 0.4 |
| Slovenia | 0.2 |
| New Zealand | 0.1 |
| Slovak Republic | 0 |
| Estonia | 0 |
| Poland | 0 |
| United States | 0 |
Chart 8.10 Recurrent taxes on immovable property as a percentage of total taxation, OECD countries, 2012
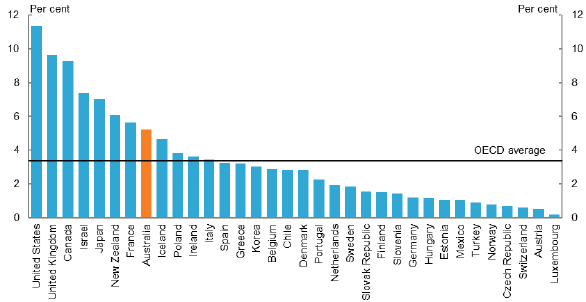
Note: Recurrent taxes on immovable property cover taxes levied regularly in respect of the use or ownership of immovable property.
Source: OECD 2014, Revenue Statistics 2014, OECD Publications, Paris.
This chart shows recurrent taxes on immovable property as a share of total taxation across the 34 OECD countries in 2012. Taxes on immovable property in Australia were 5.2 per cent of total taxation, which was higher than the OECD average of 3.3 per cent but lower the share in seven other OECD countries (including the United States, United Kingdom, Canada, New Zealand and Japan).
| Country | Taxes on immovable property as share of total taxation |
|---|---|
| United States | 11.4 |
| United Kingdom | 9.7 |
| Canada | 9.3 |
|
Israel |
7.4 |
| Japan | 7.0 |
| New Zealand | 6.1 |
| France | 5.6 |
| Australia | 5.2 |
| Iceland | 4.7 |
| Poland | 3.8 |
| Ireland | 3.6 |
| Italy | 3.4 |
| OECD average | 3.3 |
| Spain | 3.2 |
| Greece | 3.2 |
| Korea | 3.0 |
| Belgium | 2.9 |
| Chile | 2.8 |
| Denmark | 2.8 |
| Portugal | 2.3 |
| Netherlands | 1.9 |
| Sweden | 1.8 |
| Slovak Republic | 1.6 |
| Finland | 1.5 |
| Slovenia | 1.4 |
| Germany | 1.2 |
| Hungary | 1.2 |
| Estonia | 1.0 |
| Mexico | 1.0 |
| Turkey | 0.9 |
| Norway | 0.8 |
| Czech Republic | 0.7 |
| Switzerland | 0.6 |
| Austria | 0.5 |
| Luxembourg | 0.2 |
Chart 8.11 State and territory government expenses and own source revenue, 2013-14
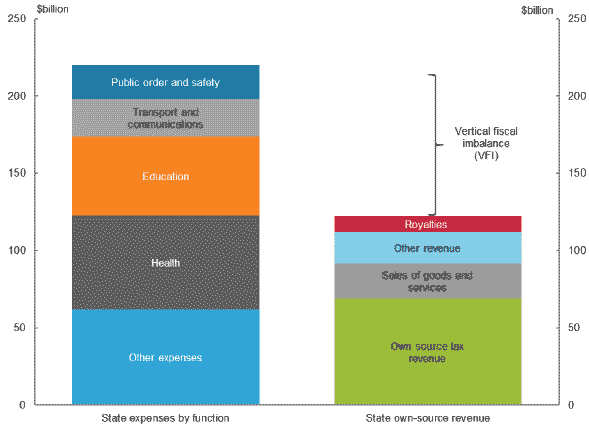
Note: ‘Sales of goods and services’ includes user charging on state provided services. For the purpose of this chart the distribution of GST revenue is not considered state own-source revenue. ‘Own source tax revenue’ includes stamp duties on conveyances, land tax, other property taxes, and payroll tax, among other state taxes.
Source: Treasury calculations based on state and territory 2013-14 final budget outcomes (or equivalent) and state and territory 2014-15 budgets.3
This is a two column chart which illustrates the level of vertical fiscal imbalance in Australia. The left column shows state expenses by function in 2013-14, comprising health expenses of around $61 billion, education expenses of around $51 billion, transport and communications expenses of around $24 billion, public order expenses of around $22 billion, and other expenses of around $62 billion. This equals total state expenses of around $220 billion.
The right column shows that total state own source revenue in 2013-14 was equal to around $122 billion. The gap between the heights of the two columns illustrate the level of vertical fiscal imbalance in Australia.
| $ billion | Public order and safety | Transport and communications | Education | Health | Other expenses | Total expenses |
| State expenses by function | 22 | 24 | 51 | 61 | 62 | 220 |
| $ billion | Royalties | Other revenue | Sales of goods and services | Own-source tax revenue | Own-source revenue |
| State own-source revenue | 10 | 20 | 23 | 69 | 122 |
1 See also Rice, J, Temple, J, and McDonald, P 2014, National Transfer Accounts for Australia: 2003-04 and 2009-10 detailed results, Crawford School of Public Policy, Canberra, viewed 5 December 2014.
2 , Report on State Finances 2013-14, New South Wales Government, Sydney; New South Wales Government 2014, NSW 2014-15 Budget, Budget Paper 2 — Budget Statement, New South Wales Government, Sydney. Victorian Government 2014, 2013-14 Financial Report (incorporating Quarterly Report No.4), Victorian Government, Melbourne. Queensland Government 2014, 2013-14 Report on State Finances of the Queensland Government — 30 June 2014, Queensland Government, Brisbane. Government of Western Australia 2014, 2013-14 Annual Report on State Finances, Government of Western Australia, Perth. Government of South Australia 2014, 2014-15 Budget Paper 3: Budget Statement, Government of South Australia, Adelaide. Government of Tasmania 2014, Treasurer’s Annual Financial Report 2013-14, Government of Tasmania, Hobart. Australian Capital Territory Government 2014, Consolidated Annual Financial Statements — 2013-14; Australian Capital Territory Government, Canberra; Australian Capital Territory Government 2014, September Quarter 2014 Consolidated Financial Report, Australian Capital Territory Government, Canberra. Northern Territory Government 2014, Treasurer’s Annual Financial Report, Northern Territory Government, Darwin; Northern Territory Government 2014, Budget Paper No.2: Budget Strategy and Outlook 2014-15, Northern Territory Government, Darwin.
3 New South Wales Government 2014, Report on State Finances 2013-14, New South Wales Government, Sydney; Victorian Government 2014, 2013-14 Financial Report (incorporating Quarterly Report No.4), Victorian Government, Melbourne. Queensland Government 2014, 2013-14 Report on State Finances of the Queensland Government — 30 June 2014, Queensland Government, Brisbane. Government of Western Australia 2014, 2013-14 Annual Report on State Finances, Government of Western Australia, Perth. Government of South Australia 2014, 2014-15 Budget Paper 3: Budget Statement, Government of South Australia, Adelaide. Government of Tasmania 2014, Treasurer’s Annual Financial Report 2013-14, Government of Tasmania, Hobart. Australian Capital Territory Government 2014, Consolidated Annual Financial Statements — 2013-14, Australian Capital Territory Government, Canberra. Northern Territory Government 2014, Treasurer’s Annual Financial Report, Northern Territory Government, Darwin.