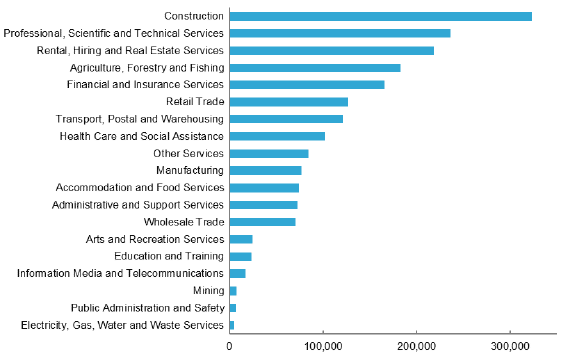
Chart 6.1 Number of small businesses by industry, 2013

Note: Small businesses are based on the ABS definition of less than 20 employees.
There are approximately 83,000 small businesses which are classified as ‘Unknown’ by the Australian Bureau of Statistics (ABS). These businesses include unclassified or other industries that do not belong to the other classified industries.
Source: ABS 2014, Counts of Australian Businesses, including Entries and Exits, June 2009 to June 2013, cat. no. 8165.0, ABS, Canberra.
This chart presents the number of small businesses for 19 industries, using the ABS definition of a small business. The construction industry has the highest number of small businesses, followed by professional, scientific and technical services, and rental, hiring and real estate services.
| Industry | Number of businesses with fewer than 20 employees |
|---|---|
| Construction | 323,648 |
| Professional, Scientific and Technical Services | 236,755 |
| Rental, Hiring and Real Estate Services | 218,362 |
| Agriculture, Forestry and Fishing | 183,365 |
| Financial and Insurance Services | 165,929 |
| Retail Trade | 127,186 |
| Transport, Postal and Warehousing | 121,238 |
| Health Care and Social Assistance | 101,958 |
| Other Services | 84,333 |
| Manufacturing | 77,142 |
| Accommodation and Food Services | 73,873 |
| Administrative and Support Services | 72,933 |
| Wholesale Trade | 70,450 |
| Arts and Recreation Services | 24,836 |
| Education and Training | 23,450 |
| Information Media and Telecommunications | 17,134 |
| Mining | 7,485 |
| Public Administration and Safety | 6,723 |
| Electricity, Gas, Water and Waste Services | 5,131 |
| Unknown | 83,102 |
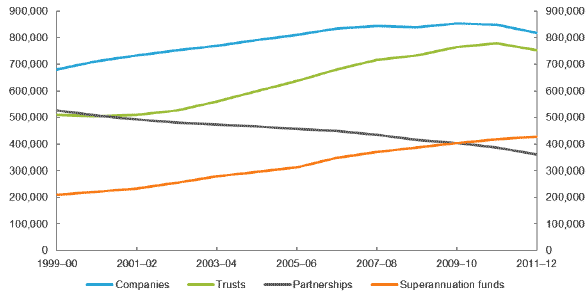
Chart 6.2 Number of entities lodging tax returns

Source: Australian Taxation Office 2014, Taxation Statistics 2011-12, Australian Taxation Office, Canberra.
This chart of different entity types shows the increase in the number of companies, superannuation funds and trusts, from the period 2000 to 2012, and the decrease in partnerships over the same period.
| X Values | Companies | Trusts | Partnerships | Superannuation funds |
|---|---|---|---|---|
| 1999–00 | 681,735 | 509,400 | 526,230 | 208,490 |
| 2000–01 | 712,645 | 504,800 | 507,150 | 220,890 |
| 2001–02 | 734,270 | 509,085 | 493,935 | 233,930 |
| 2002–03 | 752,600 | 526,055 | 482,095 | 255,680 |
| 2003–04 | 769,520 | 559,630 | 474,685 | 279,830 |
| 2004–05 | 791,405 | 598,205 | 466,910 | 295,985 |
| 2005–06 | 811,560 | 636,500 | 457,700 | 313,150 |
| 2006–07 | 833,790 | 679,845 | 448,795 | 349,475 |
| 2007–08 | 844,735 | 716,945 | 436,415 | 370,385 |
| 2008–09 | 839,315 | 733,780 | 415,420 | 386,540 |
| 2009–10 | 853,480 | 764,105 | 403,880 | 403,460 |
| 2010–11 | 849,100 | 780,345 | 386,620 | 418,240 |
| 2011–12 | 817,885 | 753,730 | 359,905 | 428,055 |