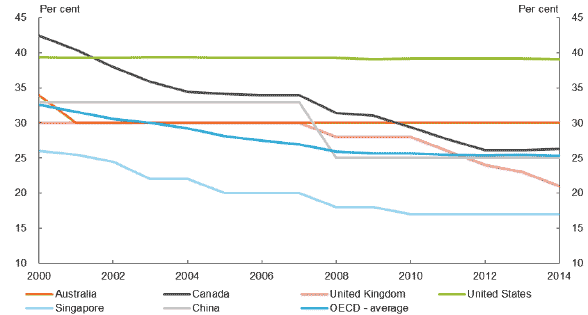
Chart 5.1 Trend in corporate tax rates in selected economies
Source: Organisation for Economic Co-operation and Development (OECD) 2014, Tax Database — Taxation of Corporate and Capital Income, OECD, Paris, viewed 5 December 2014; KPMG 2014, Corporate tax rates table, viewed 5 December 2014: and KPMG 2007, Hong Kong Tax Competiveness Series: Corporate Tax Rates, viewed 5 December 2014; KPMG 2006, KPMG’s Corporate Tax Rate Survey, An international analysis of corporate tax rates from 1993 to 2006, viewed on 21 January 2015.
This chart shows the trend in corporate tax rates in Australia, Canada, Singapore, the United Kingdom, the United States of America, China and the OECD, from 2000-2014. It shows that the corporate tax rate in Australia and the United States has remained the same since 2001, while the corporate tax rate in the United Kingdom, Canada, Singapore, China and the OECD has fallen over this period.
| Country | 2000 | 2001 | 2002 | 2003 | 2004 | 2005 | 2006 |
|---|---|---|---|---|---|---|---|
| Australia | 34 | 30 | 30 | 30 | 30 | 30 | 30 |
| Singapore | 26 | 26 | 25 | 22 | 22 | 20 | 20 |
| Canada | 42 | 40 | 38 | 36 | 34 | 34 | 34 |
| China | 33 | 33 | 33 | 33 | 33 | 33 | 33 |
| United Kingdom | 30 | 30 | 30 | 30 | 30 | 30 | 30 |
| OECD - average | 33 | 32 | 31 | 30 | 29 | 28 | 28 |
| United States | 39 | 39 | 39 | 39 | 39 | 39 | 39 |
| Country | 2007 | 2008 | 2009 | 2010 | 2011 | 2012 | 2013 | 2014 |
|---|---|---|---|---|---|---|---|---|
| Australia | 30 | 30 | 30 | 30 | 30 | 30 | 30 | 30 |
| Singapore | 20 | 18 | 18 | 17 | 17 | 17 | 17 | 17 |
| Canada | 34 | 31 | 31 | 29 | 28 | 26 | 26 | 26 |
| China | 33 | 25 | 25 | 25 | 25 | 25 | 25 | 25 |
| United Kingdom | 30 | 28 | 28 | 28 | 26 | 24 | 23 | 21 |
| OECD - average | 27 | 26 | 26 | 26 | 25 | 25 | 25 | 25 |
| United States | 39 | 39 | 39 | 39 | 39 | 39 | 39 | 39 |
Chart 5.2 Corporate tax rates, selected trading partners, 2014
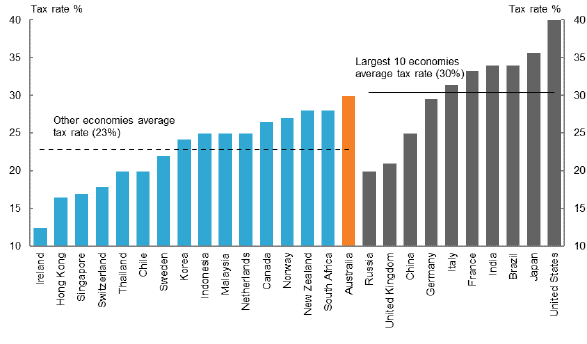
Note: Corporate tax rates in this chart are estimates as the effective tax rate can vary depending on the specific tax rules applied in each jurisdiction. Chart 5.2 uses a different data source to Chart 5.1 which may result in slight differences in the estimates. For example, the United States’ corporate income tax rate is approximately 40 per cent. The estimate of this rate can vary depending on how corporate income taxes applied at the sub-central level (by state and local governments) are measured.
Note: The Indian Government announced in their 2015-16 budget that they would introduce a company tax cut from a base rate of 30 to 25 percent over four years, coupled with some reductions in tax concessions. The rate of 33.99% shown above includes various surcharges over the base rate.
Source: KPMG 2014, Corporate tax rates table, viewed 10 December 2014.
This chart compares the corporate tax rate in Australia in 2014 with selected trading partners, including the world’s 10 largest economies. It shows that Australia has a higher corporate tax rate in 2014 than the majority of these countries.
| Russia | 20 |
| United Kingdom | 21 |
| China | 25 |
| Germany | 30 |
| Italy | 31 |
| France | 33 |
| India | 34 |
| Brazil | 34 |
| Japan | 36 |
| United States | 40 |
| Average | 30 |
| Ireland | 13 |
| Hong Kong | 17 |
| Singapore | 17 |
| Switzerland | 18 |
| Thailand | 20 |
| Chile | 20 |
| Sweden | 22 |
| Korea | 24 |
| Indonesia | 25 |
| Malaysia | 25 |
| Netherlands | 25 |
| Canada | 27 |
| Norway | 27 |
| New Zealand | 28 |
| South Africa | 28 |
| Australia | 30 |
| Average | 23 |
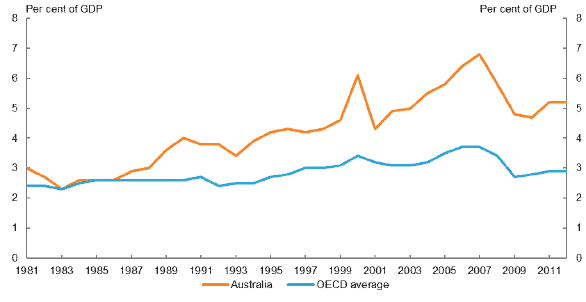
Chart 5.3 Corporate tax revenue
Source: OECD 2014, Revenue Statistics 2014, OECD, Paris.
This chart shows corporate tax revenue as a percentage of GDP in Australia and the OECD, over the period 1981 to 2012. It shows that Australia has raised significantly more corporate tax revenue as a percentage of GDP than the OECD average since the late 1980s.
| Year | Australia | OECD Average |
|---|---|---|
| 1981 | 3.0 | 2.4 |
| 1982 | 2.7 | 2.4 |
| 1983 | 2.3 | 2.3 |
| 1984 | 2.6 | 2.5 |
| 1985 | 2.6 | 2.6 |
| 1986 | 2.6 | 2.6 |
| 1987 | 2.9 | 2.6 |
| 1988 | 3.0 | 2.6 |
| 1989 | 3.6 | 2.6 |
| 1990 | 4.0 | 2.6 |
| 1991 | 3.8 | 2.7 |
| 1992 | 3.8 | 2.4 |
| 1993 | 3.4 | 2.5 |
| 1994 | 3.9 | 2.5 |
| 1995 | 4.2 | 2.7 |
| 1996 | 4.3 | 2.8 |
| 1997 | 4.2 | 3.0 |
| 1998 | 4.3 | 3.0 |
| 1999 | 4.6 | 3.1 |
| 2000 | 6.1 | 3.4 |
| 2001 | 4.3 | 3.2 |
| 2002 | 4.9 | 3.1 |
| 2003 | 5.0 | 3.1 |
| 2004 | 5.5 | 3.2 |
| 2005 | 5.8 | 3.5 |
| 2006 | 6.4 | 3.7 |
| 2007 | 6.8 | 3.7 |
| 2008 | 5.8 | 3.4 |
| 2009 | 4.8 | 2.7 |
| 2010 | 4.7 | 2.8 |
| 2011 | 5.2 | 2.9 |
| 2012 | 5.2 | 2.9 |
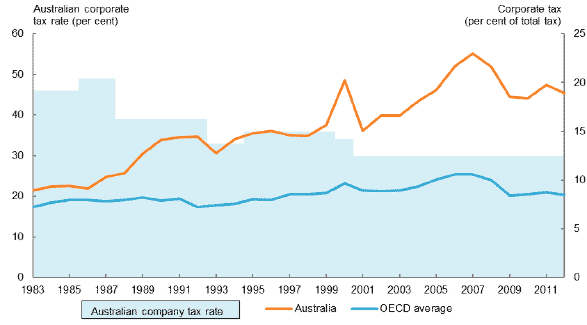
Chart 5.4 Corporate tax revenue as a percentage of total tax revenue
Source: OECD 2014, Revenue Statistics 2014, OECD, Paris.
This chart shows corporate tax revenue as a percentage of total tax revenue in Australia and the OECD, over the period 1983 to 2012. It shows that Australia raises more corporate tax revenue as a percentage of total tax revenue than the OECD average over this period.
| Corporate tax rate (per cent) | Corporate tax revenue (per cent of total tax) | OECD average corporate tax revenue (per cent of total tax) | |
|---|---|---|---|
| 1983 | 46 | 9 | 7 |
| 1984 | 46 | 9 | 8 |
| 1985 | 46 | 9 | 8 |
| 1986 | 49 | 9 | 8 |
| 1987 | 49 | 10 | 8 |
| 1988 | 39 | 11 | 8 |
| 1989 | 39 | 13 | 8 |
| 1990 | 39 | 14 | 8 |
| 1991 | 39 | 14 | 8 |
| 1992 | 39 | 14 | 7 |
| 1993 | 33 | 13 | 7 |
| 1994 | 33 | 14 | 8 |
| 1995 | 36 | 15 | 8 |
| 1996 | 36 | 15 | 8 |
| 1997 | 36 | 15 | 9 |
| 1998 | 36 | 15 | 9 |
| 1999 | 36 | 16 | 9 |
| 2000 | 34 | 20 | 10 |
| 2001 | 30 | 15 | 9 |
| 2002 | 30 | 17 | 9 |
| 2003 | 30 | 17 | 9 |
| 2004 | 30 | 18 | 9 |
| 2005 | 30 | 19 | 10 |
| 2006 | 30 | 22 | 11 |
| 2007 | 30 | 23 | 11 |
| 2008 | 30 | 22 | 10 |
| 2009 | 30 | 18 | 8 |
| 2010 | 30 | 18 | 9 |
| 2011 | 30 | 20 | 9 |
| 2012 | 30 | 19 | 9 |
Chart 5.5 Resident company income tax by company size, 2011-12
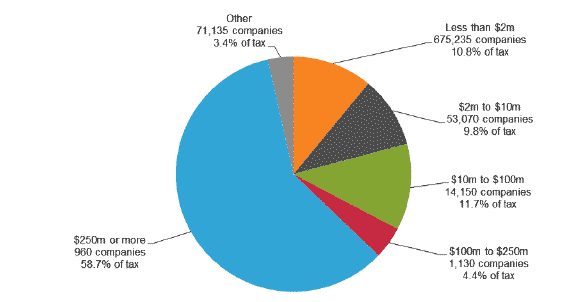
Note: Total income is used as a measure of company size. ‘Other’ includes companies classified as a cooperative, registered organisation, non-profit, strata title, pooled development fund, limited partnership, corporate unit trust or a public trading unit trust.
Source: ATO 2014, Taxation Statistics 2011-12, ATO, Canberra.
This chart illustrates the proportion of company income tax collected by company size. This pie chart shows that companies in the highest income bracket (earning $250 million or more) pay the most company income tax. Companies earning $250 million or more (of which there are 960 companies) pay 58.7 per cent of total company income tax.
| Category | Resident company net tax ($) | % of resident and non resident company net tax |
|---|---|---|
| Less than $2m 675,235 companies 10.8% of tax |
6,951,197,795 | 10.8 |
| $2m to $10m 53,070 companies 9.8% of tax |
6,280,878,957 | 9.8 |
| $10m to $100m 14,150 companies 11.7% of tax |
7,494,520,715 | 11.7 |
| $100m to $250 m 1,130 companies 4.4% of tax |
2,825,716,660 | 4.4 |
| $250m or more 960 companies 58.7% of tax |
37,632,331,946 | 58.7 |
| Other 71,135 companies 3.4% of tax |
2,212,896,059 | 3.4 |
| Total company net tax (resident and non resident companies) | 64,151,821,806 | 98.8 |
Chart 5.6 Overall taxation (percentage) of resident individuals who receive dividends from domestic corporations in OECD countries, 2014
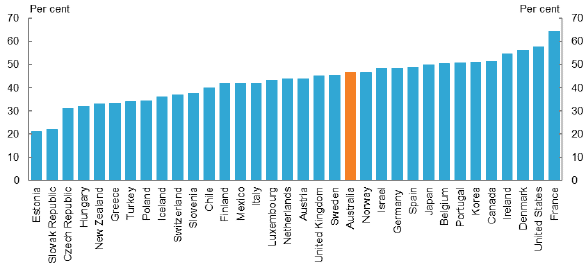
Note: Overall taxation comprises corporate and personal taxation of dividends. Assumes that the dividend is paid by a domestic company to a resident individual on the highest marginal rate. These rates do not include the Temporary Budget Repair Levy of 2 per cent or the 0.5 percentage point increase in the Medicare Levy Surcharge which took effect on 1 July 2014.
Source: OECD 2014, Tax Database, Corporate and capital income taxes, OECD, Paris, viewed 9 December 2014.
This chart compares the total tax (combined personal and corporate tax) applying to company profits distributed as dividends in OECD countries in 2014. It assumes that the dividend is paid by a domestic company to a resident individual on the highest personal marginal tax rate. The chart shows that the total level of tax is similar across many countries, and Australia is in the middle of the range.
| Country | Tax rate of dividends (per cent) |
|---|---|
| Estonia | 21 |
| Slovak Republic | 22 |
| Czech Republic | 31 |
| Hungary | 32 |
| New Zealand | 33 |
| Greece | 33 |
| Turkey | 34 |
| Poland | 34 |
| Iceland | 36 |
| Switzerland | 37 |
| Slovenia | 38 |
| Chile | 40 |
| Finland | 42 |
| Mexico | 42 |
| Italy | 42 |
| Luxembourg | 43 |
| Netherlands | 44 |
| Austria | 44 |
| United Kingdom | 45 |
| Sweden | 45 |
| Australia | 46 |
| Norway | 47 |
| Israel | 49 |
| Germany | 49 |
| Spain | 49 |
| Japan | 50 |
| Belgium | 50 |
| Portugal | 51 |
| Korea | 51 |
| Canada | 51 |
| Ireland | 55 |
| Denmark | 56 |
| United States | 58 |
| France | 64 |