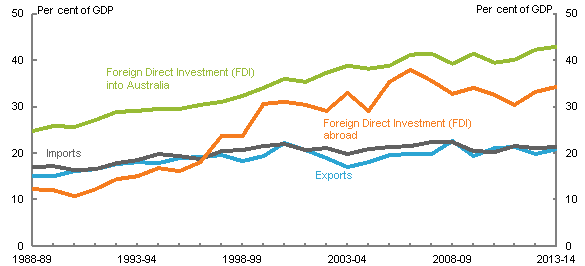
Chart 1.1 Trade and foreign direct investment as a share of GDP
Source: ABS 2014, Australian System of National Accounts, cat. no. 5204.0, ABS, Canberra.
This chart shows trade (exports and imports) and foreign direct investment (into Australia and abroad) as a share of GDP from 1988-89 to 2013-14.
| Exports | Imports | FDI in Australia | FDI abroad | |
|---|---|---|---|---|
| 1988-89 | 15.1 | 17.0 | 24.9 | 12.2 |
| 1989-90 | 15.1 | 17.1 | 25.8 | 12.0 |
| 1990-91 | 16.0 | 16.2 | 25.7 | 10.8 |
| 1991-92 | 16.7 | 16.5 | 27.1 | 12.2 |
| 1992-93 | 17.5 | 17.9 | 28.9 | 14.5 |
| 1993-94 | 18.0 | 18.5 | 29.1 | 15.0 |
| 1994-95 | 17.9 | 19.8 | 29.6 | 16.8 |
| 1995-96 | 18.9 | 19.3 | 29.5 | 16.0 |
| 1996-97 | 19.1 | 18.8 | 30.3 | 18.2 |
| 1997-98 | 19.6 | 20.4 | 31.1 | 23.7 |
| 1998-99 | 18.4 | 20.6 | 32.3 | 23.7 |
| 1999-00 | 19.4 | 21.5 | 34.0 | 30.5 |
| 2000-01 | 22.1 | 22.0 | 35.9 | 31.0 |
| 2001-02 | 20.7 | 20.6 | 35.4 | 30.3 |
| 2002-03 | 18.9 | 21.0 | 37.4 | 29.1 |
| 2003-04 | 17.0 | 19.7 | 38.8 | 32.9 |
| 2004-05 | 18.1 | 20.8 | 38.2 | 29.0 |
| 2005-06 | 19.6 | 21.4 | 38.7 | 35.3 |
| 2006-07 | 19.9 | 21.5 | 41.2 | 38.0 |
| 2007-08 | 19.8 | 22.4 | 41.4 | 35.6 |
| 2008-09 | 22.5 | 22.4 | 39.3 | 32.7 |
| 2009-10 | 19.5 | 20.4 | 41.4 | 34.1 |
| 2010-11 | 21.2 | 20.1 | 39.5 | 32.6 |
| 2011-12 | 21.3 | 21.5 | 40.0 | 30.4 |
| 2012-13 | 19.9 | 21.1 | 42.2 | 33.1 |
| 2013-14 | 20.9 | 21.3 | 42.9 | 34.3 |
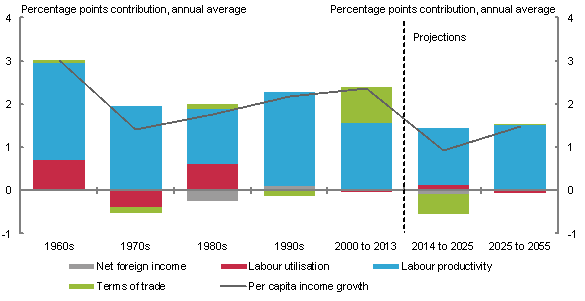
Chart 1.2 Sources of growth in real national income per person
Source: ABS 2015, Australian National Accounts, cat. no. 5206.0, ABS, Canberra and Treasury
The chart shows the contributions to real gross national income per capita annual average growth of net foreign income, labour utilisation, labour productivity and the terms of trade.
| Per capita income growth | Labour utilisation | Net foreign income | Terms of trade | Labour productivity | Terms of trade | |
|---|---|---|---|---|---|---|
| 1960s | 3.0 | 0.6 | 0.0 | 0.0 | 2.2 | 0.0 |
| 1970s | 1.4 | -0.3 | 0.0 | -0.1 | 1.9 | -0.1 |
| 1980s | 1.7 | 0.6 | -0.2 | 0.1 | 1.2 | 0.1 |
| 1990s | 2.1 | 0.0 | 0.1 | -0.1 | 2.1 | -0.1 |
| 2000 to 2013 | 2.3 | 0.0 | 0.0 | 0.8 | 1.5 | 0.8 |
| 2014 to 2025 | 0.9 | 0.1 | 0.0 | -0.4 | 1.3 | -0.4 |
| 2025 to 2055 | 1.4 | 0.0 | 0.0 | 0.0 | 1.5 | 0.0 |