Superannuation in Australia is a tax preferred investment where tax concessions are provided to encourage (and increase the level of) saving for retirement and provide an offset to 'locking up' superannuation until preservation age11.
This section assesses the extent of the tax advantage of superannuation taking account of both current tax levels and the changes announced in the 2002-03 Budget, which importantly included the government co-contribution for low income earners. The framework used is that of Rothman (2000) updated for tax changes.
The assessment is from the individual's viewpoint, particularly in two broad areas:
- For those contributing at Superannuation Guarantee (SG) level over a working lifetime; and
- For one off investments, mostly by persons with assets over their Eligible Termination Payment tax-free threshold (currently $112,405 and indexed annually to AWOTE).
Limits to superannuation tax concessions
There are a number of limits in the overall taxation of superannuation, which are intended to limit the tax concessions available to an individual over a working lifetime. The age based contribution limits are one such limit and arguably, the contributions surcharge is another. The other key limit is the Reasonable Benefit Limit or RBL. All the analyses in this Section assume that contributions are within the age limits and that the relevant RBL is not exceeded over a person's working life. This covers an overwhelming majority of cases.
The limits constitute integral safeguards for the system and need to be respected; some analyses show very high tax rates if these limits are exceeded (eg Smith, 2000). A number of recent government policy actions and decisions are aimed at making individuals no worse off within superannuation than outside it, even where the limits are exceeded.
Analysis framework
The framework is as developed in Rothman (2000). In brief, this uses Excel spreadsheets to compare the amounts accumulated at retirement after all taxes in two situations: the first where the person invests in the superannuation system with its rules and taxes and the second where the same person invests the equivalent monies as available post income tax outside of the superannuation system, using the same investment portfolio as used for the superannuation investment. Care is taken to distinguish pre tax monies from post tax and to compare like with like.
A conservative, simplified framework is used which assumes taking all benefits as a post preservation age ETP and applying the full 16.5 per cent tax rate above the ETP tax-free threshold (where the threshold applies). This framework somewhat understates the relative advantage of superannuation. Those who choose retirement income stream products will not pay ETP tax on these benefits and may also gain a 15 per cent tax rebate; generally this will result in a higher standard of living in retirement than taking all benefits as an ETP (see Tinnion and Rothman, 1999).
Results
(a) Compulsory superannuation - The Superannuation Guarantee
The analysis framework has been used to assess the extent of tax advantage given to SG contributions over a working lifetime made up of any number of years up to 40. It is assumed that the fully implemented SG rates apply throughout. The analysis is done for people based on their marginal tax bracket.
The results in the following chart set out the percentage advantage of the 'all taxes paid' outcome for superannuation compared with the 'all taxes paid' outcome for money invested outside of superannuation, using a similar balanced investment portfolio.
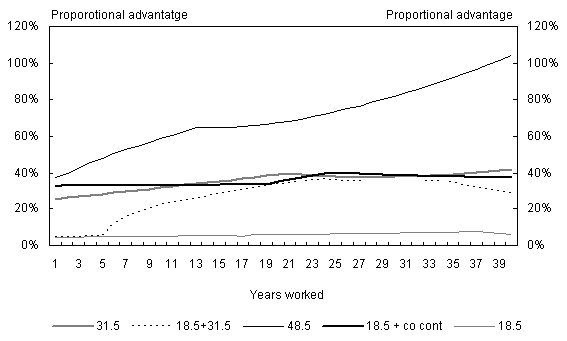
Chart 2: Proportional advantage of SG superannuation contributions

The various lines refer to the marginal personal income tax rate of the person. For the 18.5 and 31.5 lines, the marginal tax rate applies throughout the person's working life. The '18.5+31.5' case has the person on the 18.5 per cent marginal personal tax rate for the first 5 years of their working life, followed by 30 years of work at 31.5 per cent, and the rest of working life at 18.5 per cent. Arguably, patterns such as this, combining periods of work at 18.5 per cent with longer periods at 31.5 per cent, are fairly typical cases. The 48.5 line assumes the person pays this marginal tax rate and the full surcharge throughout their working life. The surcharge rate is assumed to reduce in line with the Government's intentions as announced in the 2002-03 Budget.
The (constant) 18.5 case, in effect, excludes any period of adult full time work12. Further, given the potential importance of the newly announced co-contribution policy, a line is included which is not a pure SG line but has the (constant) 18.5 per cent person making a member contribution of 3 per cent. This is then fully matched by a government co-contribution. All the cases shown except this one are solely SG contribution cases.
The chart shows, for example, that the SG superannuation accumulation after all taxes for a person consistently on a 31.5 per cent marginal personal income tax rate is 40 per cent more after 21 years and 42 per cent more after 40 years than the accumulation of the equivalent post tax contributions outside of the superannuation system. For the '18.5+31.5' case the advantage of superannuation is 36 per cent after 24 years and 29 per cent after 40 years. For the '18.5 + co-cont' case, the advantage of superannuation is 39 per cent after 30 years and 38 per cent after 40 years.
The slight dips in the purely SG curves13 indicate when the ETP tax-free threshold is exceeded. For example, this occurs after 21 years for the person consistently in the 31.5 per cent marginal tax bracket, and 13 years for the person paying 48.5 per cent.
The case of a person consistently on an 18.5 per cent tax rate shows that such a person would not exceed their ETP tax-free threshold until around 37 years of work receiving the full SG. Given the SG has only now reached the full 9 per cent rate, and given the history of superannuation coverage described earlier, most of those currently on the 18.5 per cent rate will be substantially under the ETP tax-free threshold14 and this is the framework adopted for the next part of the analysis.
As the proportional advantage of superannuation is always positive in the chart, it is clear that given SG employer contributions only, superannuation is a tax-preferred investment over a working lifetime for persons in all tax brackets.
(b) One off investments
The second major area of analysis is to consider the relative advantage of superannuation for one off investments, mostly by persons over the ETP tax-free threshold. The comparisons assume like portfolios for the within and outside superannuation investments.
As explained in the previous section, we assume that for the 18.5 per cent tax bracket the additional investment does not cause the ETP tax-free threshold to be breached. For all higher tax brackets, however, we assume that the person will exceed the ETP tax-free threshold over his/her working life and accordingly that the one off investment being considered will not benefit from the ETP tax-free threshold.
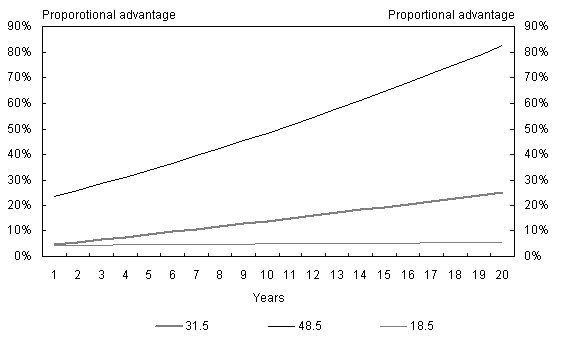
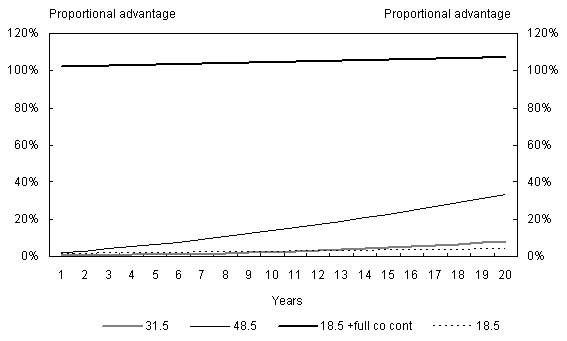
For periods of investment from 1 year up to 20 years, the charts below show the comparative advantage of employer and
member superannuation, using a balanced portfolio for both the within and outside superannuation investments.
The analysis allows for a small differential in entry fees between the within and outside superannuation investments15.
In all tax brackets there is a clear advantage for employer superannuation building up over time. Comparing directly corresponding cases by tax bracket, the advantage of member superannuation is consistently lower than the corresponding advantage for employer superannuation. Generally the advantage for member superannuation is small for short periods for other than the top tax bracket, but builds up over time; the exception is the '18.5 + full co-cont' case as explained below.
Chart 3: Proportional advantage of employer superannuation -
one off investment, balanced portfolio

Chart 4: Proportional advantage of member superannuation -
one off investment, balanced portfolio

For the case of a person with an 18.5 per cent marginal personal tax rate, two situations in relation to member investments are modelled: in one case titled '18.5 + full co-cont' the dollar for dollar matching government co-contribution for member contributions up to $1000 is assumed to be available. The other 18.5 situation shown above occurs much less frequently. In the 18.5 line the co-contribution is zero as the maximum available co-contribution limit is assumed to have been reached prior to this investment. Clearly, many examples between the two extremes are possible. This co-contribution will also be available, at a reduced rate, for some persons in the 31.5 per cent bracket, considerably increasing the relative advantage of member superannuation for such persons, but given the wide range of possibilities, this has not been modelled explicitly.
Table 6 below sets out the relative advantage of superannuation after 10 years for various portfolios for both employer and member contributions. The same general relative pattern can be seen to apply independently of the portfolio chosen, with superannuation shown to be tax advantaged for all member and employer investments.
| Fixed term (%) |
Shares (%) |
Balanced (%) |
|
|---|---|---|---|
| Employer | |||
| 18.5 | 7.1 | 5.8 | 4.9 |
| 31.5 | 17.3 | 14.6 | 13.8 |
| 48.5 | 55.7 | 52.0 | 48.5 |
| Member | |||
| 18.5 | 2.7 | 3.5 | 2.4 |
| 18.5 + co-cont | 107.4 | 104.9 | 104.7 |
| 31.5 | 4.2 | 2.8 | 2.3 |
| 48.5 | 18.7 | 14.7 | 13.7 |
Negative gearing
All the analysis above assumes that the comparison is between situations using the same investment portfolios for the within and outside superannuation investments. However, the use of 'gearing' is an option available to those investors outside superannuation who are prepared to tolerate higher levels of risk. To make a geared investment, an individual increases the size of the total amount invested by adding a borrowed amount to their own investment, with the interest payable on the borrowing usually tax deductible to the investor. The term 'negative' in relation to gearing applies when, as is usually the case, the nominal yield of the investment is less than the level of interest charged on the borrowing and therefore the attractiveness of the investment relies significantly upon the tax system. When drawing comparisons in the case of negative gearing, we use the same investment portfolios for the within and outside superannuation investments but here only the investment outside superannuation is geared, as the regulations prohibit the gearing of superannuation investments.
As well as normal assumptions on investment returns, for the 'negative gearing' scenarios it is also necessary to specify the extent of gearing and an interest rate for the loan. For all cases it is assumed that the gearing arrangement borrows a sum equal to twice the original after tax amount available for investment - which is a 'middle of the road' geared investment. The interest rate charged on the loan is assumed to vary from 0.75 per cent to 2 percentage points higher than the notional (pre tax) return of the investment. The examples shown in Table 7 below assume employer contributions are used for the superannuation investment and a balanced portfolio is utilised.
| Marginal tax rate % |
0.75 per cent (%) |
1.25 per cent (%) |
2.0 per cent (%) |
|---|---|---|---|
| 18.5 | 1.4% | 7.3% | 17.4% |
| 31.5 | 7.0% | 12.2% | 21.0% |
| 48.5 | 33.4% | 38.3% | 46.4% |
The results are not strongly dependent on the investment portfolio used but, not surprisingly, the extent of superannuation's relative advantage does vary significantly with the margin paid for the borrowing compared with the nominal return on the investment portfolio.
The continuing advantage of superannuation, even where a negatively geared strategy is used outside superannuation, is a strong result, given that any negative gearing strategy based on growth investments necessarily involves higher risk than the corresponding superannuation investment and will have very adverse results if the investments turn sour.
Sensitivity analysis
The exact figures in the Charts and Tables above depend on the precise details of the cases considered, including the make-up of the investment portfolio and in some cases the salary of the person.
The spreadsheets have been used to consider how the results vary by the fees and charges relating to the investment, portfolio composition, rates of return on investments, and the frequency of realisation of capital gains made. While the results for returns on individual investments do vary in response to the changes, the comparative patterns and the broad differences are quite robust to reasonable changes in these parameters.
Discussion
While the above analysis has been fully updated to reflect recent and announced government policy changes, other parties have drawn broadly similar conclusions to those above, usually with less comprehensive coverage. However a subset of authors and commentators have published quite different and apparently contradictory conclusions. Treasury suggests that the apparent contradictions arise because of one or more of the following traps.
- The first and perhaps most obvious error is to simply add taxation percentages together - for example some people add the 30 per cent contributions tax (including surcharge) plus 16.5 
;per cent ETP tax (and perhaps 15 per cent earnings tax) and then compare this sum with 48.5 per cent, the top rate of personal income tax. Clearly this is wrong because the taxes apply to different quantities and need to be calculated correctly16. - A related mistake is to ignore the ETP tax-free threshold, which is shown by the above analysis to be an integral and important part of the system.
- Another potential mistake is the failure to compare like with like and in so doing, confuse the tax status of monies available for investment.
- More a distortion than a mistake, is to focus on contributions outside the age based limits and cases where the relevant RBL is exceeded over a person's working life. The overwhelming majority of actual cases do not fall into these categories.
Conclusions
Assuming that contributions are made within age based limits and within RBLs, which cover the overwhelming majority of cases, the analysis demonstrates that for persons in all tax brackets receiving SG employer contributions only, superannuation is a tax preferred investment over a working lifetime of up to 40 years duration.
For persons in the 31.5 per cent and higher tax brackets, one off investments through superannuation are relatively advantaged for all ungeared investment portfolios.
Generally, making one off investments through employer contributions gives a higher level of advantage than using member contributions to make the investment. However the availability of the co-contribution dramatically changes the relativity for the 18.5 cases and the lower income ranges within the 31.5 bracket, where the maximum co-contribution has not been reached. Specifically, a one off investment by a person in the 18.5 per cent tax bracket remaining below their ETP tax-free threshold, is tax advantaged by 4 to 7 per cent for employer contributions, and by up to 107 per cent for member contributions under the low income co-contribution limit.
Further, for reasonably constructed comparisons using employer contributions and negative gearing for the outside of superannuation investment, superannuation remains the preferred investment vehicle in all tax brackets, with the strong advantage of involving much lower risk than negative gearing.
References
Australian Prudential Regulation Authority, Superannuation Trends December Quarter 2001, 2002.
Brown, C. and McDiarmid A., 'RIMHYPO , An Outline of the Code.', RIM Technical paper 2/1995, Canberra, 1995.
Budget Strategy and Outlook 2002-03, Budget Paper No. 1, 14 May 2002.
Budget Measures 2002-03, Budget Paper No. 2, 14 May 2002.
Intergenerational Report 2002-03, Budget Paper No. 5, 14 May 2002.
National Strategy for an Ageing Australia, 'Independence and Self Provision' Discussion Paper, Canberra, 1999.
Rothman, G., 'Aggregate and Distributional Analysis of Australian Superannuation using the RIMGROUP Model', Colloquium of Superannuation Researchers, University of Melbourne, July 1996.
Rothman, G., 'Assessing The Tax Advantages Of Superannuation', Paper to The Eighth Annual Colloquium of Superannuation Researchers, University of NSW, July 2000.
Smith, B., 'The Super Rip Off', Taxpayers Australia Magazine, p318-319, 24 April 2000.
Tax Expenditure Statement 2001, The Treasury, December 2001.
Tinnion, J. and Rothman, G., 'Retirement Income Adequacy and the Emerging Superannuation System', Paper to The Seventh Annual Colloquium of Superannuation Researchers, University of Melbourne, July 1999.
11 The Treasury's estimate of the level of concessions uses a personal income tax benchmark. The estimate is published regularly in the Tax Expenditure Statements and the Budget papers; for 2002-03 it is projected at $10.3 billion.
12 Minimum award wages for full time adult work now exceed $20000 pa, which is the upper bound of the 18.5 per cent range.
13 For the '18.5+31.5' case there is also a dip after 35 years related to the change in marginal tax rate.
14 Some limited number of persons previously earning higher annual salaries and now reverting, say to part time work, may have reached the ETP tax-free limit.
15 The differential in entry fees used is 1 per cent of the amount invested for the balanced portfolio, with the investment outside superannuation paying the higher fee. For the fixed term portfolio, the differential used is zero, as many fixed term investments are readily available without entry fees; for the all shares portfolio, including overseas shares, the differential used is 2 per cent.
16 Assuming 30 per cent contributions tax (including surcharge) plus 16.5 per cent ETP tax, the correct maximum effective tax rate, ignoring earnings, is 41.6 per cent (compared with the 48.5 per cent personal income tax marginal rate).