This submission uses two modelling approaches to the measurement of replacement rates:
- modelling of the lifecycles of hypothetical individuals and couples; and
- modelling for the whole Australian population using actual and projected comprehensive labour force experience, superannuation diversity and retirement diversity.
The models used were updated to take account of recently announced taxation and other policy changes, lengthening life expectancies, revised interest rate and other economic parameters and revised annuity factors.
(a) Hypothetical modelling of the adequacy of retirement incomes under the Superannuation Guarantee and the Age Pension
Treasury's Retirement and Income Modelling (RIM) Unit has modelled current Superannuation Guarantee and Age Pension policy for a variety of hypothetical scenarios corresponding to a request received from the Secretary of the Senate Select Committee on Superannuation on 30 April 2002. A comprehensive set of results is presented in Appendix A. Analysis of the Government's proposed co-contribution policy is also included in this submission.
Choosing parameters for a hypothetical analysis of retirement incomes
In considering what sort of life experience should be considered for hypothetical cases the following issues arise:
- the level of earnings over a career;
- the length and extent of interruption of that career and the related choice of the income unit type;
- the nature of the replacement rate measure;
- the approach to indexation of income and expenditure amounts which are presented; and
- the choice of economic and fund parameters.
The most commonly used measure of earnings in superannuation is the Average Weekly Ordinary Time Earnings (AWOTE) of persons working full time. AWOTE has the advantage of giving a full-time base covering males and females which excludes overtime. Such a base corresponds to the earnings base of most superannuation plans. AWOTE is also the basis for indexing most dollar value thresholds in superannuation. Most employees (70 per cent) earn less than AWOTE with median earnings being 75 per cent of AWOTE and mean earnings being 83 per cent of AWOTE.8
The Superannuation Guarantee when it was introduced extended coverage mostly to blue collar and casual employees in the lower half of the earnings distribution. For the purposes of this submission three illustrative incomes are covered for full-time workers - 75 per cent, 100 per cent and 150 per cent of AWOTE. Part-time workers are taken as proportions of this based on hours.
AWOTE in March 2002 was $860.50 or the equivalent of $44,746 per year. So 75 per cent of AWOTE is around $33,560 and 150 per cent is around $67,119. In general people earning above $50,000 have savings in addition to the Superannuation Guarantee which could be used to produce retirement income. From taxation data Treasury's RIM unit has estimated that:
- 69 per cent of employed people aged 40 or more with incomes over $50,000 have superannuation higher than the SG or significant non-superannuation savings;
- 63 per cent of women under 65 with taxable incomes over $50,000 have superannuation higher than the SG or significant non-superannuation savings; and
- 60 per cent of men under 65 with taxable incomes over $50,000 have superannuation higher than the SG or significant non-superannuation savings.
For these reasons, SG only cases for people whose incomes are in excess of 150 per cent of AWOTE appear atypical and are not presented in this submission.
Fully representative data on the completed lengths of careers for individuals are not available. For the purposes of this submission, career lengths of 25, 30 and 40 years are used. For convenience, all hypothetical cases presented in the body of this submission retire at age 65 in 2032. Age 65 was chosen because it corresponds to Age Pension age - some cases beginning retirement on Newstart Allowance or Mature Age Allowance are shown in Appendix A. The common retirement year of 2032 was chosen so that all dollar values for retirement are comparable. If this had not been done, cases retiring later would have higher real wages and higher real Age Pension payments.
Many women have careers which are interrupted by childbirth, so this submission presents results for interrupted female careers and for couples in which the female partner has an interrupted career.
Some groups have based their replacement rates on measures of gross income. This is not considered the best approach because of substantial differences in taxation before and after retirement. Expenditure is used in this submission as the best guide to private standards of living. This submission proposes that the optimal replacement rate measure is the ratio of average expenditure in retirement to the expenditure in the last year of full-time working life. Other measures presented involve either too great a time period between average working life and retirement income or the unrepresentative nature of the first year retirement income.
The best deflator for expenditure is the consumer price index. Deflating by wages (as in the results of other groups) does not reflect what people are able to buy, and does not capture growth in real wages and the real value of the Age Pension over time.
The current hypothetical analysis, done using the RIMHYPO Model, uses long-term annual growth parameters of 2.5 per cent for the consumer price index, 4 per cent for wages and 7 per cent for fund earnings.
Case 1: Single males retiring in 2032
Table 2 presents the results of RIMHYPO runs for six hypothetical males retiring in 2032, with an average life expectancy of 83, taking their superannuation as a lump sum benefit and drawing down on it in an annuity pattern so that it lasts until life expectancy.
Table 2: Scenarios for single males retiring in 2032
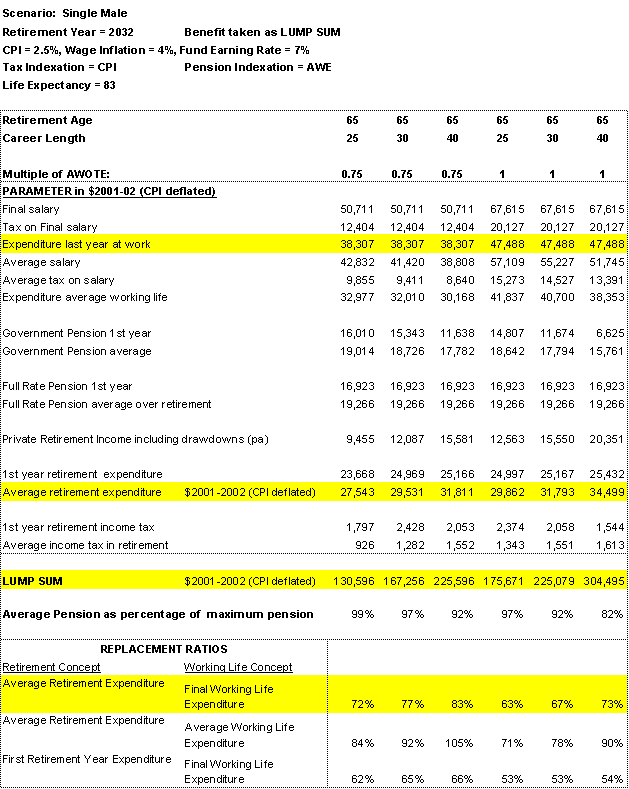
For the three cases with career earnings of 75 per cent of AWOTE, expenditure in the last year of working life is $38,307 in 2001-02 dollars. The average expenditure over retirement ranges from $27,543 for the 25-year career to $31,811 for the 40-year career, giving replacement rates ranging from 72 per cent to 83 per cent. The contribution of the Age Pension to retirement expenditure falls as private retirement income (and assets) rises.
For the 30-year accumulation case at 75 per cent of AWOTE, the lump sum benefit of $167,256 yields an annual drawdown of $12,087 which is complemented by an Age Pension which averages $18,726 (or 97 per cent of a full rate pension). An average of $1,282 of tax is paid in retirement.9 The replacement rate of average retirement expenditure to final year of full-time work expenditure is 77 per cent.
For the three cases with career earnings of 100 per cent of AWOTE expenditure in the last year of working life is $47,488 in 2001-02 dollars. The average expenditure over retirement ranges from $29,862 for the 25-year career to $34,499 for the 40-year career, giving replacement rates ranging from 63 per cent to 73 per cent. The contribution of the Age Pension to retirement expenditure falls as private retirement income (and assets) rises.
For the 30-year accumulation case at 100 per cent of AWOTE, the lump sum benefit of $225,079 yields an annual drawdown of $15,550 which is complemented by an Age Pension which averages $17,794 (or 92 per cent of a
full rate pension). An average of $1,551 of tax is paid in retirement.10 The replacement rate of average retirement expenditure to final year of full-time work expenditure is 67 per cent. This is lower than the 75 per cent of AWOTE case mainly because the contribution from the Age Pension is a lower proportion of final working expenditure.
Case 2: Single females with interrupted careers
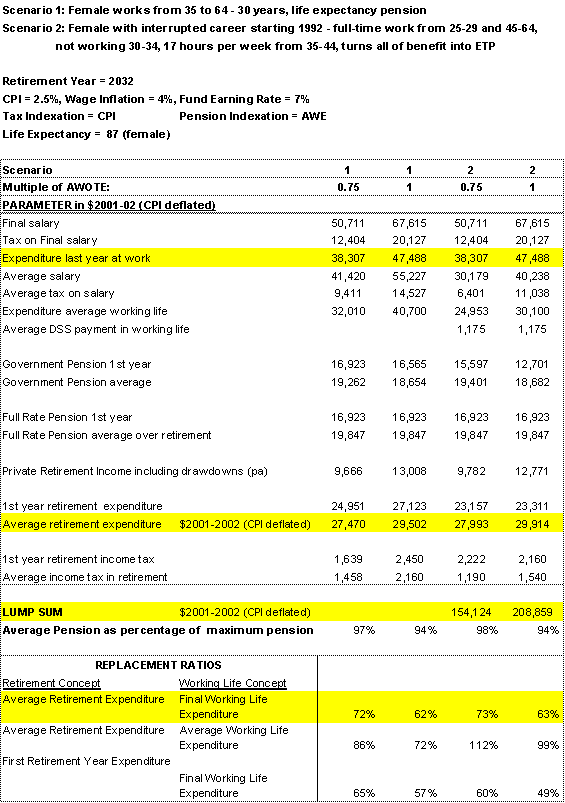
Table 3 presents two scenarios for females with interrupted careers who are not married when they enter retirement and who rely on their own superannuation for private retirement income.
In Scenario 1, the woman works from 35 to 64 years and takes her benefit in the form of a life expectancy pension. Cases are presented for career earnings at 75 per cent of AWOTE and 100 per cent of AWOTE.
In Scenario 2, the woman works full time from 25 to 29 and 45 to 64, does not work from 30-34 and works 17 hours per week from ages 35 to 44. Cases are presented for career earnings at 75 per cent of AWOTE and 100 per cent of AWOTE.
For Scenario 1, the expenditures in the final years of working life are $38,307 and $47,488 for the 75 per cent and 100 per cent of AWOTE cases respectively. The average expenditures in retirement are $27,470 and $29,502 giving replacement rates of 72 per cent and 62 per cent respectively.
For Scenario 2, the expenditures in the final years of working life are $38,307 and $47,488 for the 75 per cent and 100 per cent of AWOTE cases respectively. The average expenditures in retirement are $27,993 and $29,914 giving replacement rates of 73 per cent and 63 per cent respectively.
Table 3: Scenarios for single females
Case 3: A married couple
Table 4 presents two income levels for a scenario for a couple where the male has 40 years in the workforce, and the female has 6 years out of workforce (30-35) and ten years working part time (36-45). The partners have the same income when working full-time and both take their benefits as life expectancy pension.
Table 4: Scenarios for a couple
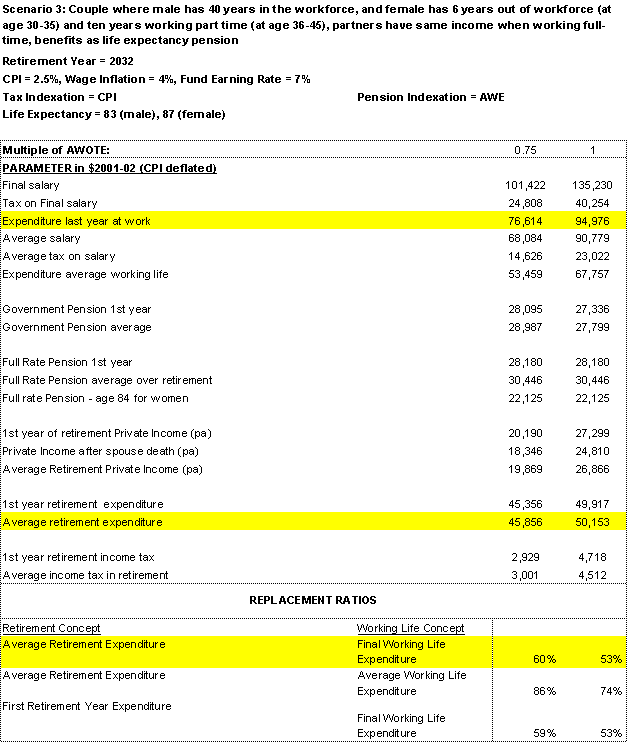
The final working year expenditure for the couples achieved are $76,614 for the 75 per cent of AWOTE case and $94,976 for the 100 per cent of AWOTE case. The average retirement incomes are $45,856 and $50,153 respectively. The replacement rates achieved are 60 per cent for the 75 per cent of AWOTE case and 53 per cent for the 100 per cent of AWOTE case. These are lower than for the single cases because the married rate pension replaces less of individual income when both members of a couple have previously been working. If only one member of a couple has been working, the married rate payment offers a very high replacement rate.
Case 4: The potential effects of the Government's proposed co-contribution policy
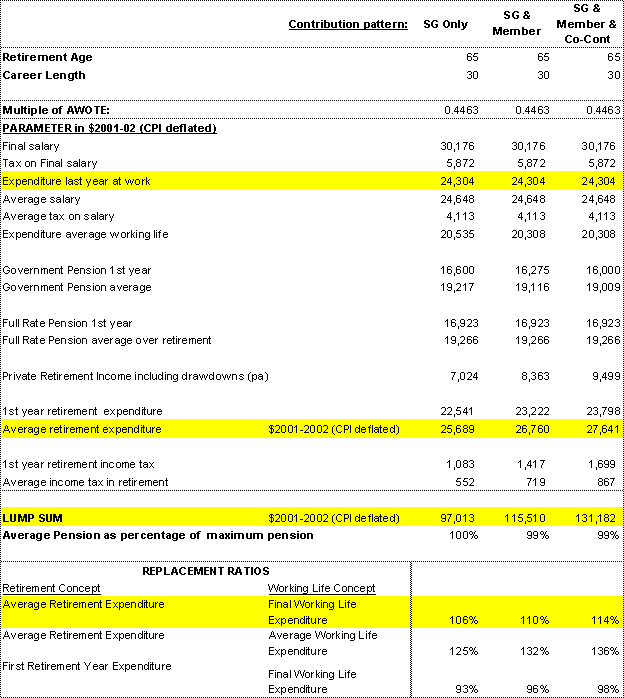
Table 5 compares three contribution scenarios for a single male earning 44 per cent of AWOTE ($20,000 in 2003-04), working for 30 years and retiring at age 65. The contributions are employer SG contributions only, SG plus member contributions in a pattern which would maximise co-contribution receipts but without co-contributions, and the SG plus member plus co-contribution scenario. Because the co-contribution thresholds are not indexed, as real wages are assumed to rise the employee loses their co-contribution entitlement after 12 years.
The lump sums generated by these patterns are $97,013, $115,510, and $131,182 respectively. The Age Pension provides a considerable replacement of this employee's final year of work expenditure, and the average to final replacement rate is raised from 106 per cent for SG only to 114 per cent for SG plus member plus co-contributions. Across the 19 years of retirement, the 12 years of member contributions and the co-contributions raise retirement income by almost $2,000 per year in real terms, or by around 8 per cent.
Conclusions on hypothetical scenarios
The SG in combination with the Age Pension can produce replacement rates in excess of 60 per cent for male careers of 25, 30 and 40 years duration and for interrupted female careers. If both members of a couple are working at retirement, the married rate Age Pension provides a lower base replacement rate than in the single case, but if one member of a couple is working it provides a higher base replacement rate. Member contributions combined with co-contributions (whose income test threshold is not indexed) can improve retirement incomes by 8 per cent for workers earning around $20,000.
Table 5: Example of the effect of the Government's co-contribution policy on final benefits
(b) Whole of population analysis of replacement rates
As with the hypothetical analysis, the main adequacy concept used is a replacement rate based on post-retirement consumption expenditure compared with pre-retirement expenditure. As before, this includes income from all investments, all pension payments including social security payments, and drawdowns from capital less any taxation payable. Aggregate analysis done using the RIMGROUP model assumes current legislated policy parameters. However in this aggregate analysis the comparison drawn is between the expenditure of retirees for the 5 years after pension eligibility age with income for the 5 years before Age Pension eligibility age. Given the structure of RIMGROUP in which new retirees are pooled with existing retirees, this definition makes it easier to do aggregate analysis, while distinguishing between cohorts which may have retired a decade or more earlier. The distinction is relevant because, in general, retirees do not maintain a living standard in retirement that is fully linked to average wages, while the age pension is linked to total male average wages. The mix of investments of retirees means that their non-pension income, which is mainly sourced from interest bearing investments and may have capital drawdowns, will generally not grow in real terms.
What differentiates the aggregate from the hypothetical analysis?
The prime difference between aggregate and hypothetical analysis is the coverage in the aggregate analysis of the entire Australian population. Aggregate analysis covers the range of labour force experiences including unemployment and other breaks from the labour force, the range of retirement ages, and the varying superannuation coverage across the population including some schemes with better than SG rates of contribution, salary sacrifice arrangements, and member contributions. Additionally RIMGROUP estimates other financial savings at retirement and adds these to the pool of monies to be allocated and invested at retirement. RIMGROUP also allocates retirement investments patterns in a realistic way and allows for dissipation at retirement and drawdowns during retirement. These patterns are a function of gender and decile, although the data base is not comprehensive in all of these respects.
Also important in the aggregate analysis is the time dimension, whereby the experiences of those retiring now can be compared with those retiring in thirty or forty years - time is an important and automatic dimension of the analysis. The hypothetical analysis presented in this submission only looks at those retiring in 30 years time.
The aggregate modelled results for th
e present time with its low nominal investment returns are higher than Johnson's (1998) finding of 33 per cent replacement rate from the Age Pension alone, reflecting modest income from additional investments (Johnson found that for the middle quintile currently 88 per cent of total income comes from a government pension). The value added in the analysis presented below is the capacity to project changing replacement ratios up to 50 years into the future with realistic superannuation and other savings and assuming high draw-down of assets in retirement. As the SG system matures the modelled replacement rates rise sharply.
Potential aggregate replacement rates
For an analysis of potential replacement rates it seems appropriate to assume that assets are largely drawn down in an annuity pattern over the person's or couple's retirement. This reflects the approach taken in the hypothetical analysis and gives a measure of the potential afforded by the retirement income framework. In practice, given uncertainty as to their longevity, most prudent people won't quite achieve this and as an operational compromise we have assumed annuity drawdown of all fixed interest deposits but only moderate drawdown of shares and allocated pensions. This assumed pattern together with a broad continuation of labour force and retirement trends and tendencies and continuation of recent investment patterns in retirement is the basis of all the aggregate results which follow.
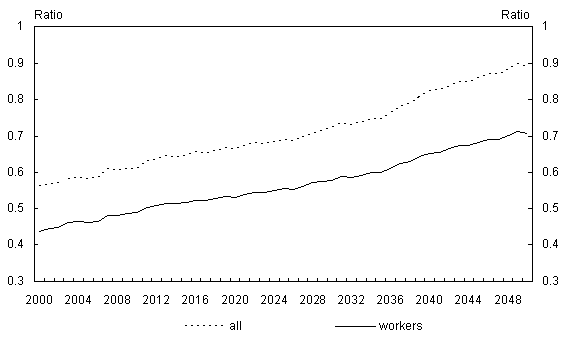
Ratios of retirement expenditure over recent pre retirement expenditure are calculated for two groups: those who have had long term superannuation coverage, and the full population, adding in those who have had little or no superannuation coverage, including the self employed who have chosen not to contribute. For convenience these groups are referred to as 'workers' and 'all' respectively. The time analysis of aggregate replacement ratios for these two groups is shown in the chart below.
Chart1: Potential aggregate replacement ratios - annuity drawdown all workers and full population
Conclusions
The aggregate analysis incorporates the experiences of the whole population, accounts for savings above the base SG level, and adds a valuable time dimension whereby the experiences of those retiring now can be compared with those retiring in thirty or forty years. For an analysis of potential replacement rates it seems appropriate to assume that assets are largely drawn down in an annuity pattern over the period of the person or couple's retirement. The aggregate analysis on this basis shows replacement ratios for workers rising significantly from 45 per cent currently to 71 per cent by 2050. For the 'all' group the replacement ratios are about 57 per cent now, rising to 75 per cent by 2035 and almost 90 per cent by 2050.
8 ABS Cat. No. 6306.0 Employee Earnings and Hours, May 2000.
9 The tax scales are indexed by the CPI. The Senior Australians Tax Offset is not indexed but the Age Pension rebate is indexed to the pension and the pension free area and people are entitled to the higher of the two.
10 The tax scales are indexed by the CPI. The Senior Australians Tax Offset is not indexed but the Age Pension rebate is indexed to the pension and the pension free area and people are entitled to the higher of the two.