4.1 Exchange rate overvaluation
For some analytical purposes the real exchange rate is defined as the ratio between the prices of non-tradeable goods to the price of tradeable goods. For many practical purposes the real exchange rate between two countries, or between one country and a group of trading partner countries, is approximated by estimating the nominal exchange rate adjusted for the inflation difference between the home country and other countries. Movements of the real exchange rate in response to economic shocks and changing economic circumstances at home and abroad provide relative price signals that work to adjust the balance between the production of traded and non-traded goods and services. The exchange rate movement (depending on its direction) may have a positive or negative effect on inflation, exports, imports and the balance of payments.
For the purposes of this paper, a real exchange rate is neither undervalued nor overvalued (that is it is not misaligned but at an equilibrium competitive level) when it is consistent with a given set of economic fundamentals over the medium to longer term.23 Different sets of fundamentals can produce different equilibrium competitive real exchange rates, and consequently estimation can be subject to considerable judgment and possible error.24 In one model economic fundamentals are based on the assumption that the country achieves both internal and external balance. Internal balance is represented by full employment and price stability. External balance requires that the balance of payments position is sustainable over the medium term, ensuring desired net flows of resources and external debt sustainability. Other methodologies for determining the equilibrium competitive real exchange rate include influences such as the terms-of-trade, relative labour productivity, interest rate differentials and net foreign assets in the set of economic fundamentals.
The move to an overvalued real exchange rate by an appreciation in the nominal exchange rate leads to lower imported inflation, and this benefit may, at the time it takes place, appear attractive to governments, particularly if domestic inflation is high and there is uncertainty about the ability of interest rate policy to lower inflation.
As well, countries with a fixed exchange rate regime may use the nominal exchange rate as an anchor against inflation. Authorities in these countries may be reluctant to change the fixed nominal parity (by devaluation) to avoid overvaluation (of the real exchange rate) in circumstances where inflation is rising faster than in trading partner economies and the current account is deteriorating. This policy preference may reflect a belief that the benefits from lower inflation exceed the uncertain short-term trade benefits from devaluation.
However, broadly-based overvaluation usually detracts from export competitiveness, and makes imports cheaper, thus contributing to larger trade and current account deficits and, in the Pacific island context, to even greater import dependency. Reflecting the nature of currency pegs and invoicing practices, some sectors of the tourism industry may be adversely affected by overvaluation. Overvaluation of the real exchange rate slows productivity growth and is not usually associated with growth acceleration.25 Persistent and substantial overvaluation makes the economy weaker and more dependent on foreign capital inflows, but encourages outflows of foreign exchange and may presage a growing shortage in foreign currency reserves: related speculation may then trigger capital flight. With current and capital accounts adversely impacted, monetary policy and capital controls would need to be tightened to lower import demand and to check the capital outflow. During such ‘overvaluation’ episodes private sector investment and output growth could be seriously weakened.
If left unaddressed substantial overvaluation of the real exchange rate is likely to result in devaluation of the nominal exchange rate being forced on the government during an inevitable balance of payments crisis. Large one-off devaluations of this type, following a period of substantial overvaluation, may contribute to sharply higher imported inflation (as can be observed in the case of Fiji in Chart 1), abrupt disruption to established industry structures and higher unemployment in the short-term.
4.2 Real effective exchange rates
Where exchange rates are based on a basket of currencies, the nominal effective exchange rate is the exchange rate of the domestic currency vis-à-vis the basket currencies, weighted by the shares of the basket country’s trade in the domestic country’s trade. The real effective exchange rate is the exchange rate of the domestic currency vis-à-vis the basket currencies that also takes account of differences in inflation rates between the domestic country and trading partners.
Chart 3 illustrates the movements in the real effective exchange rates for selected Pacific island countries before and during the global economic crisis. As can be observed, exchange rates became overvalued across a number of Pacific island countries during the global economic crisis.26Overvaluation occurs when the real exchange rate moves above its longer-term equilibrium competitive value. If foreign currency reserves establish a strong downward trend and fall below a target minimum level, say three or four months of import cover (a widely used benchmark for developing countries exposed to external economic shocks), it is likely that the currency is substantially overvalued ─ particularly if the current account deficit is unsustainably high and foreign debt is excessive.
Care is required when interpreting movements in real effective exchange rates. It cannot be concluded (without further analysis) that depreciation (a fall) of the real effective exchange rate over time is a good thing (as it reflects increased exchange rate competitiveness) or that an appreciation (a rise) over time of the real effective exchange rate is necessarily a bad thing (on the basis that it reflects a loss of exchange rate competitiveness). A rise in the real effective exchange rate could reflect a loss of competitiveness that should be of concern, or it could reflect an improvement in economic performance that should be welcomed.
The real effective exchange rate may rise because inflation is higher in the domestic economy than in trading partner countries.27 However, the real effective exchange rate may also rise (or fall) because of an increase (decrease) in the nominal effective exchange rate. A rise in the nominal effective exchange rate could, for instance, reflect an increased demand for local currency due to improvement in the country’s economic fundamentals (for example, increased productivity, an improved terms-of-trade, effective structural reforms, a lower cost structure, a lower trade deficit or higher savings). Consequently, before making a judgement in any particular case, it is necessary to estimate that level of the real effective exchange rate which is consistent with the country’s economic fundamentals: as earlier described, we call this the equilibrium competitive exchange rate. Armed with this estimate one can compare the actual real effective exchange rate with the estimated equilibrium competitive real effective exchange rate to determine if the actual real effect
ive exchange rate is undervalued or overvalued, or around its equilibrium competitive level.
Chart 3 indicates that some Pacific island countries had rising real effective exchange rates before the global economic crises developed and, based on IMF estimates reported in relevant published IMF Article IV Consultation Staff Reports, a number of countries experienced overvalued exchange rates during the crisis. The experience of some Pacific island countries - a tendency toward currency overvaluation and the potential for net capital outflow - stands in contrast to that of developing Asian countries which experienced currency undervaluation and, in some cases, excessive capital inflow.
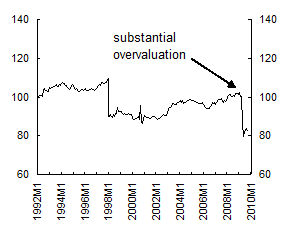
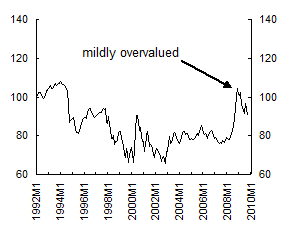
Chart 3: Real Effective Exchange Rates
Fiji
Papua New Guinea
Samoa
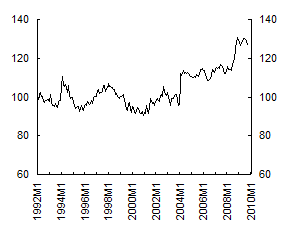
Solomon Islands
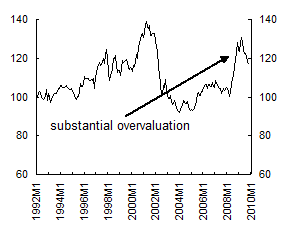
Tonga
Vanuatu
Source: International Monetary Fund, International Financial Statistics Database, 2010; relevant published IMF Article IV Consultation Staff Reports. The descriptors for overvaluation shown in the above charts are taken from the IMF Article IV Consultation Staff Reports. For Samoa there are no recently published estimates of any currency misalignment.
4.3 Fixed (pegged) exchange rates
Tonga, Samoa, Vanuatu, Fiji and Solomon Islands (all microstates)28 operate fixed (pegged) exchange rate regimes.
Solomon Islands has a de facto peg against the United States dollar. Other countries (Fiji, Vanuatu, Samoa and Tonga) peg their currencies to a basket of currencies of other countries. For example, the basket currencies for the Fiji dollar are those of Fiji’s major trading partners, Australia, New Zealand, the United States, the United Kingdom, Germany and Japan. For Samoa and Tonga there is a margin - a horizontal band - in the pegged arrangements that provides the opportunity for the authorities to move the exchange rate within the band. For Samoa the margin is plus or minus 2 per cent, while for Tonga the margin is plus or minus 5 per cent per month around the central rate.
Under a fixed exchange rate system the monetary authority maintains the pegged parity through direct intervention (that is, via sale/purchase of foreign exchange in the market) or indirect intervention (for example, via the use of interest rate policy, imposition of foreign exchange control regulations, import restrictions, moral suasion or through directives to other public institutions). For many Pacific island countries fixed (pegged) exchange rates, rather than monetary aggregates or specific inflation rate targets, have served as the inflation anchor29 during the global crisis period.
Fixed (pegged) exchange rate regimes are generally thought to be associated with lower transaction costs, greater certainty, lower real exchange rate volatility, higher trade openness, disciplined macroeconomic policies and relatively low growth of monetary aggregates, a better inflation performance30 and stronger inflation anchors. It has been argued that countries with pegged exchange rates may benefit from lower inflation and greater policy credibility if the country to which the peg is struck has low inflation.31
Output growth appears stronger in countries with fixed exchange rates if they are able to avoid a loss of competitiveness and currency overvaluation.32 This has not recently been the case for some Pacific island microstates.
During periods of general economic stability, pegged arrangements provide a stable exchange rate and low exchange rate risk - providing certainty for business and financial transactions, foreign investors, tourism and consumers. However, the international experience suggests that pegged exchange rate regimes are susceptible to currency overvaluation and higher current account deficits.33 When significant external account imbalances develop complications can occur: countries with pegged currencies have limited scope to operate independent monetary and fiscal policies34, as the settings of these policies are likely to be constrained by the need to defend the fixed (pegged) exchange rate. For example, the tightening of monetary policy for this purpose could impact adversely on domestic output growth and limit the capacity of monetary policy to respond to other external and internal economic shocks.
Defending the peg means also that large current account deficits are likely to persist and be slow to unwind.
The financial and banking sectors of Pacific island microstates are not highly integrated with international financial markets and, as a result, (and as mentioned earlier in the section on monetary policies), some Pacific island countries had a degree of immunity from the global financial crisis, as their cross-border capital flows are smaller and generally with lower volatility (than for countries that have a high intensity of international financial linkages). This relative separation from global financial developments and the relative stability of Australian commercial banks operating in Pacific island countries imply that there may be less volatility in foreign currency reserves and, on that account, less pressure for authorities in these island states to change their fixed (pegged) exchange rate systems.
However, some Pacific island microstates are linked to international financial market developments indirectly through their pegged exchange rate systems, particularly those island microstates that have pegged arrangements involving the United States dollar or the Australian dollar. During the global economic crisis international capital flows have become more volatile and large swings have occurred in the exchange rates of Australia and the United States which have been reflected in these pegged arrangements.
Generally, Pacific island microstates that have adopted35, or have their currencies pegged to, a single foreign currency or to a basket of foreign currencies that are appreciating, may suffer a loss of competitiveness against other countries. Those Pacific island microstates with currencies pegged to trade weigh
ted baskets of representative trading partner currencies reduce the risk that could arise if they were tied to a single foreign currency, the value of which moved in an opposite direction to that required by their own shocks and external and internal imbalances.
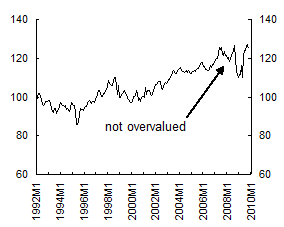
Under its transactions-weighted basket adjustable peg exchange rate regime, Vanuatu’s real effective exchange rate has been rising since 1996. Before 2002 GDP was unstable. From 2002 Vanuatu undertook a major structural reform of airline policy and this reform boosted the tourism sector. Tourism has been the main influence contributing to relatively strong economic growth since those reforms, including during the global economic crisis. The airline reform greatly improved Vanuatu’s economic fundamentals. Consequently, in the case of Vanuatu, one can imagine that the equilibrium competitive real effective exchange rate has most likely risen over the period since 2002 largely reflecting improved economic fundamentals. Vanuatu has not suffered from currency overvaluation during the past decade.
During the global economic crisis Vanuatu’s inflation rate was relatively subdued (see Chart 1) and moved broadly in line with inflation rates in trading partner countries, working to maintain real exchange rate competitiveness. The pegged exchange rate arrangement for the vatu has led to a relatively stable nominal effective exchange rate during the global economic crisis (the impacts of changes in the US dollar and the Australian dollar were largely offsetting) which has provided an anchor for inflationary expectations. The IMF notes36 that Vanuatu’s real effective exchange rate (competitiveness) has remained largely unchanged over recent years and was broadly in line with economic fundamentals at April 2009.
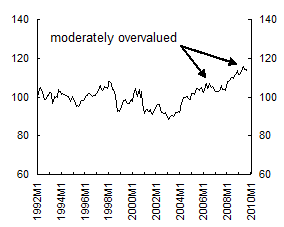
Tonga and Samoa have had rising real effective exchange rates from around 2002; and the Solomon Islands since 2004.
Tonga’s foreign currency earnings were substantially reduced during the global economic crisis by lower exports, remittances and tourism receipts. Available estimates suggest that Tonga had a moderately overvalued real exchange rate in 2008 and 2009.37 The National Reserve Bank of Tonga appears not to have devalued the exchange rate within the monthly adjustment band provided for within the exchange rate peg38 arrangement. Tonga’s external debt is around 45 per cent of GDP. Tonga’s current account deficit continues to deteriorate, and is expected to reach 20 per cent of GDP in 2010. Tonga’s external position remains fragile.
The IMF39 found that the Solomon Islands dollar40 was substantially overvalued (by around 26 per cent) in July 2009. As with Tonga, the Solomon Islands dollar has not been devalued during the global economic crisis. Solomon Islands current account deficit is expected to reach more than 30 per cent of GDP in 2010.
Samoa allowed the Tala to appreciate by 1.1 per cent within the band in 2008/09 to ease pressure arising from imported inflation41. Samoa’s real effective exchange rate moved upward in 2009 and has thus far remained at an elevated level42.
Fiji’s exchange rate became increasingly and substantially overvalued over recent years due in part to underlying structural problems in key export sectors, high inflation and because of the adverse impact on trade of the global economic recession. However, as Chart 3 reveals, the improvement in Fiji’s price competitiveness (the fall of the real effective exchange rate) in April 2009 reflects the 20 per cent devaluation of the Fiji dollar, and stands in contrast to the upward trend in real effective exchange rates in some other Pacific island countries. Since the devaluation the real effective exchange rate for Fiji43 has risen by 7.7 per cent, due in part to a higher rate of inflation in Fiji compared to inflation in major trading partners.44 This increase in the real effective exchange rate reflects a significant unwinding of the improved price competitiveness achieved by the 20 per cent devaluation in April 2009. It is unclear whether the Fiji dollar exchange rate remains overvalued and whether further downward adjustment in the exchange rate is warranted.
4.4 Managed floating exchange rate
Under Papua New Guinea’s managed floating exchange rate system the authorities may influence the path of the exchange rate taking into account, for instance, terms-of-trade developments, the level of foreign currency reserves, the likelihood of ‘Dutch disease’45 and internal policy objectives (for example, inflation, domestic investment and the need to moderate excessive volatility in government revenues arising from terms-of-trade changes).
Chart 4 illustrates the behaviour of the kina exchange rate, commodity prices and foreign currency reserves over recent years. Papua New Guinea’s foreign exchange reserves increased from kina 2 billion in early 2006 to a relatively high kina 6.5 billion in late 2008, a level far higher than that needed to provide cover for fluctuations in imports.46 However, the value of the kina and the real effective exchange rate both remained largely unchanged in 2007 and into 2008.
When commodity prices started to fall in late-2008 reserves fell by around 17 per cent, taking some pressure off the need for exchange rate adjustment at that time.
Chart 4: Papua New Guinea Terms-of-Trade, Reserves and Exchange Rates
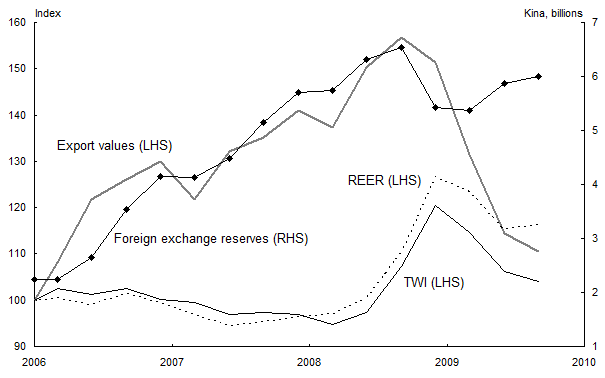
Source: Reserve Bank of PNG, Quarterly Economic Bulletin; International Monetary Fund, International Financial Statistics Database, 2010.
In early 2009 the IMF47 judged the kina to be mildly overvalued and recommended greater exchange rate flexibility. However, the authorities noted that, with inflation high, slowing the exchange rate adjustment was important for anchoring inflationary expectations. A short time later the nominal and real effective exchange rates did fall, most likely reflecting, in part, the effects of the decline in international commodity prices.
In summary, while structural weaknesses and lost trade preferences were strongly influential in Fiji and Solomon islands, it seems likely that some other Pacific island countries lost exchange rate competitiveness during the global economic crisis partly as a consequence of strong credit growth and high inflation (9.5 per cent for the Pacific island region in 2008) rising on the back of the food and fuel price surge. The inflation rates recorded for Pacific island countries exceeded the rates of inflation recorded in trading partner countries48. Inflation is expected to remain relatively high in Pacific island countries during 2010 (around 5 per cent) compared to inflation in major trading partner countries; Australia (2.5 per cent), New Zealand (2.3 per cent), the United States (1.7) and Japan (-1.1 per cent)49. Such developments,
if they come to pass, could provide further upward pressure on real exchange rates in some Pacific island countries during 2010.
23 The real exchange rate is often used as a measure of price competitiveness and its value derives entirely from changes in the nominal exchange rate and domestic and foreign inflation rates. The overall real competitiveness of a nation embraces a much wider set of parameters (than the exchange rate) that underpin a country’s capacity to be successful in international trade, including productivity, technology, delivery times and the skills of the labour force. It remains unclear to what extent, and at what speed, such developments in the real competitiveness of a nation come to be reflected in exchange rate changes.
24 The IMF uses three different estimation techniques to determine if an exchange rate is overvalued or undervalued: the macroeconomic balance approach, the equilibrium real exchange rate approach and the external sustainability approach. See IMF, ‘The Equilibrium Exchange Rate: Alternative Concepts and their Application to IMF Surveillance’, Background Document III, An IEO Evaluation of IMF Exchange Rate Policy Advice, 1999-2005.
25 See R. Hausmann, L. Pritchett and D. Rodrik, ‘Growth Accelerations’, NBER Working Paper, No 10566, July 2004. Also see P. Aghion, P. Barchetta, R. Ranciere and K. Rogoff, ‘Exchange Rate Volatility and Productivity Growth: The Role of Financial Development’, NBER Working Paper, No. 12117, March 2006.
26 This overvaluation is in contrast to the undervaluation reported for many Asian developing economies. See Asian Development Bank Economic Outlook 2010, ADB, April 2010, page 69.
27 The sharp surge in food and fuel prices in 2007 contributed to higher domestic inflation, a rise in the real effective exchange rate and a loss of competitiveness. Imports became more expensive, particularly food and fuel imports. To the extent that the rise in inflation is entirely due to the higher prices of imported food and fuel prices, the exchange rate competitiveness of export products and export services (that do not use imported food or fuel as inputs) will not be as adversely impacted as would otherwise be implied by the rise in the real exchange rate.
28 Papua New Guinea is not classified as a microstate, as its population is greater than 2 million persons.
29 Papua New Guinea, with a managed floating exchange rate regime, relies on monetary aggregates and exchange rates to anchor inflationary policies.
30 See A. Husain, A. Mody and E. Suss, ‘Exchange Rate Regime Durability and Performance in Developing Versus Advanced Countries’, Journal of Monetary Economics, 2005. Also, see A. Ghosh, A. Gulde, J. Ostry and A. Wolf, ‘Does the Nominal Exchange Rate Matter?’ NBER Working Paper, No. 5874, 2002. See A. Velasco, ‘Fixed Exchange Rates: Credibility, Flexibility and Multiplicity’, European Economic Review, 40, 1996.
31 On the inflation benefits see A. Ghosh and J. Ostry, ‘Choosing an Exchange Rate Regime’, Finance and Development, IMF, December 2009, Volume 46, No 4. Also, see ‘Exchange Rate Strategies for Small Island Developing States’, S. Vella, Bank of Valleta Review, No. 32, Autumn, 2005.
32 See R. Ghosh and J. Ostry, op cit. Rose has demonstrated that fixed exchange rates increase trade and investment substantially (see A. Rose, ‘One Money, One Market: Estimating the Effects of Common Currencies on Trade’, Economic Policy, 2000, 15(30). Note that there are studies which do not support the view that exchange rate stability leads to relatively higher economic growth.
33 See R. Ghosh and J. Ostry, op cit.
34 See IMF, ‘Choosing an Exchange Rate Regime’, Finance and Development, December 2009, Volume 46, No 4.
35 In the Pacific island region Kiribati, Tuvalu and Nauru have adopted the Australian dollar as their own legal tender. The Marshall Islands, Micronesia and Palau have adopted the US dollar. Niue, Tokelau and the Cook Islands have adopted the New Zealand dollar. In the case of Kiribati, for example, (Kiribati uses the Australian dollar as its currency), the real exchange rate increased sharply, by 43 per cent between mid-2007 and end-2009. This increase in the real exchange rate was due to the appreciation of the Australian dollar and to relatively high inflation in Kiribati. While Kiribati’s trade and payments with Australia have been largely unaffected (by the nominal exchange rate appreciation), Kiribati’s exchange rate competitiveness against other Pacific island countries, particularly Fiji (a major destination of Kiribati’s exports) where the exchange rate was devalued by 20 per cent in 2009, seems likely to have been adversely impacted. At the end of 2009 Kiribati’s real effective exchange rate is likely to have been well above long-term average levels.
36 See IMF, Article IV Staff Report, Vanuatu, April 16, 2009.
37 See relevant IMF Article IV Consultation Staff Reports.
38 See IMF, 2009 Tonga Article IV Consultation Staff Report, September 2009.
39 See Solomon Islands, IMF Article IV Consultation Staff Report, November 2009 and 2008.
40 IMF analysis suggests that the appreciation of the Solomon Islands dollar reflected the higher inflation rate in the Solomon Islands relative to inflation in the United States up until mid-2008. Subsequently, large swings in the US dollar vis-à-vis other currencies in the basket have become the main reason for the appreciation of the real effective exchange rate. See IMF, Solomon Islands: 2009 Article IV Consultation Staff Report, November 2009.
41 See Central Bank of Samoa, Monetary Policy Statement for the Financial Year 2009/2010, October 2009.
42 There are no recently published IMF modelling estimates for Samoa that could be used to determine the extent of any currency misalignment
43 In a recent study it was found that for Fiji a 10% devaluation increases output by around 2.3 per cent in the short-run and by 3.4 per cent in the long-r
un. See P. Narayan and S. Narayan, ‘Is Devaluation Expansionary or Contractionary? Empirical Evidence for Fiji’, Applied Economics, 2007, Vol 39.
44 See Reserve Bank of Fiji, Economic Review, Vol 27, No. 01, January 2010. Fiji’s inflation has moved higher since January 2010, suggesting a further rise in the real effective exchange rate.
45 Dutch disease may develop when a country appreciates the currency (in response to a boom in commodity exports) and non-commodity production and exports are adversely impacted.
46 It might be argued, however, that in a commodity producing developing country reserves need to be relatively high to cover volatility in exports and capital inflows. Foreign currency reserves are usually recorded as an asset on the central bank’s balance sheet. Beginning in April 2008 Papua New Guinea outsourced part of its foreign exchange reserves which is now managed by external fund managers. These externally managed funds are able to invest up to 10 per cent of their portfolios in triple-A rated corporate bonds having a higher modified duration (a measure of interest rate risk) of five years, compared with 2.5 years for the in-house managed funds. This policy is aimed at increasing returns on foreign exchange reserves. See B. Popoitai, Deputy Governor, Bank of Papua New Guinea, Presentation to the Sovereign Wealth Fund Joint Stakeholders Workshop, ‘Monetary Focus’, 2010.
47 See IMF, Papua New Guinea, Article IV Consultation Staff Report, April 2009.
48 In 2008, inflation rates for Pacific Island countries were Fiji (6.6 per cent), Solomon Islands (18 per cent), Samoa (8.8 per cent), Tonga (6.4 per cent), Papua New Guinea (11.2 per cent) and Vanuatu (5.8 per cent). By comparison, inflation rate in trading partner countries were much lower, including Australia (3.7 per cent), New Zealand (3.4 per cent), Japan (0.4 per cent), the United States (0.7 per cent) and Germany (1.1 per cent).
49 See IMF, World Economic Outlook Database, April 2010, and ADB, Asian Development Outlook 2010 Update. Also see Australian Budget Papers, May 2010.