In recent years monetary and exchange rate policies in Pacific island countries have been applied in response to a series of substantial external economic shocks - the sharp upsurge in international fuel and food prices (2007), the global financial crisis (2008) and the global economic recession (2009).1 As well, some Pacific island countries also experienced climate-related disasters and internal shocks - floods, cyclones, political difficulties and, for Samoa and Tonga, a major tsunami in late 2009.
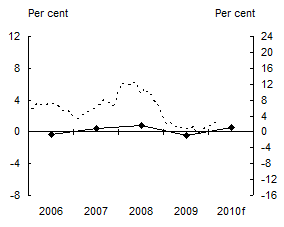
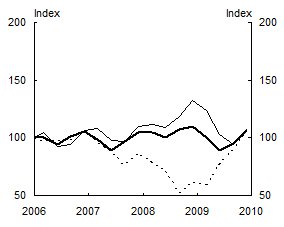
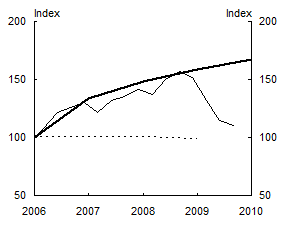
The economic performance of Pacific island countries during the global economic crisis has been mixed. Chart 1 illustrates changes in inflation and GDP, while Chart 2 shows levels of tourism, exports and remittances:
- Inflation moved higher in most Pacific island countries during 2007 largely as a consequence of the upsurge in global food and fuel prices and strong credit growth. The inflation rate reached 24 per cent in Solomon Islands in mid-2008. Inflation then fell back sharply and substantially in most countries, particularly so in Solomon Islands and Samoa. Inflation increased again in Fiji during 2009 as a consequence of the 20 per cent currency devaluation earlier in that year.
- Real GDP fell substantially in Samoa and Fiji and remained unchanged in Tonga. Real GDP growth slowed in other countries. Vanuatu and Papua New Guinea displayed very considerable resilience, both recording real GDP growth of around 8 per cent in 2009.
- Except for Samoa, the value of exports generally strengthened during 2008, strongly so for Vanuatu and Solomon Islands. However, reflecting the global economic recession, exports contracted substantially across most countries during 2009, falling by between 22 per cent and 37 per cent.
- Remittances were variable across countries, falling sharply in Fiji during 2008 but recovering during 2009. For Tonga, (where remittances are the equivalent of 36 per cent of GDP), the nominal value of remittances fell continuously, by 33 per cent through 2008 and 2009, due mainly to recessions in principal source countries, the USA (from where 60 per cent of remittances are derived) and New Zealand.
- Tourist arrivals fluctuated around a flat trend in Fiji but increased strongly in most other countries. Heavy discounting lowered earnings from tourism by 35 per cent for Fiji and Tonga.
- The upsurge in food and fuel prices (which raised import costs in most countries), the global economic recession, a loss of key export market preferences, and appreciating real exchange rates (see Chart 3) all impacted adversely on balance of payments positions. Papua New Guinea experienced terms-of-trade volatility.
Chart 1: Real GDP Growth and Inflation
![]()
Fiji
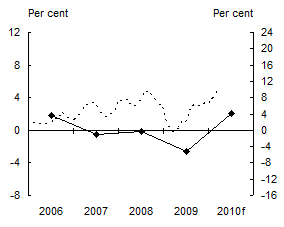
Papua New Guinea
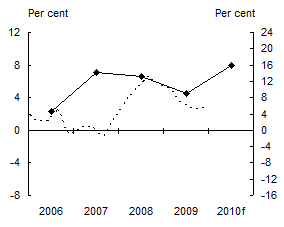
Samoa
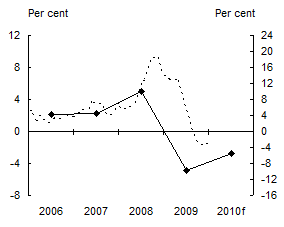
Solomon Islands
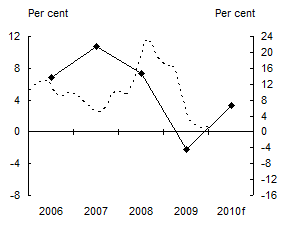
Tonga
Vanuatu
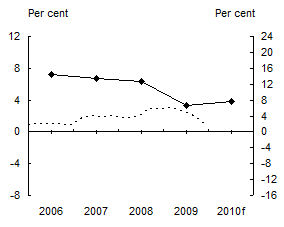
Source: All GDP growth estimates have been sourced from the IMF World Economic Outlook April 2010 Database. Inflation estimates have been drawn from: Reserve Bank of Fiji Economic Review, April 2010; Reserve Bank of Papua New Guinea QEB database; Solomon Islands National Statistics Office, Statistics Bulletin 2/2010; Tonga Department of Statistics, March 2010; Reserve Bank of Vanuatu, December 2009 Quarterly Review; IMF IFS database. All inflation estimates are year-on-year percentage changes. Solomon Islands inflation is a 3-month moving average year-on-year percentage change.
Chart 2: Remittances, Tourism and Exports
![]()
Fiji
Papua New Guinea
Samoa
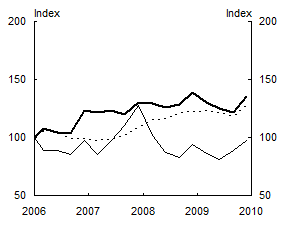
Solomon Islands
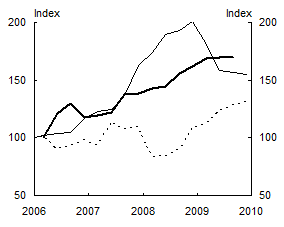
Tonga
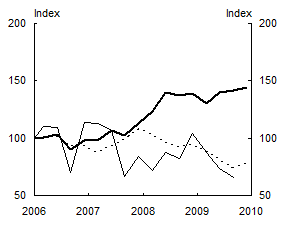
Vanuatu
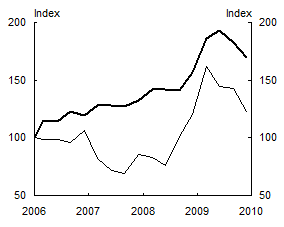
Sources: To reduce substantial short-term data volatility, all estimates are 3-quarter moving averages. IMF IFS database (Fiji exports, Samoa exports); World Bank staff estimates (PNG remittances); Central Bank of Samoa (all Samoa data); Central Bank of Solomon Islands, Quarterly Bulletin December 2009; National Reserve Bank of Tonga, Quarterly Bulletin December 2009; Reserve Bank of Fiji, Economic Bulletin January 2010 (Fiji tourist arrivals, 2009); ADB Pacific Monitor database (Vanuatu exports, Fiji tourist arrivals, 2006-2008); World Bank, EAP Update November 2009 (PNG tourist arrivals); Reserve Bank of Vanuatu, Quarterly Review December 2009 (Vanuatu tourist arrivals); Reserve Bank of Papua New Guinea, QEB database (PNG exports). PNG remittances and tourist arrivals data are annual. Comprehensive remittances data for Vanuatu are not readily available.
1 In this paper
all three shocks, the food and fuel price upsurge, the global financial crisis and the global economic recession taken together are referred to as the global economic crisis.