This section summarises key results produced by the long-term GDP projection framework.
Relative productivity
Relative productivity is projected to remain stable for advanced, Sub-Saharan Africa, and Latin America and Caribbean economies throughout the projection period (see Chart 4), while the relative productivity level of the Asian region is expected to more than double from around 15 per cent in 2012 to around 32 per cent by 2050. This is also the source of the rising relative productivity level of the broader emerging and developing region.
Chart 4: Relative productivity by region
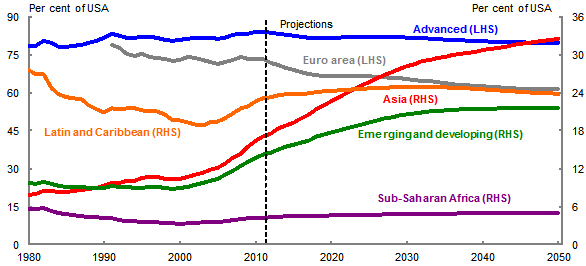
Source: Authors’ calculations.
Turning to countries within the Asia region, we see that China’s relative productivity level is expected to more than double from its current level of around 20 per cent to a little over 50 per cent by 2050 (see Chart 5). India’s relative productivity level is also expected to double over this period, albeit from a lower base of around 10 per cent.
Chart 5: Relative productivity — Asia

Source: Authors’ calculations.
Many of the countries in the Sub-Saharan Africa region are scattered above and below the lower-left segment the relative productivity-GCI curve (see Chart 3). Therefore, we expect the relative productivity level of the Sub-Saharan Africa region to rise slightly over the projection period from its current level of around 4 per cent to 5 per cent by 2050 (see Chart 6). Underlying this are modest improvements in the relative productivity of large countries in the region such as South Africa and Nigeria.
Chart 6: Relative productivity — Sub-Saharan

Source: Authors’ calculations.
At around 25 per cent of the US level, the current relative productivity level of the Latin America and Caribbean region is somewhat higher than that of the Sub-Saharan Africa region. Our analysis suggests there will be little improvement in the Latin America and Caribbean region’s relative productivity level over the next 40 years, as projected improvements in countries such as Brazil are expected to be offset by declines in other countries such as Argentina (see Chart 7).
Chart 7: Relative productivity — Latin American and Caribbean

Source: Authors’ calculations.
Regional transition paths
Table 3 highlights that emerging and developing economies have been the major driver of global economic growth over the last decade. This was particularly true for the years surrounding the global financial crisis, over which the advanced economies displayed, by their own historic levels, relatively weak growth. This pattern is expected to continue over the next two decades, with the emerging and developing region expected to grow at twice the average annual rate of the advanced region (largely due to Asia). Sub-Saharan Africa’s GDP is also expected to grow strongly over the projection period due to strong population growth.
World output growth is expected to slow from an average annual rate of around 4 per cent between 2010 and 2020 to an annual average growth rate of around 2 per cent between 2040 and 2050. Again, this largely reflects developments in Asia, with average annual Asian GDP growth expected to fall from 6.3 per cent to 2.3 per cent over the same time period.
Source: Authors’ calculations.
Unsurprisingly, the two countries driving the strong Asian region growth are China and India (see Table 4). The relative productivity level of these countries is expected to rise by roughly the same percentage (that is, they are expected to double) which implies their annual GDP growth rates will receive the same boost from growth convergence factors. In the case of India, the relative productivity
improvement is coming off a significantly lower base, so any further improvement in its growth convergence criteria that pushes its CGI closer to China’s would imply significantly stronger growth over the projection period.
Sub-Saharan Africa’s combined GDP is expected to grow at an annual rate of above 3 per cent over the projection period. Given the modest improvement expected in the region’s relative productivity, this in large part reflects strong population growth, with the region’s population expected to double over the next 40 years (see Table 5).
The growth prospects of Latin America and Caribbean region GDP are more modest than Sub-Saharan Africa’s. This reflects little expected improvement in the former’s relative productivity and its relative weak population growth (see
Source: Authors’ calculations.
Source: Authors’ calculations.
Source: Authors’ calculations.
Table 7 reports the long-term GDP projections of other agencies/institutions. The frameworks used by these institutions are similar to the approach presented in this paper, with GDP projections based on assumptions about the growth rates of the labour force and labour productivity. Treasury’s outlook for world output growth is broadly consistent with the expectations of these other forecasters over current decade (that is, 2010 to 2020). In contrast, Treasury’s long-term outlook of average annual world output growth is in the range of 2 per cent which is somewhat weaker than Goldman Sachs’ expectation of average annual growth of above 3 per cent.
Source: (a) Chen, et al. (2012), (b) Kuijs (2009), (c) Garnaut (2011), (d) Dadush and Stancil (2010), (e) Asian Development Bank (2011), (f) Wilson, et al. (2011), (g) Ward (2012), (h) PWC (2011), (i) BBVA(2012) and authors’ calculations.
Regional economic importance
Our analysis suggests that the economy of the emerging and developing region is currently larger than the economy of the advanced region (see Chart 8). This reflects the rapidly shifting weight of global economic activity to fast-growing economies of Asia. We project that Asia will become the world’s largest economic region by 2020. Underlying this is the expectation that the combined economies of China and India will become larger than the advanced economies by the middle of the 2030s. Chart 8 reveals that the rising global share of Asia will be offset by declining shares for both the advanced and Latin America and Caribbean regional economies.
Chart 8: Regional economic shares

Source: Authors’ calculations.
The re-emergence of China and India is particularly extraordinary due to the pace at which is it is occurring. According to Maddison (2010), during the Industrial Revolution, it took about 50 years for the United Kingdom to almost double its share of world output. Chart 9 shows that China doubled its share of world output in just over a decade from when it began its market oriented reforms in 1978. Moreover, in the thirty years since reforms began, China’s share of world output has increased almost eight-fold. Similarly, India began its wave of reforms in the early 1990s and doubled its share of world GDP in under two decades.
Chart 9: Regional economic shares — Asia
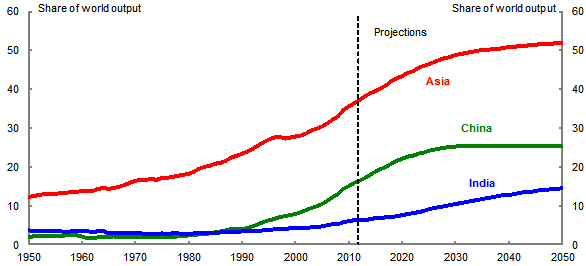
Source: Authors’ calculations.
The sub-Saharan African region’s share of world output is currently around 2 per cent. We expect this share rise to 3.5 per cent by 2050 (see Chart 10). Nigeria and South Africa are expected to be the major single economies of the Sub-Saharan Africa region over this period, with Nigeria’s importance rising steadily in the region from 0.5 per cent of world GDP today to just under 1 per cent by 2050.
Chart 10: Regional economic shares — Sub-Saharan Africa
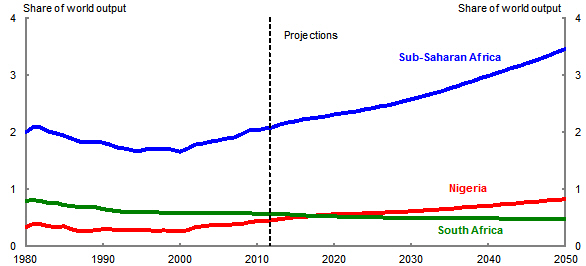
Source: Authors’ calculations.
The Latin American and Caribbean region is expected to grow at a slower pace than world output, which implies its share of world output will decline from around 8 per cent in 2012 to 6.5 per cent in 2050. Chart 11 shows that the region’s projected global share path is consistent with its trend over the past 30 years.
Chart 11: Regional economic shares — Latin America and Caribbean

Source: Authors’ calculations.
Source: Authors’ calculations.
Table 8 reports the ranking of individual economies according to their share of world output. China is expected to be the world’s largest economy by 2030 followed by the US and India. Indonesia is on track to become the fourth largest economy by 2050, which implies the four of the five largest economies in the world will be in Asia.