Empirical growth model
It is important to note that the conditional convergence model outlined above provides a framework for studying transitional dynamics over long time horizons. As such it abstracts from short-run cyclical or business cycle fluctuations. This is factored into the projections by assuming that the data have identifiable cyclical and trend components:
![]()
Empirical estimates of cyclical productivity are generated using the following auto-regressive model, where 0<ρ<1:
![]()
Following the growth literature the US has been chosen as the reference country, which implies the following error correction model for the trend productivity component:
![]()
The final adjustment to the theoretical model is the addition of an acceleration term (that is, lagged productivity growth) to offset the approximation error introduced by linearisation, which implies a more general error correction model:
![]()
where 0<γ<1.
Labour augmenting technical change is assumed to grow in the long run at a constant rate δ, which implies the following relationship for US trend productivity growth:
![]()
Finally, GDP growth projections are derived using working age population growth rate projections:
![]()
where yit is country i output at time t and nit is country i labour input at time t.
Parameter estimation/calibration
Growth rate of labour-augmenting technological progress (δ)
The annual growth rate of US trend productivity (δ) is assumed to be 1.7 per cent. This assumption is based on forecasts of annual US productivity growth over the period from 2012 to 2022 published in Congressional Budget Office (2012).
Relative steady-state productivity(ξi)
There is a vast empirical literature devoted to the study of conditional convergence. This literature has uncovered a number of institutional factors that are correlated with a country’s relative productivity. Using insights from this literature, a set of 66 countries was identified in the broader sample of 155 countries as being near or at their relative US steady-state productivity level.7F8 A common empirical observation for this set of countries was that their relative productivity has been roughly constant over the past two decades. The ξi for this set of the countries is assumed to be their 2011 level of relative US productivity.
Establishing ξi for the remaining 89 countries is somewhat more challenging. Even with the benefit of a large amount of research in this area, it is a challenge to determine (and compile the data for) the factors that should be used in assessing each country’s relative steady-state productivity. We circumvent this problem by relying on growth analysis conducted by the World Economic Forum (WEF). In particular, the WEF publishes an annual Global Competiveness Report that analyses the factors underpinning productivity performance, which is summarised by its Global Competitiveness Index (GCI). The GCI provides a score of the competiveness of countries based on over 100 indicators that, theoretically and empirically, have been shown to be important in determining a country’s productivity (see, Sala-i-Martin and Artadi, 2004, and WEF, 2012, for more details).
We use the WEF’s GCI scores and the relative productivity estimates of the previously identified 66 near steady-state countries to estimate the relationship between relative steady-state productivity zi* and the GCI. Non-parametric techniques (kernel regressions) are employed to avoid having to make strong structural or parametric assumptions about the relationship between the GCI and zi*. The relative steady-state productivities of the remaining 89 countries are then predicted using each country’s GCI score and the estimated relationship. The kernel regression used to estimate the relationship between ξ and GCI is:
where m is the number of near steady-state countries, ![]() , ξj is the ratio of each country’s productivity to the US, h is the estimation bandwidth and
, ξj is the ratio of each country’s productivity to the US, h is the estimation bandwidth and ![]() is a Gaussian kernel. The choice of the bandwidth can affect the estimates in a non-trivial manner. Larger values of h will lower the variance of the kernel estimates but potentially increase the bias (see Pagan and Ullah, 1999, for a more extensive discussion). We minimised our choice of h subject to the constraint that the relationship between z* and GCI is monotonically increasing.
is a Gaussian kernel. The choice of the bandwidth can affect the estimates in a non-trivial manner. Larger values of h will lower the variance of the kernel estimates but potentially increase the bias (see Pagan and Ullah, 1999, for a more extensive discussion). We minimised our choice of h subject to the constraint that the relationship between z* and GCI is monotonically increasing.
Chart 2 shows the estimated relationship between the relative productivities of the 66 countries that are at or near steady state and their GCI. This regression line implies there are two critical GCI scores: GCIs below 3.8 are associated with low relative productivity and modest gains in productivity for an increase in GCI; GCIs above 4.8 are associated with relatively high productivity and modest gains in productivity for an increase in GCI; and for GCI’s between 3.8 and 4.8 small increases in GCI imply a significantly higher relative productivity.
The WEF does not publish GCI estimates for 23 economies of the 155 of the countries under study. We circumvent this problem by using the Worldwide Governance Indicators (WGI) published via World Bank (2012) to derive an equivalent GCI value. The WGI is chosen as there is some overlap in the sets of institutional factors covered by each index. Specifically, the six dimensions of the WBGI include: voice and accountability; political stability and absence of violence/terrorism; government effectiveness; regulatory quality; and rule of law and control of corruption. Consistent with this overlap, we find a fairly close correlation between the GCI and WGI. On this basis, a WGI to GCI mapping equation is estimated for the 132 available economies by a simple linear regression of GCI on WGI and a constant:
![]()
The estimated relationship is then used to map from WGI to GCI for the 23 economies that do not have GCI scores. The results of the regression are presented in Appendix C.
Chart 2: Estimated relationship between relative steady-state productivity and the WEF’s global competitiveness index
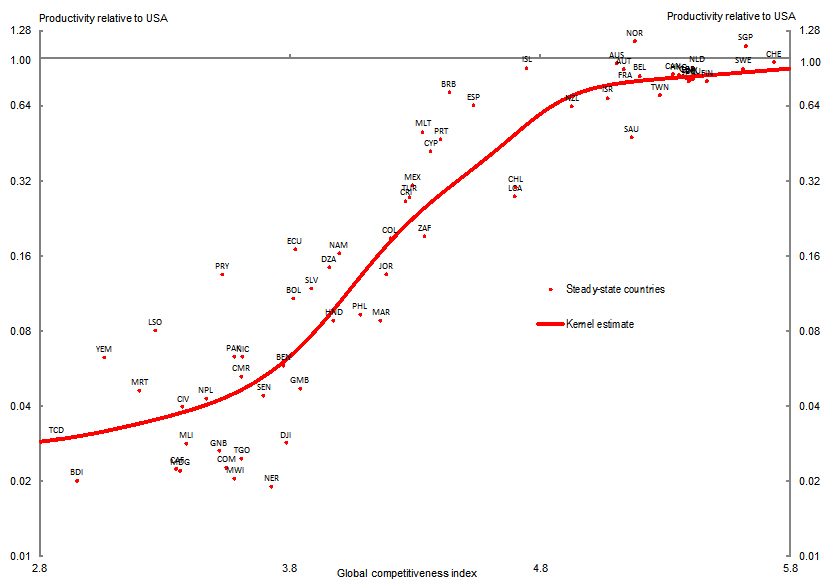
Chart 3: Current versus steady-state relative labour productivity
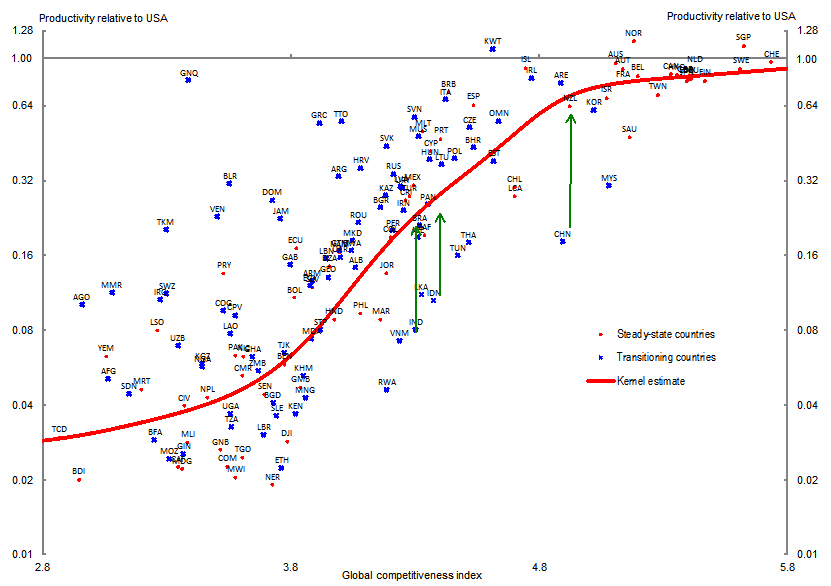
Chart 3
plots the level of 2011 relative productivity against the GCI for all countries under study, along with the estimated relationship between steady-state relative productivity and GCI. A number of countries have current levels of relative productivity that lie well below their expected steady-state level. For example, India, Indonesia and Vietnam (highlighted by green arrows) currently have productivity levels around 10 per cent of the US level and are expected to have a steady-state level of around 20 per cent of US productivity level. There are several countries that currently lie well-above their expected steady-state relative productivity. Most of these countries are located in the Middle East and North African region (see Appendix B for complete list), with rich natural resources such as oil. Our analysis suggests that growth convergence factors summarised by the GCI will be a constraint on their long-term growth prospects.
Speed of convergence (β)
The speed of convergence, β, depends on long-run technology and preference parameters, which are assumed to be common to all countries. Under this assumption the speed of convergence can be identified from panel regressions across all countries where each country’s transitional dynamics are captured by equation (2). Empirical studies that follow this approach, such as Barro (1991), Barro and Sala-i-Martin (1992 and 2004), Barro, Sala-i-Martin, Blanchard, and Hall (1992) and Mankiw, Romer and Weil (1992), find that countries converge on average at an annual rate of around 2 per cent. Consistent with these studies, we assume a speed of convergence of 2 per cent for all economies.
In the case of China, whose current level of relative US productivity is around 20 per cent, a convergence rate of 2 per cent implies it will reach a relative productivity level of just over 50 per cent of the US by 2050, which is still well below its expected steady-state value of around 70 per cent.
Growth acceleration (γ)
The linearised model summarised in (2) assumes a fixed speed of convergence. Barro and Sala-i-Martin (1992 and 2004) show that the exact speed of convergence is a decreasing function of the distance from the balanced growth path. This is captured in the empirical model by the acceleration term (![]() ) which is calibrated to be 0.5.
) which is calibrated to be 0.5.
Cyclical productivity (ρ)
Historic labour productivity data are de-trended using the Hodrick-Prescott (HP) filter, with a λ of 6.25 which is consistent with the recommendations of Baxter and King (1999) and Ravn and Uhlig (2002). The cyclical components generated by this filter imply ρ is equal to 0.65.
8 See Appendix B for the list of countries determined to be at their steady-state productivity ratio.