Overview
The Australian Government’s current fiscal position is strong, by both historical and international standards. The Government has eliminated net debt and is continuing to strengthen its balance sheet by running budget surpluses and provisioning for unfunded liabilities in the Future Fund. However, demographic and other factors are projected to place significant pressure on government finances over the longer term.
The spending projections in this report suggest that, in the absence of policy adjustments, Australian Government spending will rise by around 4 per cent of GDP by 2046-47. Health, age pensions and aged care account for most of the projected rise in spending. While an ageing population is projected to contribute to an increase in spending, a large part of the spending pressure is due to other factors, particularly for health.
Overall, both nominal and real spending per person in IGR2 are projected to increase by slightly less than in IGR1. However, IGR2 projects a higher level of nominal GDPperperson. As a result, spending as a proportion of GDP is projected to be lower than in IGR1.
Despite higher nominal GDP per person, governments still will need to make policy adjustments to maintain sound government finances. Under the assumption that revenue remains constant as a proportion of GDP from the end of the current forward estimates period, the projections in this report suggest that spending will exceed revenue by around 3 per cent of GDP by 2046-47. This is less than projected in IGR1, due to a lower rate of growth of projected spending per person and higher projected nominal GDP per person which is predominantly attributable to the recent strong rise in the terms of trade. Nevertheless, the projections in IGR2 imply a deterioration in the government’s balance sheet in the long term, with net debt re-emerging by the mid 2030s, and continuing to rise rapidly thereafter.
Such a path for net debt would not be sustainable. Accordingly, future governments will need to develop new strategies that encourage growth and promote the efficiency and effectiveness of government spending, particularly in areas with a high degree of public provision.
Spending pressures
Projections for Australian Government spending over the next 40 years are based on the projections of long-term demographic and economic growth trends outlined in Part 2, as well as other factors which are expected to affect spending. As the future is uncertain, these projections should be read as indicating a possible future path of spending based on reasonable assumptions.
This report emphasises the pressures that demographic and other factors are likely to impose on future government spending.
Over half of Australian Government spending is directed to health and aged care, payments to individuals, and education. This spending is sensitive to demographic change. The projections in this report show that spending on health, aged care and payments to individuals is likely to grow both in real per person terms and as a proportion of GDP over the next 40 years. While spending on education also is projected to rise in real perperson terms, it is projected to fall slightly as a per cent of GDP.
Other areas of Australian Government spending, such as defence, climate change, and the environment more generally, do not have a clear link with demographic factors. Further, spending in many of these areas is variable and highly dependent on discretionary government decisions. Consequently, other spending is assumed to grow at the same rate as growth in the economy over the next 40 years. This allows for spending to increase as a proportion of GDP in some areas and decline in others.
Health
Australians’ life expectancies are among the highest in the world. In relative terms, Australia’s health outcomes are achieved at a moderate cost, with total health spending as a share of GDP currently around the average for OECD countries.
Health care services are funded and provided by both the public and private sectors. The Australian Government provides almost half of the total health spending for Australia, and is the major source of public funds, although State and Territory governments also fund health services and have responsibility for public hospitals.
Major health programmes funded by the Australian Government include the Medicare Benefits Schedule and the Pharmaceutical Benefits Scheme.
The Medicare Benefits Schedule provides patient subsidies for medical practitioner services, optometry, diagnostic imaging and pathology. The Medicare Benefits Schedule forms the core of Medicare — the Australian Government’s universal health programme.
Under the Pharmaceutical Benefits Scheme, the Australian Government subsidises a wide range of pharmaceuticals to provide patients with affordable access to necessary and cost-effective medicines. New procedures, tests and pharmaceuticals are added to the list of those which receive subsidies under the Medicare Benefits Schedule and Pharmaceutical Benefits Scheme following government approval of the recommendations of the relevant advisory bodies.
In addition to the Medicare Benefits Schedule and Pharmaceutical Benefits Scheme, the Australian Government:
- makes a major contribution to the funding of public hospital services provided by State governments;
- provides a 30 per cent rebate to subsidise the cost of private health insurance, with higher rebates available for older Australians;
- provides financial support in other areas, including medical research, public health, indigenous health services, health information management and access, health safety and quality, and medical workforce development and infrastructure; and
- provides health care services to veterans via White and Gold Card arrangements.
Key trends and drivers
Since the early 1970s, Australian Government spending on health care has increased from around 1.5 per cent of GDP to around 4 per cent of GDP (Chart 3.1). After fluctuating significantly throughout the 1970s and 1980s, spending has been on a steadily rising path since the early 1990s.
Since IGR1, health spending as a proportion of GDP has grown relatively modestly, with solid increases in nominal health spending being partially offset by unusually strong growth in nominal GDP.
Chart 3.1: Historical Australian Government health spending
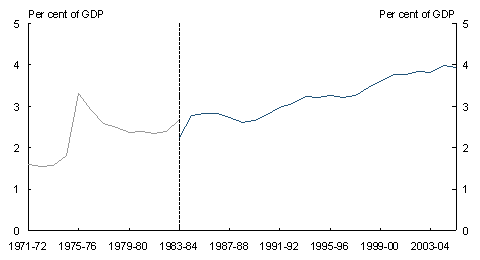
Note: Includes high-level residential care spending until 1983-84.
Source: Australian Institute of Health and Welfare health spending data base, Australian Bureau of Statistics Cat. No. 5204.0. Modelling is based on different data series (see Appendix C).
Non-demographic growth, rather than population growth or changes in the age structure of the population, has been the key driver of real health spending over the past two decades (Table 3.1). Non-demographic factors (such as the listing of new medications on the Pharmaceutical Benefits Scheme and greater use of diagnostic procedures) are likely to continue to generate the greatest cost pressure in the future.
Table 3.1: Real growth rates for Australian Government health spending
(per cent)

Note: Represents average annual growth using data from the start and end of the period. This is different to the calculation of growth rates for the projections, where growth rates are calculated from a fitted trend in the historical data to take account of the information
in all data points.
Source: Australian Institute of Health and Welfare health expenditure data (excluding high-level residential care) and Treasury estimates.
Technological change, including the development of new drugs, accounts for a significant proportion of non-demographic growth in health spending perperson. As the Australian Government exercises significant controls over whether to adopt new technology in the health system, past increases in spending partly reflect the Australian Government’s choice to fund new technologies.
Assumptions and methodology
Projections of health spending over the next 40 years are based on trends in the cost of health services per head of population by age and gender, combined with projected population changes.
Different components of the health system have exhibited different forms and rates of growth in the past. For example, over the last decade real per person growth in Australian Government spending on public hospitals has averaged 2.3 per cent, while real per person growth for medical benefits has averaged 2.7 per cent. Non-demographic growth in both these expenditure areas has followed a largely linear trend. Spending per person on older people is growing faster than for the total population, with the highest growth rates being for those aged 55 and over.
By contrast, while it has slowed in recent years, spending on pharmaceutical benefits has been growing at a rapid rate. Real non-demographic growth for pharmaceutical benefits has averaged 5.4 per cent per year over the last decade.
To capture the effects of these differences, the modelling used in this report separately projects the main components of health spending to allow for different growth rates for medical benefits, pharmaceutical benefits, private health insurance, hospitals and other health spending (see Appendix C).
Since IGR1, refined projection methodologies incorporate new data and modelling approaches. While variation remains across the components, overall the changes result in lower projected health spending. Major changes in methodology include:
- extending the scope of the Pharmaceutical Benefits Scheme model to include all pharmaceutical benefits (including the Highly Specialised Drugs Program), and gradually reducing the non-demographic growth rate for pharmaceutical benefits over the projection period;
- projecting non-demographic growth as a linear trend for medical benefits and hospital spending to align more closely projections with historical trends; and
- applying an historical non-demographic growth rate to private health insurance projections due to greater data availability.
Projections
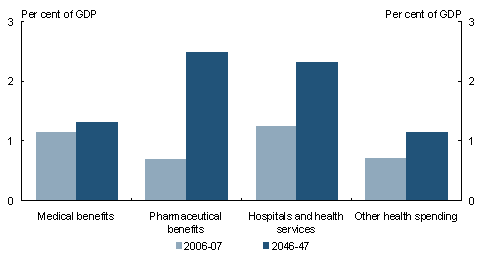
Australian Government spending on health is projected to increase as a proportion of GDP from 3.8 per cent in 2006-07 to 7.3 per cent in 2046-47.
Of all the components of Australian Government health expenditure, spending on pharmaceutical benefits is projected to grow the fastest. As a proportion of GDP, pharmaceutical benefits are projected to grow, from 0.7 per cent of GDP in 2006-07 to 2.5 per cent of GDP in 2046-47. Spending on hospitals and private health insurance as a proportion of GDP is expected to grow by over 80 per cent, with medical benefits spending growing only marginally as a proportion of GDP (Chart 3.2). Further details on the projections are given in Appendix A.
Chart 3.2: Projected Australian Government health spending
Source: Treasury projections.
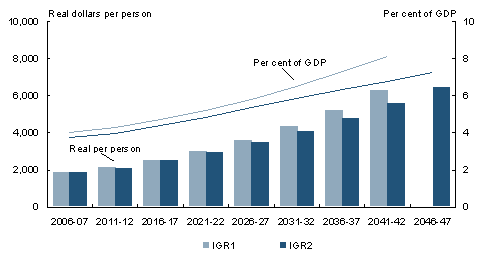
Overall, projected health spending is lower than in IGR1 (Chart 3.3). Projected real health spending per person is similar to IGR1 over the next 20 years, while higher projections of nominal GDP per person in IGR2 over this period result in lower projections of health spending as a proportion of GDP. After around 2026-27, lower growth in real spending per person (largely resulting from new data and refinements to modelling methodologies) combined with higher nominal GDP per person further reduces health spending as a proportion of GDP compared with IGR1.
Chart 3.3: Comparison of IGR1 and IGR2 projections of
Australian Government health spending
Source: Treasury projections.
The Government has made changes to improve the sustainability of health spending. The 2002-03 Budget proposed an increase in patient co-payments and safety net thresholds to help restore the balance between Government and patient contributions to the PBS and this was included in IGR1 projections, although the legislation was not passed until 2004. Recently announced reforms reduce the costs to the Government of generic medicines while maintaining the price caps to patients. The reforms are estimated to save the PBS $3billion over 10years. They will assist in improving the sustainability of the PBS and create ‘head room’ for financing the provision of new drugs and treatments that emerge in future years.
As noted above, non-demographic growth has been the key driver of real health spending over the past two decades. The projections continue this trend, with ageing contributing only around one quarter of the projected increase in health spending over the next 40years. Factors other than ageing account for the remaining three-quarters of the projected increase in health spending.
Reflecting the importance of non-demographic factors in the overall result, the projections for health spending are sensitive to the non-demographic growth rate. Alternative modelling scenarios for the health projections are discussed in Appendix C.
Aged care
The Australian Government provides funding for residential aged care and a range of community care services. Australian Government aged care spending is estimated to be 0.8 per cent of GDP in 2006-07. State and Territory governments and individuals receiving care also contribute to the total aged care spending which is currently around 1.1per cent of GDP.
The major aged care services funded by the Australian Government are:
- residential services, classified as high-care (previously nursing home care) or low-care services (previously hostel care); and
- community care services, which include Home and Community Care (HACC) programme services, the Community Aged Care Package (CACP) programme, the Extended Aged Care at Home (EACH) programme and Veterans’ Home Care (VHC).
Key trends and drivers
A dominant influence on future levels of Australian Government aged care spending is the number of people over the age of 80, as this age group are the major users of formal aged care services. The proportion of 80-year-olds in the Australian population is expected to almost treble over the next 40years, and this substantial increase will exert considerable pressure on aged care spending.
Other factors that impact on future government aged care spending include:
- changes in the average cost of care per person;
- future disability levels within the aged population;
- the mix between residential care and care in the community;
- the government’s planning rules specifying the number of aged care places as a proportion of the population aged 70 and over; and
- changes in the proportions funded by government and through private contributions.
Assumptions and methodology
Projections of aged care spending over the next 40 years are based on current expenditure per person for those receiving aged care services (indexed for growth in costs) combined with th
e projected number of older people. In essence, the projection combines base participation rates by age and gender for the main aged care programmes with projected population by age and gender. Together with assumed growth in the average (government) cost per participant, this provides a base projection. The model also takes into account the other key factors outlined above, such as changes in the mix between residential and community care and the growing real income and wealth of participants, which increases the private contributions to aged care costs.
The projection method is broadly similar to the one used in IGR1 but extends the range of the factors explicitly modelled. It is an adaptation and extension of the aged care model used in the 2005 Productivity Commission report on ageing. Further details on underlying assumptions for growth in unit costs and factors influencing participation in government aged care programmes are discussed in AppendixC.
Projections
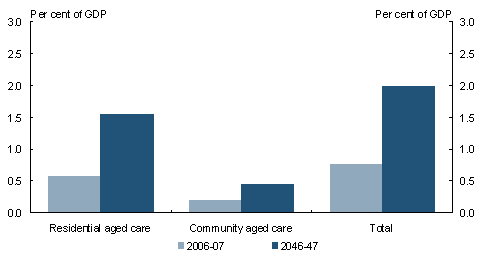
Australian Government spending on aged care is projected to increase as a proportion of GDP from 0.8 per cent in 2006-07 to around 2.0 per cent in 2046-47. This is due largely to increases in spending on residential aged care, which is projected to rise from 0.6percent of GDP to around 1.5 per cent in 2046-47 (Chart 3.4). These projections are broadly similar to those obtained by other recent studies of aged care in Australia. Further details on the projections are given in Appendices A and C.
Chart 3.4: Projected Australian Government aged care spending
Source: Treasury projections.
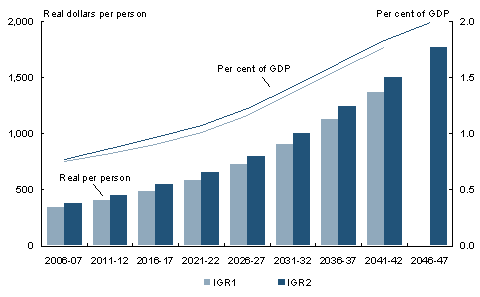
Projections of real per person aged care spending in IGR2 are consistently higher than projected in IGR1. This is due to declining mortality which has raised the proportion of the population aged 80 and over higher than anticipated in IGR1, as well as policy changes since IGR1. These projections incorporate the Government’s responses to the Hogan Report announced in the 2004-05 Budget and in February 2007 to address long-term issues in the residential aged care sector. The packages included additional spending on community and residential aged care, fairer income testing, additional workforce training, and measures to ensure that quality care is provided. As GDP perperson is also projected to be higher in IGR2, projected aged care spending as a proportion of GDP is only slightly higher than in IGR1 (Chart 3.5).
The current projections of growth in real spending per person can be decomposed into components due to the ageing of the population and all other components causing real spending per person to rise, such as costs being driven by wages rather than CPI and rising expectations and standards (the non-ageing effect). As expected, ageing is the primary driver of aged care spending over the next 40 years accounting for around three-quarters of the projected increase in real spending per person.
Chart 3.5: Comparison of IGR1 and IGR2 projections of
Australian Government aged care spending
Source: Treasury projections.
Payments to individuals
The Australian Government has in place a range of programmes for individuals requiring support or supplementary assistance. Payments to individuals are estimated to be around 6.7 per cent of GDP in 2006-07 and represent around one-third of total Australian Government spending.
Key trends and drivers
Australian Government payments to individuals fall across three broad groups: assistance to the aged; assistance to those of workforce age; and assistance to families with children. These payments are sensitive to changes in population levels and age structure. Payments are also sensitive to changes in consumer prices or wages depending on indexing arrangements.
Assistance to the aged
Assistance to people older than usual workforce age includes the Age Pension and similar payments to veterans and war widows. These payments are estimated to be around 2.5percent of GDP in 2006-07.
The Age Pension currently provides income support to men aged 65 and over and women aged 63 and over. The eligibility age for women is being increased gradually so that by 2013 it will align with that for men. The Age Pension is means-tested on both income and assets and does not depend on previous labour force experience or individual contributions. The age service pension provides a similar income support payment to veterans, and is available five years earlier than the Age Pension.
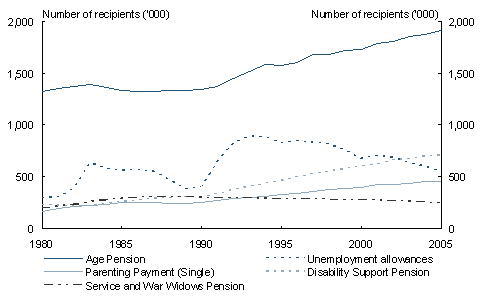
Between 1980 and 2005, the total number of age pensioners increased from 1.3 million to over 1.9 million (Chart 3.6). This mainly reflects growth in the eligible population, partly offset by an increase in the proportion of the population ineligible to receive a pension because of the means tests and the rising pension age for women. The number of service pensioners and war widow pensioners had been relatively stable at around 300,000 for some time but has started to decline.
Spending on age pensions in the future will continue to be driven by the size of the population in the eligible age range as well as future need. While the proportion of people of eligible age in the total population is projected to double by 2046-47, this is expected to be partly offset by a continued decline in the coverage rate due to the increased value of individuals’ superannuation and other private assets and income (see Appendix C). Accordingly, the proportion of pensioners receiving a full age pension is projected to decline, while the proportion with a part age pension will increase significantly; the proportion of the eligible age group not receiving any age pension is projected to rise slightly.
Chart 3.6: Numbers of recipients of major payments to individuals
1980to2005
Source: Department of Families, Community Services and Indigenous Affairs, various years and Department of Family and Community Services Income Support Customers — a Statistical Overview, various years.
Assistance to those of workforce age
The main payments to people of workforce age are Newstart Allowance, Youth Allowance (YA) for unemployed youths, Disability Support Pension (DSP), and Parenting Payment Single (PPS), previously known as Sole Parents Pension. Projections of these payments were included in IGR1. Parenting Payment Partnered (PPP), Austudy, Youth Allowance (student), Carer Payment and Wife Pension have also been projected for IGR2.
Payments for people of workforce age are means-tested, and are estimated to be around 2.3 per cent of GDP in 2006-07. Where appropriate, people on these payments are required to seek work or undertake training. This report projects the costs of these payments to individuals, but not the cost of job search support or training services.
The Welfare to Work reforms which came into effect on 1 July 2006 introduced changes to the income support system for those of working age. The policy changes are designed to both lift workforce participation and reduce welfare dependency. Under the changes, eligibility requirements for the DSP and Parenting Payment were tightened, recognising that many people have the capability to work part time. These policy changes are likely to have an impact on recipient numbers of Newstart Allowance
, Parenting Payment and the DSP over time.
A key determinant of the number of people receiving Newstart Allowance is the state of the economic cycle (as seen in Chart 3.6). Sustained economic growth over many years has seen the unemployment rate drop, with a corresponding drop in the number of Newstart Allowance customers.
The number of PPS customers has continued to increase since IGR1. Under the Welfare to Work policy changes, new applicants for Parenting Payment will be subject to an obligation, based on their capacity, to seek part-time work when their youngest child turns six. For new customers to be eligible for Parenting Payment they must have a child aged less than six if they are partnered and under eight if single. New customers who have older children will need to apply for a different payment — for most principal carers this will be Newstart Allowance. New Parenting Payment customers will need to change to Newstart Allowance when their youngest child reaches a non-qualifying age, while customers who were granted Parenting Payment prior to 1 July 2006 can remain on Parenting Payment until their youngest child turns 16. Over time, these changes will reduce the number of people on Parenting Payment.
The coverage trend in DSP recipients has flattened out since 2002, except for women aged 60-64 where the rise in female age pension age has had an effect. Under the Welfare to Work reforms eligibility criteria for the DSP have been tightened, and new applicants will be eligible for the DSP only if they are unable to work 15 hours per week at award wages. The previous criterion was based on being unable to work 30 hours per week. Due to the eligibility changes, the number of DSP customers in the future is expected to decrease.
As a consequence of the Welfare to Work initiatives, the number of people on Newstart Allowance is expected to increase; however, this should be offset by reductions in Parenting Payment and DSP customers. A softening in the Newstart Allowance income test is expected also marginally to increase the number of part-rate Newstart allowees. Consistent with the intent of the Welfare to Work changes, the total number of these clients is expected to decrease over time as people move off payments and into employment.
Assistance to families
Family payments provide assistance to families with children, with higher assistance provided to families with lower incomes. The payments modelled in this report include Family Tax Benefit Part A (FTBA) and Family Tax Benefit Part B (FTBB), which were also modelled in IGR1, as well as Child Care Benefit (CCB) and Maternity Payment.
FTBA, FTBB, and CCB have been in existence in their current form only since July 2000. However, the level of assistance for FTBA and FTBB has increased significantly since then. Payment rates and income test thresholds have increased over this period, with tapers being reduced. The key driver for projections of coverage for FTBA and FTBB is assumed to be the number of children aged 15 and under. Maternity Payment is projected using the projected number of births. Two key drivers for CCB are the number of children and the number of women in the labour force. As female labour force participation increases, demand for child care also increases.
Methodology and assumptions
Projections for Newstart Allowance, Youth Allowance, Austudy, PPP, PPS, DSP, Wife Pension and Carer Payment use recent trends in coverage by age and gender for that payment, adjusted for any recent policy initiatives, and project the average cost per customer using the legislated indexation arrangement for that payment.
Projections of age pensions use a more comprehensive methodology using Treasury’s RIMGROUP model which incorporates increasing population numbers, changes in labour force experience and the higher retirement incomes of Australian retirees as the superannuation system matures. The projections also incorporate the asset test taper reduction from the Government’s new policies to simplify and streamline superannuation. Increases in individual superannuation benefits restrain the growth of Australian Government spending on age pensions over time. More detail on the projection approach is in Appendix C.
Projections
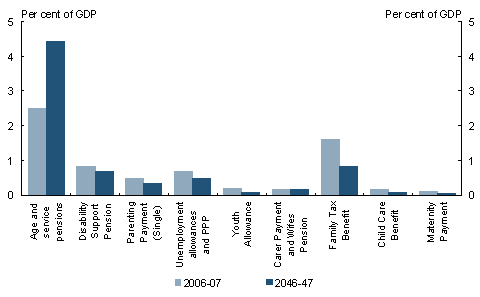
Australian Government payments to individuals are projected to increase as a proportion of GDP from 6.7 per cent in 2006-07 to 7.1 per cent in 2046-47. This is due to an increase in spending on age pensions which is projected to rise by 1.9 per cent of GDP by 2046-47, partially offset by a decrease in other payments to individuals (Chart3.7).
The projected decrease in other payments to individuals reflects the relatively lower proportions of the population in the relevant age groups, Welfare to Work policy initiatives, and the policy of indexing allowances and some components of family payments to consumer prices. Further details on the projections are given in Appendix A.
Chart 3.7: Projected Australian Government payments to individuals
Source: Treasury projections.
While the projected increase in spending on age pensions as a proportion of GDP is substantial, it is relatively low compared with most other OECD countries. Australia is comparatively well placed in relation to age pension spending because the pension is means-tested and targets poverty alleviation. By comparison, many OECD countries pay age pensions according to pre-retirement individual earnings, resulting in greater fiscal pressure as their populations age. In response to such pressures, many OECD countries have moved to indexing pensions by rises in the cost of living rather than linking to wages growth as in Australia. Further, in some OECD countries the normal age for receiving age pensions has increased from the usual age of 65.
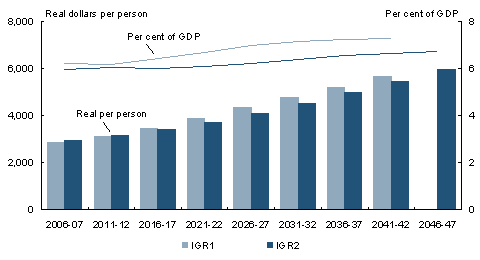
Overall, spending on age pensions in real per person terms follows a very similar path to that in IGR1, reflecting similar projections for the population aged 65 and over. The implementation of the new pension assets test initially brings about slightly higher real spending per person, but this gradually reverses over time, due to the higher total population projection in IGR2 and some upwards revision since IGR1 in the projected income and assets of retired Australians.
Since IGR1 there have been increases to Family Tax Benefit rates, and some softening in both the income tests and tapers. In addition, higher projected fertility has led to an increase in the number of children for whom benefits are paid.
The Welfare to Work policy initiatives introduced in July2006 are responsible for most of the differences in the workforce age payments on a per person basis since IGR1.
The level of spending on payments to individuals as a proportion of GDP (excluding payments that were not modelled in IGR1) is lower than projected in IGR1, primarily reflecting a higher level of nominal GDP both now and in 40 years time (Chart3.8).
Chart 3.8: Comparison of IGR1 and IGR2 projections of Australian Government income support payments (excluding payments not modelled in IGR1)
Source: Treasury projections.
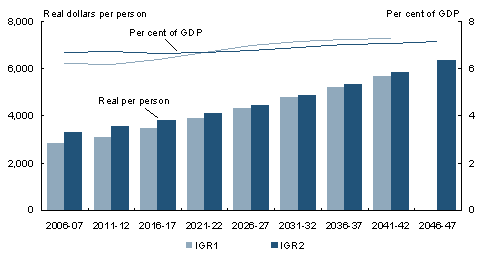
However, total real spending per person on Australian Government payments to individuals is greater in IGR2 than in IGR1, reflecting the increased number of payments modelled in IGR2 (Chart 3.9).
Chart 3.9: Comparison of IGR1 and IGR2 projections of
total Australian Government income support payments
Source: Treasury projections.
The current projections of growth in real spending per person can be decomposed into components due to the ageing of the population and all other components causing real spending per person to rise, such as costs being driven by wages rather than CPI (the non-ageing effect). As expected, an ageing population is the primary driver of the high age pensions, accounting for around three-quarters of the growth in real spending per person to 2046-47. The remaining increase is caused by the indexation of these pensions to wages, which is partially offset by the growing income and wealth of pensioners.
Education and training
Education and training contributes to higher living standards for individuals, by increasing labour productivity and labour force participation. Successive generations of Australians have become more highly educated, reflecting increasing demands for a more skilled labour force and people’s desire for education.
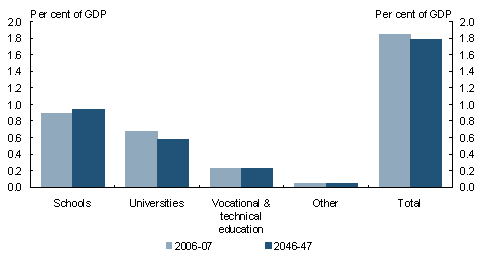
Australian Government education spending is estimated to be 1.85 per cent of GDP in 2006-07. Around half of this spending is on government and non-government schools delivered as specific purpose payments to State and Territory governments. The Australian Government is the main government provider of funds for higher education institutions (largely, universities), and allocates around a third of its education spending to this sector. It also provides funding for vocational and technical education providers, some very specific targeted initiatives, student assistance payments and other (mainly administrative) costs.
State and Territory governments primarily fund government school education, as well as vocational and technical education providers. The trend towards privately provided education, both for schools and for tertiary education, is continuing.
Key trends and drivers
A key driver of changes in education spending is the number of students. The proportion of the population in the principal age group for education (5-24 year olds) has decreased from 36 per cent in 1965 to 27 per cent in 2006, while the actual numbers of people in this age group have increased from around 4 million to 5.5 million.
By 2047, the proportion of the population in the principal age group for education is projected to fall to 21 per cent, with the actual number of people in this age group projected to reach 6.0 million.
Participation rates in education are also an important driver of education spending. Participation rates for most age groups in post-secondary education increased from the 1980s to around 2000, but have mostly stabilised or fallen slightly since. School participation rates have been largely constant since the mid-1990s after increasing from the mid-1980s.
For the Australian Government, the proportion of students attending non-government schools is also an important driver of education spending. This proportion has been increasing steadily, at least since 1980 when it was 22 per cent, rising to 33 per cent in 2005. The higher proportion of students in non-government schools has the effect of increasing total costs to the Australian Government.
In higher education, access to university is assisted through the income contingent loans scheme — the Higher Education Loans Programme (HELP). Changes have included allowing increases to the maximum HECS-HELP charge and increasing the FEE-HELP loan limit. These reforms have seen the main beneficiaries of higher education contributing more towards their education, resulting in the creation of additional university places without excessive increases in public funding.
Assumptions and methodology
Projections of education spending over the next 40 years are based on current Australian Government spending on education combined with projections of total student numbers, incorporating demographic change and economy-wide cost growth. Average costs perstudent in each education sector have been indexed by wages. Further details on the projection methodology are provided in Appendix C.
School-age participation rates are projected to remain at an average of the annual rates since 1995. Between 2001 and 2005, male and female university participation rates fell for all age groups except for women aged 20-23 and aged 60 and over. These falls reversed a trend of increasing rates for some age groups between 2001 and 2004. Most rates are thus projected to remain at around their 2004 level. For vocational and technical education, participation rates have generally risen somewhat since 1996 for men aged up to 21, women aged up to 18 and some older age groups; accordingly for these groups participation rates are projected to increase slightly. For the remaining age groups, participation rates are projected to remain at around the 2004 or 2005 levels out to 2047.
Projections
Total Australian Government spending on education is projected to grow in real perperson terms. However, overall spending is projected to fall slightly as a proportion of GDP, from 1.85 per cent in 2006-07 to 1.78 per cent in 2046-47 (Chart 3.10). The projections are detailed in Appendix A.
Chart 3.10: Projected Australian Government education spending
Source: Treasury projections.
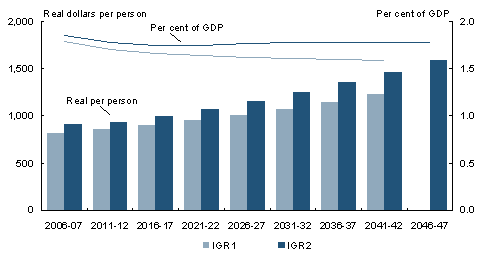
Overall, projected real per person education spending is higher than in IGR1 (Chart 3.11). This is due largely to projected increases in Australian Government spending on schools. Two important reasons account for this increase. First, fertility projections are higher than previously anticipated, leading to higher projected numbers of students. Second, real average costs per school student are higher than previously projected, due mainly to the increasing proportion of students projected to attend non-government schools over the next 40 years.
The current projections of growth in real spending per person can be decomposed into components due to the ageing of the population and non-ageing factors. The ageing of the population detracts from growth in real education spending reflecting the decline in the proportion of the population in younger age cohorts. The driver of real per person growth is the assumed indexation of costs per student by wages and educational participation rates, including the increasing proportion of students in non-government schools.
Chart 3.11: Comparison of IGR1 and IGR2 projections of
Australian Government education spending
Source: Treasury projections.
Government employee superannuation
The Australian Government sponsors a number of superannuation arrangements for its current and former employees. These arrangements affect future government spending because, up until 2005, only a small proportion of the costs of employee benefits were funded as they accrued, with the majority funded at the time payments fell due. Past governments therefore accumulated a significant liability, which is currently estimated at around $100 billion (or 10 per cent of GDP). Furthermore, most benefits are paid as pensions, so payments may continue for a considerable time after the employment which gave rise to the benefit.
The most significant arrangements, in terms of future spending, are the schemes for Australian Government civilian and military employees. These include the Commonwealth Superannuatio
n Scheme, the Public Sector Superannuation Scheme, the Defence Force Retirement and Death Benefits Scheme and the Military Superannuation and Benefits Scheme. The Public Sector Superannuation Scheme and Military Superannuation and Benefits Scheme are less expensive than the Commonwealth Superannuation Scheme and Defence Force Retirement and Death Benefits Scheme and, in addition, have a lower unfunded componentas the Government is meeting a greater portion of the costsfor these schemesas they accrue.
The four major defined benefit schemes for civilian and military employees account for almost all of the Australian Government’s superannuation liabilities and the following projections relate to only these schemes. Defined benefit superannuation arrangements are also in place for federal politicians, judges, and governors-general. In addition, the Australian Government has commitments in relation to the superannuation entitlements of many current and former tertiary education sector employees.
Key trends and drivers
In 1990 and 1991, the Australian Government closed the Commonwealth Superannuation Scheme and the Defence Force Retirement and Death Benefits Scheme respectively to new members. In 2005, the Government closed the Public Sector Superannuation Scheme to new members. From 2005, the Government began funding the superannuation entitlements for new civilian employees as they accrued, rather than adding to the unfunded liability. The Government also paid out its superannuation liability with respect to Telstra and Australia Post in 2004 and superannuation entitlements of former State Rail employees in 2006. This produces future savings.
Despite these initiatives, the Government’s superannuation liability is expected to continue to grow in nominal terms, due largely to growth in the military superannuation liability and further entitlements accruing to existing members of the closed civilian schemes (Chart 3.12). However, the liability is projected to grow more slowly than the economy over the next 40 years and consequently decline as a percentage of GDP (from around 10.1 per cent of GDP today to around 3.2 per cent of GDP by the end of the projection period).
Chart 3.12: Projected defined benefit superannuation liabilities
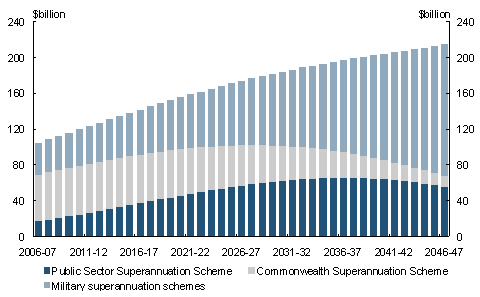
Note: A very small proportion of outstanding liabilities under the Public Sector Superannuation Scheme and Commonwealth Superannuation Scheme are held by other governments. Military superannuation schemes include the Military Superannuation and Benefits Scheme and the Defence Force Retirement and Death Benefits Scheme.
Source: Department of Finance and Administration, PSS and CSS Long Term Cost Report 2005, 2006 and Australian Government Actuary, 2005 Military Superannuation and Benefits Scheme and Defence Force Retirement and Death Benefits Scheme (MSBS and DFRDB), 2006.
The Australian Government established the Future Fund in 2006 to finance its superannuation liabilities. The Future Fund is part of the Government’s broader strategy to ensure the long-term sustainability of its finances and ensure it is able to meet the challenges of the future. By provisioning for future superannuation payments — currently the largest liability on the Government’s balance sheet — the Government will free up resources in the future, when other fiscal pressures are expected to emerge.
The objective of the Future Fund is to accumulate sufficient financial assets by no later than 2020 to make provision for the Government’s unfunded public sector superannuation liability. The Fund will be invested in a broad range of financial assets and is managed by an independent statutory body — the Future Fund Board of Guardians, who are responsible for the investment decisions of the Fund.
In May 2006, the Government transferred $18 billion to the Future Fund as seed capital. Further transfers have been made from the 2005-06 Budget surplus, from the receipts from the first instalment of the Telstra 3 share sale and from the Government’s remaining shareholding in Telstra. Further contributions will be made from the 2006-07 Budget outcome and from receipts from the second instalment from the Telstra 3 share sale. Under the Future Fund Act, the designated actuary specifies for each year a target asset level for the Fund. This is the amount expected in that year to be needed to meet the unfunded liability. If the value of the Fund is less than the target asset level then further contributions can be made to the Fund (up to that level). Once the target asset level is reached, contributions can no longer be made to the Fund.
Methodology and projections
Projections of Australian Government spending on defined benefit superannuation over the next 40 years are based on official actuarial valuations undertaken in 2005-06 using data to 30 June 2005.
Australian Government defined benefit superannuation payments are projected to increase in nominal terms over the next 40 years. However, payments are projected to grow more slowly than the economy, resulting in a steady decline in payments as a proportion of GDP — from around 0.5 per cent of GDP in 2006-07 to 0.2 per cent of GDP in 2046-47 (Table 3.2). The closure of the old schemes, which are more expensive than their replacements, the higher proportion of benefits being funded as they accrue under the new schemes and the declining overall numbers of Australian Government employees as a percentage of the Australian population will all work in the same direction to constrain growth in spending.
The projected decline in spending on superannuation as a proportion of GDP is greater than shown in IGR1. The main reasons for this change are the stronger nominal economic outlook in IGR2 and the closure in 2005 of the defined benefit Public Sector Superannuation Scheme to new members. For the purposes of this report, superannuation spending on civilian employees who are members of the fully funded Public Sector Superannuation Scheme Accumulation Plan is included in ‘other’ government spending.
Table 3.2: Projected public sector superannuation payments for major defined benefit schemes (per cent of GDP)

Note: Projections for the civilian schemes include the Commonwealth Superannuation Scheme and Public Sector Superannuation Scheme. A very small proportion of payments under these schemes relate to liabilities held by other governments. Projections for the military schemes include the Defence Force Retirement and Death Benefits Scheme (incorporating costs from the previous Defence Forces Retirement Benefits Scheme) and Military Superannuation and Benefits Scheme.
Source: Department of Finance and Administration, PSS and CSS Long Term Cost Report 2005, 2006 and Australian Government Actuary, 2005 Military Superannuation and Benefits Scheme and Defence Force Retirement and Death Benefits Scheme (MSBS and DFRDB), 2006.
Other spending
Other areas of Australian Government spending include defence and national security, the environment, transport and communications infrastructure, public order and safety and core government services such as departmental operating costs. These areas generally do not have a clear link with demographic factors, and given their diverse nature, it is difficult to project spending in these areas with any certainty. Further, spending in many of these areas is highly dependent on government decisions. Consequently, other spending is assumed to grow broadly in line with the
economy over the next 40years. This allows for spending to increase as a proportion of GDP in some areas and decline in others.
The major components of other spending are on defence and the environment. Key trends and drivers of spending in these areas are discussed in more detail below.
Defence
Australian Government defence spending is estimated to be 1.7 per cent of GDP in 2006-07 (excluding spending on military superannuation, which is modelled separately under ‘Government Superannuation’). The Government’s White Paper, Defence 2000 — Our Future Defence Force, provided a funding commitment equivalent to 3 per cent annual real growth for the decade to 2010-11. In the 2006-07 Budget, the Government provided for a further 3per cent real growth up to 2015-16. Since the White Paper, the Government has also supplemented defence spending further for discrete measures (for example, for military operations).
Key trends and drivers
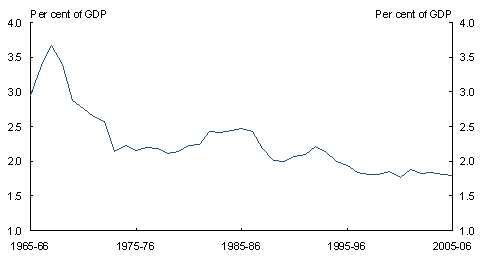
Over most of the past four decades, defence spending has fallen gradually as a proportion of GDP (Chart 3.13). While defence spending has grown in real terms, the economy has grown faster. The declining trend has levelled out in recent years, with significant growth in defence spending accompanying strong growth in nominal GDP over that period.
Unlike many other government functions, the demand for defence spending has no direct links to demographic factors. An increase in population does not increase the cost of defence directly, but can strengthen the government’s capacity to pay for defence.
Future defence spending will depend on a wide range of factors, including the strategic environment, the community’s tolerance of risk and the cost of inputs into defence capability. As with all government spending, these factors will be balanced against fiscal constraints. Future trends in the individual factors can be difficult to discern, as can any precise view of how they would interact.
A discussion of various alternative projection methods for future defence spending is in Appendix C.
Chart 3.13: Defence spending as a proportion of GDP
Source: Australian Bureau of Statistics data, Department of Defence annual reports, various years.
Environment
Since IGR1, spending by the Australian Government on protecting and conserving the environment is estimated to have more than doubled, from around $1.8 billion (0.2percent of GDP) in 2001-02 to an estimated $3.9 billion (0.4 per cent of GDP) in 2006-07.
Key trends and drivers
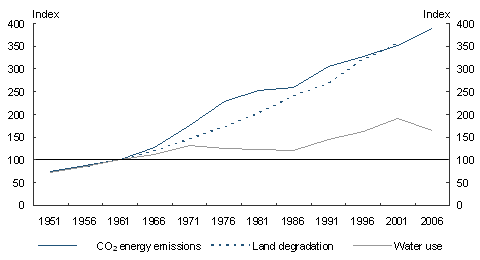
Increases in government spending on the environment can be attributed to several key factors. Foremost is the awareness of the importance of Australia’s natural environment that has increased as evidence of environmental pressures have emerged in areas such as land degradation, soil erosion and salinity, water use and climate change (Chart 3.14).
Chart 3.14: Indicators of Australian environmental pressures1
1951-2006 (Index 1961 = 100)
Source: Commonwealth Scientific and Industrial Research Organisation, Australian Stocks and Flows Framework (unpublished); Australian Bureau of Statistics Water Account, Australia 2000-01, 2004-05 Cat. No. 4610.0 and Australian Greenhouse Office 2006, Greenhouse Gas Inventory Report 2004 (Revised).
A further factor is that greater understanding of environmental problems, resulting from improved knowledge of environmental systems and their interactions, has lead to a greater capacity to address environmental problems. At the same time, increasing real wealth and incomes tend to lead to increased demand for environmental action.
While it is reasonable to expect these factors to exert ongoing (and possibly greater) influence in the future, it is also the case that, at this stage, considerable uncertainty surrounds the ability to estimate, even in reasonably broad quantitative terms, the evolution of future government spending on the environment.
Part of the challenge lies in data limitations. Comprehensive, consistent data on government environment spending is only available for recent years, complicating both comparisons over longer periods of time and the use of past trends as a basis for future projections.
The extent to which environmental pressures are reflected in increased government spending will depend, in large part, on the choices governments make and, most importantly, the policy instruments they choose for dealing with environmental problems.
Policy choices
Sustainable policy would address the underlying incentives causing environmental degradation. Most often, this will involve making protection of the environment a cost of production and consumption, through instruments such as market-based measures to price externalities, reducing subsidies to environmentally damaging practices, and regulation.
While no single policy instrument is appropriate for all environmental problems, government choices regarding policy instruments will have implications for economic welfare and fiscal sustainability both for current and future generations. Poor choices may prove costly both fiscally and in economic welfare terms, and may even result in ineffective or perverse environmental outcomes.
Historically, governments have relied on regulation to achieve environmental outcomes. Regulatory approaches can be effective but normally require affected parties to achieve specified outcomes irrespective of costs, so there is little incentive to innovate and do more than required. The outcome is unlikely to be economically efficient.
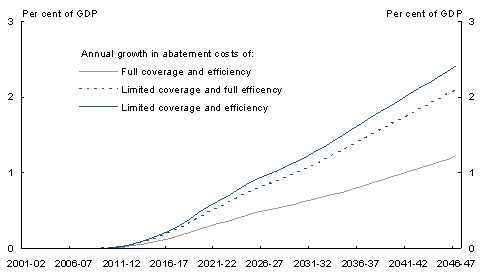
Directly ‘purchasing’ environmental outcomes can be effective and, in some instances, appropriate. However, applied broadly, it can involve significant fiscal costs. While many consider climate change mitigation is best addressed through market-based mechanisms such as an emissions trading scheme, governments may alternatively elect to purchase abatement activities using budget funding. The potential cost to the budget from adopting the latter approach can rise quite significantly, imposing a substantial tax burden on today’s, and future, generations (Box 3.1).
Environment and growth
The environment provides natural resources that are essential inputs into Australia’s productive capacity as well as ecosystems that absorb and assimilate the waste generated by people and industry. Therefore, while it may be possible for an economy to extract higher levels of economic growth in the shorter term by choosing to excessively degrade the quality of the environment, over the longer term, such choices will not be sustainable. Sustainable economic growth over time is inextricably linked to environmental sustainability; poor environmental management inevitably adversely affects current and future productive capacity.
Unsustainable use of the environment generally results from the failure of those undertaking economic activities to take into account environmental consequences. Where the use of environmental goods and services is not valued properly, users of these resources have little incentive to recognise the costs of the environmental degradation they impose, or the alternative uses to which these resources could have been put. Instead, the focus inappropriately shifts only to the financial growth foregone from addressing the environmental damage.
|
Box 3.1: Illustrative fiscal costs of emissions abatement scenarios The potential fiscal cost of purchasing emissions abatement can be estimated by combining the ‘abatement task’ with the marginal cost of abatement. The abatement task can be considered as the difference between projected and desired emissions levels. For the purposes of the exercise below, the assumption is made that emission levels currently targeted (108 per cent of 1990’s emissions) are maintained over time. As such, the abatement task can be expected to increase as the economy expands. The marginal cost of abatement is expected to be low initially but is assumed to rise as the abatement task increases and lower cost opportunities become exhausted. The marginal cost is also influenced by the policies used to achieve the desired level of abatement. The Australian Bureau of Agricultural and Resource Economics has modelled three different scenarios based on the abatement target above, and using varying levels of sectoral coverage and efficiency in purchasing abatement. Combining the abatement task with the marginal cost of abatement, the three scenarios illustrate the potential total annual costs of abatement (Chart 3.15). The results suggest that even where there are abatement policies that have full coverage of the economy and can exploit all known technological potentials, the cost of a fiscal approach to undertaking all such abatement activities climbs from the current near zero cost to around 1 per cent of GDP after 40years. Where less efficient approaches are adopted, with the Government specifically excluding certain sectors or using prescriptive (non-market) policy instruments, the cost rises to between 2 and 2percent of GDP after 40 years. Chart 3.15: Illustrative cost of emissions abatement
Source: Unpublished modelling by the Australian Bureau of Agricultural and Resource Economics based on their Global Trade and Environment Model and Treasury assumptions. |
One topical example is climate change. Scientific evidence indicates that climate change can be expected to affect both Australia’s physical and economic environments. The scale of the change, and the way it will manifest is difficult to predict and plan for. Nevertheless, the Commonwealth Scientific and Industrial Research Organisation (CSIRO)2 has identified a number of possible outcomes, including increased temperatures, declining average rainfall, and greater frequency of severe weather events such as prolonged droughts and storms. All of these can be expected to impact on Australia’s future GDP. However, modelling such impacts is very difficult, as evidenced most recently by the Stern Review3, and emphasised by its critics. Nonetheless, there does seem to be consensus around the fact that significant levels of global warming imply losses in global GDP over the longer term that should be factored into the policy choices made today.4
Government actions that ensure environmental consequences are taken into account can provide for both improved economic and environmental outcomes. For example, the presumption that water was in unlimited supply, and its effective treatment as a ‘free’ resource, led to Australia’s water being overallocated, with a significant proportion of Australia’s water management areas estimated to be approaching, or beyond, sustainable extraction levels.5 Moreover, while around 70 per cent of Australia’s water is used for agricultural purposes, the relative value created from different productive areas varies significantly. Establishing a clearly defined property rights framework and effective water markets, as envisaged under the National Water Initiative, would provide the price signals needed to encourage the more productive and efficient use of water. The Australian Government’s recent announcement of its $10 billion water package aimed at addressing overallocation, returning the Murray-Darling river system to sustainable extraction levels and further progressing market-based reforms, seeks to make progress in these areas.
In some instances, governments may choose environmental outcomes that will imply lower economic growth — even over the longer term. Such choices can be expected to reflect the importance of environmental outcomes in their own right in raising the wellbeing of society, and the decisions elected governments are tasked to make in balancing society’s desire for strong economic growth with the value society places on preserving the environment.
Revenue prospects
Australian Government revenue is derived from taxation and non-taxation sources.6 In 2006-07, taxation receipts are expected to amount to $213 billion (20.7 per cent of GDP) and account for 92 per cent of total Australian Government receipts. Income taxes are the predominant source and are expected to account for around 86 per cent of taxation receipts in 2006-07. Indirect taxes are expected to account for the remaining 14 per cent, of which excise on petroleum products is expected to contribute 7 percentage points. Non-taxation receipts include sales of goods and services by the Australian Government, interest and dividends, petroleum royalties and seigniorage from circulation coin production. In 2006-07, non-taxation receipts are expected to amount to $18 billion (1.8per cent of GDP) and account for 8 per cent of Australian Government receipts.
Australian Government cash receipts account for around 57 per cent of the receipts of all governments in Australia. State government receipts account for around 37 per cent and local government for the remaining 6 per cent. In 2006-07, the States are estimated to receive $39.3 billion in GST revenue, more than 26 per cent of their total receipts. Other important revenue sources for the States are specific purpose payments from the Australian Government, payroll taxes and stamp duties on property conveyances. The majority of local government receipts come from property rates and charges for goods and services.
Historical trends and drivers
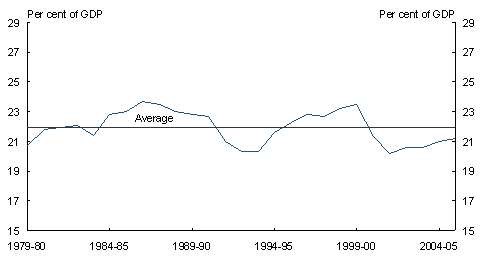
Over time, taxation receipts are correlated with nominal economic growth because most of the tax bases from which they are raised correspond broadly to major elements of nominal GDP. Over the last 25 years, the ratio of Australian Government taxation receipts to GDP has fluctuated over a narrow range of between 20 and 24percent (Chart3.16). This contrasts with an earlier trend for the ratio to increase during the early and middle decades of the twentieth century. This shift from rising to broadly level tax ratios has been observed in most OECD countries.
The minor variations around the plateau level in Australia in recent decades reflect a mix of changing economic conditions and adjustments to policy settings over the period: for example, recessions in the early 1980s and 1990s were associated with lower tax-to-GDP ratios; relatively tight fiscal policy settings in the mid to late 1990s played a role in increasing the ratio; and structural reform to the tax system reduced the ratio again from 2000-01.
Chart 3.16: Total Australian Government taxation receipts,
1979-80 to 2005-06
Source: Australian Bureau of Statistics Cat. No. 5206.0 and Australian Government Budget Paper No.1, various years.
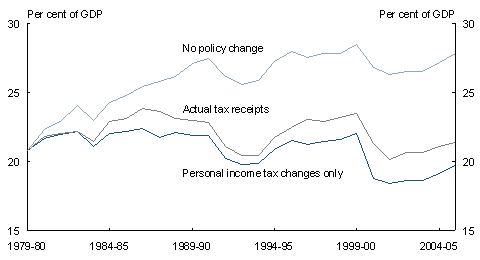
The relative overall stability of the tax-to-GDP ratio over the past 25 years reflects the importance of policy adjustments to revenue collections, particularly periodic adjustments to the personal income tax scale. The top line in Chart 3.17 shows that, under a strict no-policy-change assumption (including no change to the personal income tax scales), tax collections would have risen faster than GDP over the period from 1979-80 to 2005-06. This would have resulted in a tax-to-GDP ratio considerably higher than actually obtained— more than 5 percentage points higher in 2005-06. This reflects the progressivity of the personal income tax scale and the fact that the personal income tax thresholds are set in nominal terms.
The strict no-policy-change scenario is unrealistic. For example, if individual taxpayers in 2003-04 (the latest year for which actual data are available) had been taxed under the personal income tax scales of 1979-80, more than 45 per cent would have faced the top marginal tax rate of 61 per cent and 77 per cent would have faced a marginal rate of over 47percent, higher than today’s highest rate.
In practice, governments make substantial periodic adjustments to the personal income tax scale. The impact of these adjustments is reflected in the difference between the strict no-policy-change scenario and the bottom line of Chart 3.17, which illustrates what the tax-to-GDP ratio would have looked like if the only policy changes since 1979-80 had been those made to the personal tax scales. Policy changes to the personal tax scales have, in aggregate, significantly outweighed the impact of nominal price increases on tax receipts (this is confirmed by micro-simulation data).
While the company tax rate has been cut, governments also have made a number of other discretionary policy changes, including broadening of the personal income, company and indirect tax bases. The combined value of these other discretionary changes is reflected in the increase from the bottom line to the middle line in the chart — the actual level of taxation receipts over the last 25 years.
Chart 3.17: Impact of policy change on Australian Government tax receipts, 1979-80 to 2005-06
Note: Wholesale Sales Tax (WST) has been included in all three series on the basis of actual collections, as a no-policy-change series for this tax is not available.
Source: Australian Bureau of Statistics Cat. No. 5206.0; Australian Government Budget Paper No. 1, various years and Treasury estimates.
The large impact of discretionary changes in tax policyover even the last 25 years, amounting to over 5 per cent of GDP, makes it difficult to adopt specific assumptions about tax policy over the 40-year projection period. While a strict no-policy-change assumption would be unrealistic, there is no non-arbitrary, alternative benchmark.
The emphasis of the analysis in this report, and in intergenerational fiscal analyses around the world, rests on the pressures that demographic change is likely to impose on future government spending, rather than on the way this spending is financed. In line with that, this report does not present revenue projections based on modelling of particular revenue sources or on an analysis of demographic or economic factors that may influence revenue collections.
Overall results
Long-term spending pressures
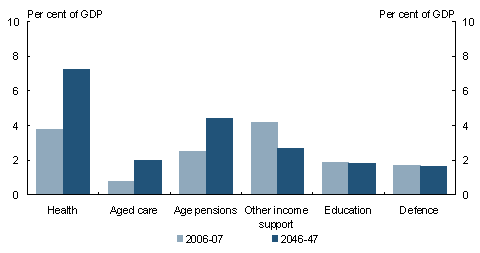
Projections in this report for Australian Government spending on health, aged care and income support payments show that these are likely to increase, both in real per person terms and as a proportion of GDP over the next 40 years. While spending on education also is projected to rise in real per person terms, it is projected to fall slightly as a proportion of GDP by the end of the projection period (Chart 3.18). Defence, which is part of other spending, is assumed to grow broadly in line with the economy over the next 40 years.
Chart 3.18: Projections of Australian Government spending
by category
Source: Treasury projections and assumptions.
Australian Government spending on health and aged care is projected to grow significantly over the next 40 years, due mainly to the continued development of improved, but more expensive, drugs and medical technologies, with an ageing population also increasing demand for health and aged care spending.
Total payments to individuals are projected to increase as a proportion of GDP, driven by higher age pensions. However, the projected increase in age pensions is smaller than for most other industrialised countries, reflecting the targeted nature of the Australian Age Pension system and the level of private funding of retirement incomes, which will become increasingly important over time. The increase in age pensions is partially offset by the projected decline in other payments to individuals as a proportion of GDP. This is because some income support payments, such as unemployment allowances and significant components of family payments, are tied to consumer price growth, which is projected to be lower than growth in nominal GDP.
Spending on education is projected to fall slightly as a proportion of GDP as younger people will comprise a smaller proportion of the overall population.
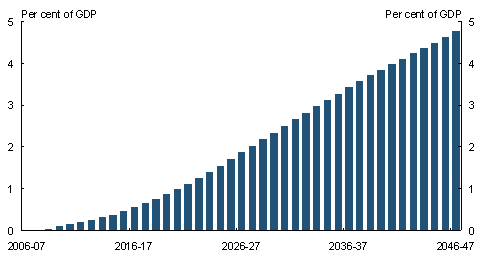
Overall, real Australian Government spending per person is projected to increase by 2percent a year on average over the next 40 years (or by around 4per cent per person a year on average in nominal terms). Accordingly, Australian Government spending is projected to rise by around 4percentagepoints of GDP by 2046-47 (Chart 3.19). Health, age pensions and aged care account for most of the projected rise in spending.
Chart 3.19: Projection of spending pressure
Source: Treasury projections.
While an ageing population is projected to contribute to an increase in spending over the next 40 years, roughly two-thirds of the projected increase in real spending per person is driven by factors other than ageing. This is most notable for health spending, where a significant component of the projected increase is driven by non-demographic factors such as the development of new drugs.
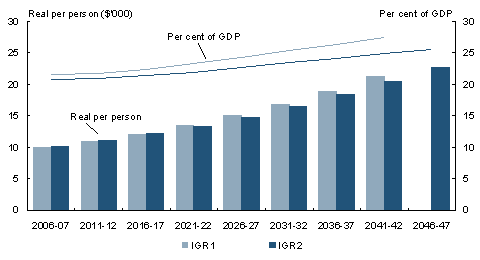
Overall, real spending per person is projected to be slightly less than in IGR1 towards the end of the projection period (Chart 3.20). While projected real spending per person has increased in some areas such as education and aged care since IGR1, this is more than offset by lower projected real spending perperson for health and certain payments to individuals.
Consumer price growth in IGR2 is broadly similar to that in IGR1 (Chart 2.25). Therefore, nominal spending per person, which is real spending per person adjusted for consumer price growth, is also projected to be slightly less than in IGR1.
Largely because of the recent improvement in the terms of trade, nominal GDP per person over the projection period is higher in IGR2 than it was in IGR1. As a result, nominal spending as a proportion of nominal GDP (which is equivalent to nominal spending per person divided by nominal GDP per person) is projected to increase by less than in IGR1.
Chart 3.20: Co
mparison of IGR1 and IGR2 projections of
Australian Government spending
Note: Some of the difference in total real spending per person will reflect changes in GDP projections since a component of spending is linked to GDP. Since IGR1, there have been some changes in projection methodologies incorporating new data and modelling approaches.
Source: Treasury projections.
The spending projections outlined in this report are based on reasonable assumptions of long-term demographic and economic growth trends. Considerable uncertainty surrounds these assumptions and their impact on government finances. In particular, uncertainties around the interaction between factors affect spending and how these may change over time. For example, labour shortages arising from an ageing population may further increase the labour force participation of older workers. This would delay retirement and increase this group’s incomes, reducing the fiscal impact of population ageing. AppendixB shows the impact on economic growth and government spending of applying reasonable alternative assumptions to those contained in the report.
Assessment of fiscal sustainability
The Australian Government’s current fiscal position is strong, by both historical and international standards. The Government has eliminated net debt and is continuing to strengthen its balance sheet by running budget surpluses and accumulating financial assets in the Future Fund.
While the fiscal outlook over the next decade is favourable, the spending projections in this report suggest that governments will need to continue to make policy adjustments to maintain a sustainable fiscal position over the next 40 years.
To assess the impact of projected spending pressures on Australian Government finances, revenue (excluding interest receipts) is assumed to remain a constant 22.1 per cent of GDP over the next 40 years. Under this assumption, spending is projected to exceed revenue in around 17 years. By 2046-47, the gap between spending and revenue is projected to grow to around 3percent of GDP (Chart3.21).
Chart 3.21: Projected Australian Government primary balances
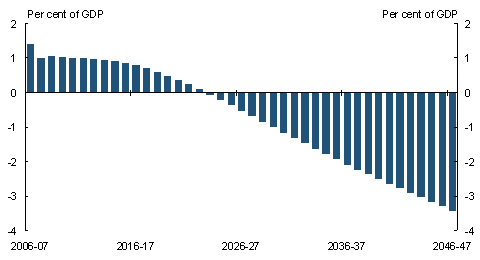
Note: The projections are of the primary balance (which excludes net interest payments and Future Fund earnings). The first four years of the IGR2 projections are primary balances based on the 2006-07 Mid-Year Economic and Fiscal Outlook adjusted for major government decisions announced since that time.
Source: Treasury projections.
The outcome for IGR2 compares to a projected fiscal gap in IGR1 of 5per cent of GDP by 2041-42 (Chart 3.22). The improved outcome is due to a lower rate of growth of projected spending per person and higher projected nominal GDP per person. The lower projected spending is mainly in health and certain payments to individuals partly offset by increases in some areas such as education and aged care. The higher projected nominal GDP per person is predominantly attributable to the recent strong rise in the terms of trade. Higher labour force participation and skilled migration also have increased nominal GDP per person.
Chart 3.22: Comparison of IGR1 and IGR2 projected primary balances
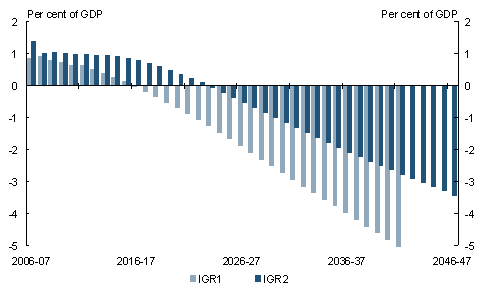
Note: Since IGR1, there have been some changes in projection methodologies incorporating new data and modelling approaches.
Source: Treasury projections.
The projections for IGR2 are on a primary balance basis which excludes net interest payments from the underlying cash balance. By removing financing costs the primary balance provides a measure of underlying fiscal pressures. IGR1 was also prepared on a similar basis but included net interest payments that were contained in the 2002-03 Budget forward estimates. These were held constant as a percentage of GDP over the projection period. Applying the new methodology of IGR2 to IGR1 would have produced a fiscal gap in 2041-42 of 4.7per cent of GDP compared to the 5.0 per cent of GDP reported in IGR1.
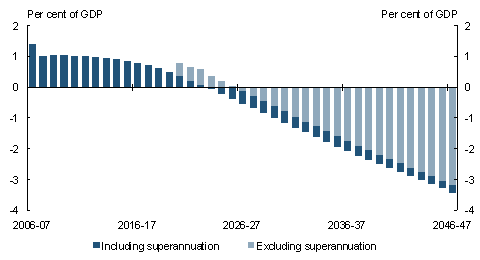
Despite higher nominal GDP per person, governments will still need to make policy adjustments to maintain sound government finances. The Government already has taken steps to address some of the fiscal pressures. By provisioning for unfunded liabilities through the Future Fund, the Government is strengthening its balance sheet now to finance superannuation payments that need to be made in the future. From 2020, or once the liability has been met, superannuation payments can be funded by drawing down on assets in the Future Fund rather than from general revenue. This will ease the fiscal adjustment task associated with other projected fiscal pressures. Chart 3.23 shows projected fiscal pressures after removing Australian Government superannuation payments from 2020-21.
Chart 3.23: Fiscal pressures adjusted for superannuation payments
Source: Treasury projections.
Considering future spending pressures in the context of the Government’s balance sheet is a more useful guide for assessing the sustainability of government finances. This is because a government can build up assets today to provide for accumulated liabilities, as has been the case with the Future Fund.
The projected spending pressures outlined in this report imply a deterioration in the Government’s balance sheet over time. If surpluses are maintained to 2022-23 as projected, then net debt would not re-emerge until the mid-2030s but would rise very quickly to reach around 30per cent of GDP in 2046-47 and continue to increase after that date (Chart 3.24). Increasing net debt would lead in turn to higher debt-servicing costs, adding to upward pressures on spending.
Such an outcome would not be sustainable. Delaying policy action and accumulating government debt as spending pressures arise means deferring a higher tax burden to future generations of Australians. The Government’s medium-term fiscal strategy would not permit such an outcome.
Chart 3.24: Projected path of Australian Government net debt
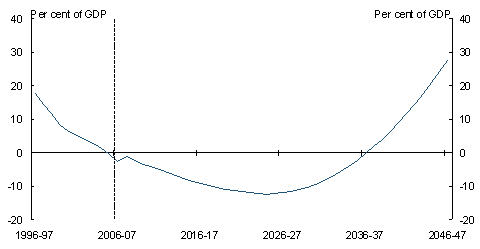
Note: The projections of net debt include net interest payments. The small increase in Australian Government net debt in 2007-08 reflects the expected change to the financial asset composition of the Future Fund as it moves towards a portfolio allocation consistent with the benchmark return specified in the Australian Government’s investment mandate.
Source: Treasury projections.
The projected path of government finances shows the magnitude of the fiscal adjustment task that would be needed. Governments will need to take action to prevent a sustained deterioration in government finances. The dynamics associated with running up debt are such that small persistent changes to spending can have very large effects if they accumulate over a long time. By making policy adjustments today, the Government reduces the risk that
more significant policy adjustments will need to be made in the future.
1 Degraded land is defined as agricultural land whose productive capacity has declined more than 20percent. Land degradation data is not available for 2006. Water use data for 2006 is based on 2005 data from Australian Bureau of Statistics, Water Account, Australia 2004-05, Cat. No. 4610.0.
2 CSIRO 2006 Climate change impacts on Australia and benefits of early action to reduce global greenhouse gas emissions.
3 HM Treasury 2007 The Economics of Climate Change: The Stern Review Cambridge University Press.
4 The Stern Review sought to model the global economic impacts of climate change. Modelling the economic impacts of climate change at the regional or country level is likely to prove highly complex and speculative at this stage.
5 National Water Commission, Australian Water Resources 2005.
6 Consistent with the approach taken in the rest of the report, figures given in this section are on a cash basis.
