The projections in this report were built using assumptions to form a plausible central case. Significant uncertainties surround these assumptions, and as a result, the projections in the report should not be treated as forecasts. These uncertainties reflect the inherent difficulties in anticipating changes to economic, social and environmental conditions over time.
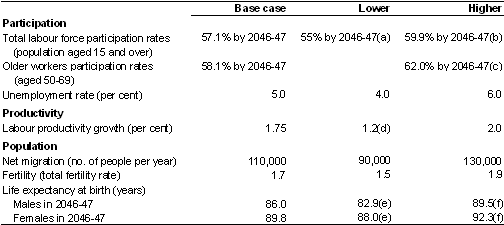
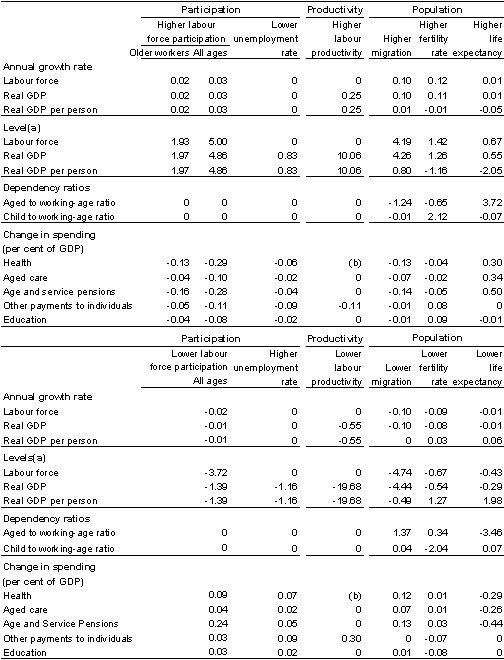
This appendix explores some variations to the base case projections and assumptions about the drivers of economic growth— population, participation and productivity (TableB.1). The results of the sensitivity analysis (TableB.2) show that the core results identified in IGR2 are reasonably robust to variations in underlying assumptions.
The results can also be used as an indication of the potential impact on fiscal sustainability of policy changes that aim to improve economic growth — including the impact on projected spending pressures, and on projected GDP (which gives an indication of the ability of the government and individuals to meet those spending pressures).
Factors that increase the proportion of the population employed in the workforce at a particular time generally lead to decreased government spending and increased GDP. Lower unemployment, higher migration and higher labour force participation have this immediate effect. For example, the scenario of higher labour force participation across all age groups presented in this appendix would increase the projected annual real GDP growth rate in 2046-47 by 0.03percent and lead to a 4.9 per cent increase in the level of real GDP by 2046-47. At the same time, spending as a proportion of GDP would decrease in the areas of health, age pensions, and other payments such as unemployment and family benefits.
As shown in Table B.2, higher productivity has the most significant link to higher GDP growth, with an increase in labour productivity of 0.25per cent per year from 2010-11 adding 10.1percent to GDP by 2046-47. On the spending side, higher productivity growth is assumed to flow through into higher wages across the economy, leading to an automatic increase in government spending on payments to individuals that are indexed by wages. For the purposes of these scenarios, higher productivity is also projected to flow through to increases in spending in areas where wages are a large component of costs, such as aged care and education, though it should be noted that the government has control over the extent to which this flow through into spending occurs.
Higher fertility and higher life expectancy increase government spending because the oldest and youngest people in the population generally benefit from spending programmes and income support, but generally do not participate in the labour force (and therefore do not contribute to GDP growth). The key spending areas of family payments, education, age pensions and aged care are concentrated in these two groups. For example, a higher fertility rate of 1.9 would result in increased spending on education and family benefits (together amounting to 0.16percent of GDP in 2046-47), while increased GDP from a larger labour force would, over time, result in a fall in the relative size of health, aged care and age pension spending. It should be noted that the full impact of higher fertility on labour force participation is not seen within the 40-year projections due to the delay before the young reach working age. Similarly, the longer term impact of higher fertility on health, aged care and age pension spending appears beyond the projection period.
Table B1: Assumptions underlying sensitivity analysis

- Male and female age specific participation rates are held constant at 2006-07 levels from 2010-11.
- All male and female age specific participation rates are adjusted to achieve an increase of 5 per cent in total participation rates for population aged 15 and over.
- Growth in age specific participation rates is increased by 10 per cent for workers in the age cohorts of 50-54, 55-59, 60-64 and 65-69, giving a total participation rate (15+) of 58.2% in 2046-47.
- Represents the average productivity growth rate in the 1980s.
- Uses IGR1 life expectancy projections.
- All the improvement factors are scaled by 1.625 for men and 1.5 for women.
Source: Treasury projections.
Table B2: Impact of alternative scenarios (percentage point change in 2046-47)

- Represents the percentage point change in the size of the labour force and the level of GDP and GDP per capita by 2046-47 compared to the base scenario.
- The potential impact of productivity growth on Australian Government health spending is difficult to quantify and has not been included here.
Source: Treasury projections.