The preceding analysis showed the sensitivity of the structural budget balance estimates to a range of plausible assumptions for the terms of trade. This section presents additional sensitivity analysis relating to the elasticity of taxes to economic activity and concludes that the impact of changing this elasticity is less than the sensitivity to plausible structural terms of trade assumptions. This section also shows estimates of the structural budget balance abstracting from the fiscal stimulus measures put in place by the Australian Government in response to the GFC.
As mentioned earlier, in considering the structural balance estimates presented in Chart 3, it is important to recognise that the use of a constant historical average tax elasticity to nominal GDP for calculating the cyclical component of government receipts means that movements in the tax share of GDP are largely treated as structural. In practice, the relationship between nominal GDP and revenue can vary considerably over time. In recent years, tax receipts as a share of total income fell 3.7 percentage points of GDP (around 16 per cent) from the pre-GFC level of 23.7 per cent of GDP in 2007-08 to 20.0 per cent in 2010-11. Among other factors, this reflects changes in the composition of activity and profits across sectors since the GFC; in particular, the increased profit and lower effective tax ratio of the mining sector. Our estimates suggest that the cyclical contribution to receipts might be underestimated in the pre-GFC period (implying that structural surpluses are overestimated) and overestimated in the post-GFC period (implying that structural deficits are overestimated).
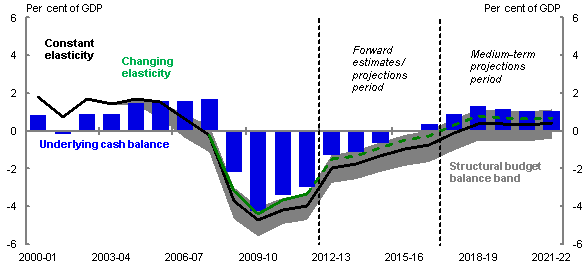
Estimating a new elasticity to capture the weaker relationship between the tax receipts and GDP since the GFC is empirically challenging given the small number of observations. One way to approximate this changed relationship is to examine the difference between Treasury’s forecasts of tax receipts and actual tax collections (forecast errors) assuming that forecasts of underlying economic variables (such as nominal GDP) had been accurate. This adjustment indicates residual forecast errors in company tax collections of around ½ per cent of GDP between 2008-09 and 2011-12. Assuming that this captures the changed relationship between the economy and tax receipts, the implied elasticity since the GFC is 0.7, which is significantly less than the 1.25 estimated over the whole sample period. Chart 4 shows that applying a tax elasticity of 0.7 from 2008-09 onwards raises the structural budget balance estimates to around the upper bound of the range shown in Chart 3. This extreme case of a permanent reduction in the elasticity of tax to nominal GDP is shown for illustrative purposes only and is not the basis used by Treasury to construct revenue forecasts.
Chart 4: Structural budget balance with changing assumption on elasticity of tax to nominal GDP

Note: For the sensitivity test presented above (green line), the elasticity is set to 1.25 prior to the GFC (before 2008-09), and 0.7 from 2008-09 onwards.
Source: ABS cat. no. 5206.0, 5302.0, 6202.0 and 6401.0 and Treasury.
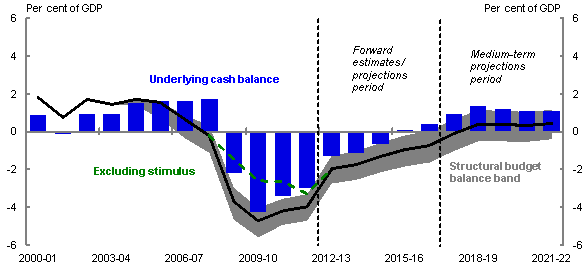
In addition to adjusting for temporary economic drivers, adjustments can also be made for other temporary factors that have a significant impact on the underlying cash balance to gauge the medium-term sustainability of more permanent fiscal settings. These adjustments can include abstracting from policy changes that are expected to be temporary, or adjusting for significant changes in the underlying cash balance caused by short term exogenous factors, such as natural disasters. Chart 5 adjusts the structural budget balance estimates shown in Chart 3 for the impact of the fiscal stimulus put in place by the Australian Government in response to the GFC, consistent with estimates shown in the 2009-10 Budget and McDonald et al (2010).9 The effect is to reduce the estimated size of the structural budget deficit between 2008-09 and 2011-12, while also highlighting the contribution of other influences on movements in the structural budget balance during this period, including the decline in the tax to GDP ratio described earlier.
Chart 5: Structural budget balance abstracting from fiscal stimulus

Source: ABS cat. no. 5206.0, 5302.0, 6202.0 and 6401.0 and Treasury.
9 The adjustment that has been made is consistent with the estimates of the underlying cash balance impact of the fiscal stimulus provided by Treasury to the Senate Economics References Committee Inquiry into the Government’s Economic Stimulus Initiatives, available at http://www.aph.gov.au/Parliamentary_Business/Committees/Senate_Committees?url=economics_ctte/completed_inquiries/2008-10/eco_stimulus_09/submissions.htm.