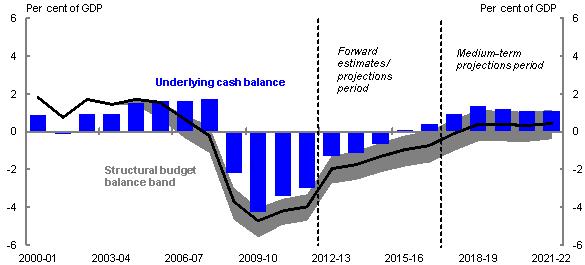
This section presents a range of estimates of the structural budget balance for the Australian Government, based on outcomes, forecasts and projections of the underlying cash balance as published in the 2013-14 Budget and the methodology in McDonald et al (2010). It also discusses movements in these estimates over time.
The point estimates presented in Chart 3 are based on Treasury’s long-run terms of trade assumption as described in Box 1. Chart 3 also shows a range of estimates for the structural budget balance using the same methodology, but incorporating the terms of trade assumptions currently used by the OECD (the lower bound) and the post-boom average (the upper bound).
Chart 3: Structural budget balance estimates

Note: The grey range represents the range of structural budget estimates using the OECD’s assumption for the structural level of the terms of trade (average between 1986-87 and 2010-11), and using the average from 2003-04 to 2015-16.
Source: ABS cat. no. 5206.0, 5302.0, 6202.0 and 6401.0 and Treasury.
The structural budget balance estimates shown in Chart 3 indicate that, prior to the GFC, underlying cash surpluses were supported by temporary (cyclical) factors, including the high terms of trade, an economy operating above its long-run potential and strong growth in asset prices. The estimates suggest that the structural budget balance deteriorated from the mid-2000s, with the point estimate of the structural budget balance falling into deficit just prior to the GFC.
The underlying cash balance moved further into deficit with the onset of the GFC, as the sharp fall in nominal GDP growth and asset prices reduced tax receipts significantly. This coincided with a widening of the structural budget deficit, largely attributable to the Government’s temporary fiscal stimulus measures and some of the factors that drove the large fall in the tax share of GDP in this period. These include the increased share of profits coming from the resources sector (which pays less tax per dollar of economic income than other sectors), and the implementation of policy measures announced earlier, particularly successive large cuts in personal income taxes.7 The fiscal stimulus measures have since been unwound; however, the factors that have reduced the tax share of GDP continue to weigh on the structural budget position.
As mentioned earlier, a key feature of the methodologies underpinning the structural budget balance estimates used by McDonald (2010), the IMF and the OECD is that the relationship between nominal GDP and tax receipts (the aggregate elasticity) is assumed to be constant over time, consistent with the average relationship over the sample period. In reality, however, the tax elasticity changes over time, and is positively correlated with both economic and asset price cycles. For example, while difficult to estimate precisely due to the small sample, the tax elasticity appears to have been considerably lower since the GFC than the average over the full sample period. If this is the case, then the estimates shown in Chart 3 will overstate the structural budget deficit since 2007-08. The next section shows a sensitivity analysis that corrects for this.
While the level of activity in the real economy remains close to its potential and CGT receipts have fallen to below-average levels, the terms of trade remain above their assumed structural level. Empirically, the effect of the higher terms of trade dominates, which explains why the structural balance shown in Chart 3 remains below the underlying cash balance over the medium term. The terms of trade are projected to decline steadily from their 2011-12 peak, but to remain above the range of structural terms of trade assumptions over most of the period shown, driving a persistent but gradually declining gap between the underlying cash and structural budget balances over the next decade.
The point estimates in Chart 3 show the structural budget position returning to surplus in 2018-19, although the range indicates that the precise year that structural balance is reached is sensitive to the terms of trade assumption. The improvement in the structural budget balance over the forward estimates period is assisted by the structural savings measures detailed in the 2013-14 Budget. Over the medium term, the improvement in the structural budget balance reflects the Government’s commitment to limit real spending growth and allow tax receipts to recover naturally, as reflected in the medium-term fiscal projections.8 The key point to draw from the analysis is not the specific year in which the budget returns to structural surplus, but the steady improvement over time. Indeed, international experience has illustrated the difficulties in disentangling temporary and permanent economic influences on the budget, which cautions against overreliance on point estimates of the structural budget balance (see Box 2).
Box 2: Ireland’s structural budget balance
Changing estimates of Ireland’s structural budget balance provide a cautionary tale, highlighting the difficulty of estimating structural budget balances in real time.
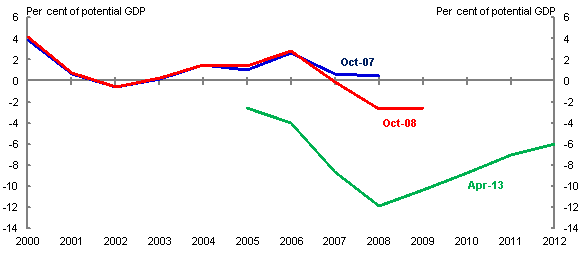
Since the onset of the GFC, the IMF’s estimates of Ireland’s pre-crisis structural budget balance have been revised down significantly. While the IMF initially estimated that Ireland had been close to structural budget balance in 2007, its latest (April 2013) estimate now suggests a structural deficit of around 8½ per cent of potential GDP in 2007 (Chart A).
Chart A: IMF structural budget balance estimates over time

Source: IMF World Economic Outlook October 2007, October 2008 and April 2013.
While part of the revision to the IMF’s pre-crisis estimates of the structural budget balance is due to a lower estimate of potential GDP, the main reason for the change is that these estimates failed to capture the dependence of the fiscal position on an unsustainable boom in the housing sector (Kanda 2010). With residential investment and house prices soaring, property-based taxes grew at a pace well above GDP growth. Failure to recognise at the time that the bulk of these revenues were cyclical led to significant tax cuts and expenditure increases, which created a large structural hole in Ireland’s public finances.
7 The relatively low effective tax rate for the mining sector reflects a range of factors, including royalty deductions, the capital-intensive nature of mining and the accelerated rates at which investment can be written off for tax purposes. Further details on the decline in the tax to GDP ratio since the GFC can be found in Budget Statement 4 2013-14.
8 The medium-term fiscal projections for the underlying cash and structural balance reflect the Government’s fiscal strategy. Real growth in spending is assumed to be held to 2 per cent a year, on average, until the underlying cash surplus is at least 1 per cent of GDP (2018-19) and while the economy is growing at or above trend. The level of tax receipts is allowed to return naturally as the economy grows until it reaches 23.7 per cent of GDP (2018-19), after which it is held constant.