Adjustments to the underlying cash balance for the economic cycle, CGT and terms of trade can be implemented in different ways. This section outlines three adjustment methodologies: the previously published Treasury model (McDonald et al (2010)), and the OECD and IMF models for Australia. This section concludes that the model presented in McDonald et al (2010) is the preferred model because it has the advantage of allowing sensitivity analyses for different assumptions for the structural terms of trade to be done relatively easily and transparently, as well as explicitly modelling cyclical expenditure and CGT receipts.
2009-10 Budget and McDonald et al (2010)
Estimates of the structural budget balance were previously published in the 2009-10 Budget and in McDonald et al (2010). Both sets of estimates are based on the same methodological approach, detailed in McDonald et al (2010). What follows is a brief summary.
The foundation of the approach taken in the 2009-10 Budget and by McDonald et al (2010) is to estimate a nominal GDP gap comprising two components:
- a gap between real GDP and its structural level (the output gap), which is based on assumptions for the structural levels of the components of real GDP (productivity, working age population, participation and employment rates and average hours worked); and
- a gap between the GDP deflator and its structural level, which is based on an assumed long-run level for the terms of trade and a path for domestic prices consistent with the Reserve Bank’s inflation target.4
The cyclical component of total receipts is calculated by multiplying the estimated nominal GDP gap by government receipts as a share of the economy and an elasticity of government receipts to nominal GDP of 1¼, consistent with the historical average elasticity of tax receipts as reported in Girouard and André (2005).
The long-run terms of trade assumption was constructed in three parts. Prior to 2002-03 the structural level of the terms of trade was calculated as the average from 1972-73 to 2001-02. For the period 2002-03 to 2004-05, the structural level of the terms of trade was assumed to match the actual terms of trade. From 2005-06, the structural terms of trade was assumed to be 20 per cent higher than the average prior to 2002-03.
CGT receipts were modelled separately. While there is a theoretical relationship between asset prices and incomes in the long run, there is no direct link over shorter time horizons. Therefore, CGT receipts were adjusted directly, with any divergence of actual or projected CGT receipts from its ten-year average share of GDP assumed to be cyclical.
Unemployment benefits were the only payments item assumed to be sensitive to the economic cycle. The structural level of unemployment benefit payments was assumed to be the level that would occur if unemployment was at its assumed non-accelerating inflation rate (NAIRU) of 5 per cent. This is consistent with the assumption used in the Government’s medium-term budget projections.
OECD and IMF adjustment methods
Both the IMF and the OECD publish structural budget balance estimates for Australia at the general government level, which comprises the Commonwealth, State and local governments. They apply estimates of the sensitivity (elasticity) of the combined general government budget to a deviation of either actual output or actual income from a measure of potential.
The IMF estimates ‘potential nominal GDP’ by detrending nominal GDP using a Hodrick-Prescott filter, implicitly detrending the aggregation of real output, domestic prices and the terms of trade. An elasticity is then applied to the deviation of nominal GDP from this estimate of potential to estimate the cyclical component of government receipts. This cyclical component is removed from total receipts to estimate the structural component. Expenditures are not adjusted under the IMF methodology for Australia.
The OECD estimates the sensitivity of government revenues to the economic cycle by applying an elasticity to estimates of a real income gap (Turner, 2006). The real income gap is constructed using real gross domestic income (GDI), where GDI is equal to GDP at constant prices plus a trading gain (or loss) resulting from changes in the terms of trade, weighted by the export share of GDP in an index year. The estimated ‘gap’ element of real income is constructed in two steps: first, the OECD’s long-run terms of trade assumption is applied to obtain an estimate of potential real GDI; and second, real GDI is adjusted so that the estimated real income gap has the same mean as the OECD’s real GDP output gap for Australia.5
Preferred adjustment method
There are broad similarities between the model outlined in McDonald et al (2010) and the IMF and OECD models. All three models attempt to capture the impact of the economic cycle as well as the terms of trade deviation from its assumed structural level, and use similar estimates of the sensitivity of government revenues to the economic cycle.6
Although the OECD and IMF models have the advantage of being straightforward to implement, the model presented in McDonald et al (2010) has the advantage of incorporating an assumption of the structural level of the terms of trade in a transparent manner. This is critical in light of the uncertainty around Australia’s structural or long-run terms of trade, as it allows sensitivity analyses using a range of plausible assumptions (see Box 1). The model presented in McDonald et al (2010) also has the advantage of a direct adjustment for cyclical movements in CGT revenues.
The rest of this Working Paper presents updated estimates of the structural budget balance for Australia, using the preferred method outlined in McDonald et al (2010) and conducts sensitivity analyses around key assumptions.
Box 1: Terms of trade assumptions
To adjust the underlying budget balance for the effects of the terms of trade, an assumption is required about the structural (or long-run) terms of trade level. Knowing where to set this assumption is difficult in practice. While the current terms of trade boom is supported by strong demand from China and other emerging economies for Australia’s non-rural commodities (including iron ore and coal), history has shown that the path to development is rarely smooth, and the profile of global commodities demand over the coming decades is difficult to predict. On the supply side, the long-run price of commodities is underpinned by the marginal cost of their extraction, which is also subject to considerable uncertainty.
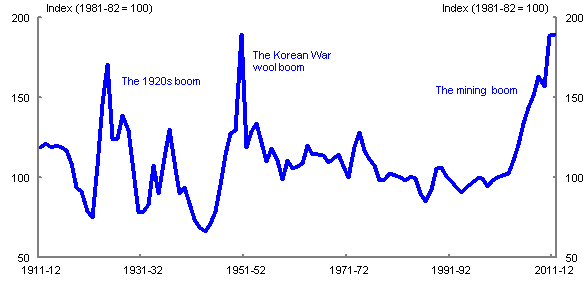
Australia has experienced two episodes of sharp rises in the terms of trade of similar magnitude to the current resources boom over the past 100 years. These past booms were not sustained, with the terms of trade quickly falling back towards pre-boom levels (see Chart A). If the current mining boom were to follow the same pattern, this would be broadly consistent with the assumption used by the OECD for the construction of their structural budget balance estimates, which assume our terms of trade will stabilise at their 25-year average (OECD, 2012).
Chart A: Australia’s terms of trade

Source: ABS cat. no. 5206.0 and RBA.
For an alternative perspective, a lengthy process of urbanisation and industrialisation in emerging market economies and associated demand for our commodities could see Australia’s terms of trade remain elevated by historical standards for a long time. From this perspective, a plau
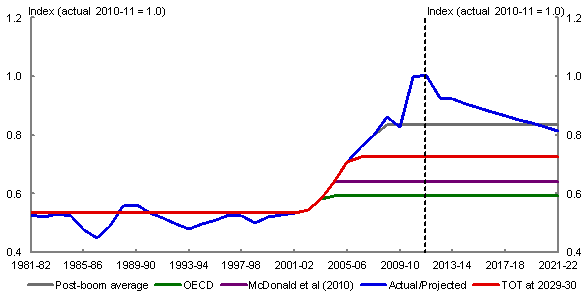
sible assumption for the long-run terms of trade would be to use the post-boom average from 2003-04 until the end of Treasury’s forecast period in 2015-16. This level is around 40 per cent higher than the OECD assumption and is consistent with the assumption methodology used by Deloitte-Access Economics in the construction of their structural budget balance estimates for Australia.
At around the midpoint of these two alternatives is the long-run terms of trade assumption used by Treasury in the projections that underpin the Commonwealth Government Budget. Following the 10 per cent fall in the terms of trade forecast from 2012-13 to 2014-15, the terms of trade is projected to fall 20 per cent over the 15 years from 2015-16 to 2029-30. This projection balances two factors: the prospect that demand for Australia’s non-rural commodity exports has undergone a structural shift due to the growing need for steel and energy to support development in emerging Asia; and the outlook for a significant increase in global supply of non-rural commodities in response to significant increases in prices over the past decade. The Treasury projections are consistent with long-run projections produced by the Bureau of Resources and Energy Economics and the Consensus of market commodity analysts, which suggest that prices of Australia’s key non-rural commodity exports are likely to fall further, but not to pre-boom levels — in part due to rising extraction costs. This suggests that the level of the terms of trade reached in 2029-30 (that is the end point of the medium term projections) under the assumption used in the Commonwealth Government’s Budget Papers is another plausible assumption for the new structural (or long-run) level of Australia’s terms of trade.
Chart B presents the range of structural terms of trade assumptions discussed above and also shows the terms of trade assumption used by McDonald et al (2010). From 2002-03, while the terms of trade was below the relevant long-run assumption, the structural level of the terms of trade is assumed to match the actual terms of trade. Prior to 2002-03 the structural level of the terms of trade is assumed to be the long-run average between 1972-73 and 2001-02.
Chart B: Structural terms of trade assumptions

Note: Post-boom average incorporates forward estimates. It is the average level of the terms of trade from 2003-04 to 2015-16. The terms of trade at 2029-30 is the level projected in the Government’s medium-term projections.
Source: ABS cat. no. 5206.0, McDonald et al (2010), OECD (2012), and Treasury.
4 Conceptually, there is no ‘structural’ level of domestic prices. The Reserve Bank of Australia targets future growth in consumer prices (that is, the rate of inflation) rather than the level of prices and – unlike the real economy, which cycles around full employment – there is no underlying path for domestic prices that the economy will revert to over time. As such, there is also no underlying path for nominal GDP, which is the volume of economic activity multiplied by the prices received for those activities.
5 This implies that the terms of trade fluctuates around a constant mean (similar to the output gap, which fluctuates around a mean of zero). In contrast, McDonald et al (2010) assume a higher mean for the structural terms of trade from 2002-03.
6 The OECD uses an elasticity of the budget balance to nominal GDP of 0.3, the IMF uses an elasticity of around 0.25 and McDonald et al (2010) uses a parameter of 1¼, which is multiplied by the receipts to GDP ratio of around 25 per cent, resulting in an elasticity of around 0.3.