Keynote address to the Australian Business Economists Forecasting Conference 11October 2006
David Gruen and Steven Kennedy1
Growth has been strong in the years since the global economic downturn of the early 2000s. The current rapid cooling of the United States housing market is likely to lead to a noticeable slowing in United States economic growth, but unlikely to lead to a recession, absent other significant adverse shocks. China is following an economic trajectory previously travelled by several of its East Asian neighbours. China’s economy is likely to continue to grow rapidly for a considerable time. Its rising incomes, extraordinarily high investment rates and rising urbanisation are leading to huge rises in demand for resources, fuelling the Australian mining boom.
Comparison with the previous Australian mining boom suggests that the huge investment surge associated with the current boom should soon generate strong growth in mining export volumes.
Introduction
Thank you for the opportunity to speak to you this afternoon. Let me begin my remarks with some broad overview comments about growth in the global economy.
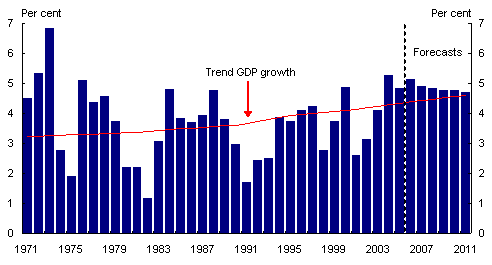
Output has expanded strongly in the years following the global downturn of 2001 and 2002. Global growth in 2004 recorded its strongest pace for over 30 years, exceeding 5per cent. Growth almost reached 5 per cent again in 2005, and is expected to exceed this rate in 2006 (Chart 1).
There is probably some gradual upward drift through time in the trend rate of global growth, because the share of large emerging economies with high trend growth rates, like China and India, is gradually rising. Nevertheless, the rate of global growth over the 3 years, 2004 to 2006, looks to be clearly above the global trend rate, even allowing for some upward drift. That, in turn, implies that the global output gap is now significantly smaller than it was a few years ago.
Chart 1: Global GDP growth
Source: IMF.
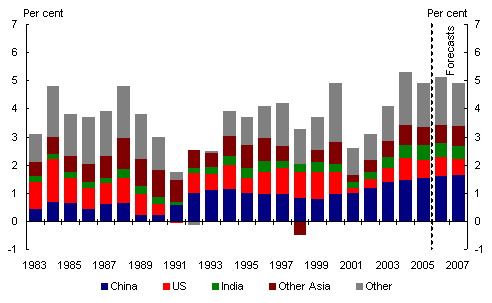
Notwithstanding this observation, the IMF is forecasting a continuation of strong growth out to 2011. Economic activity in most regions is meeting, or exceeding, earlier expectations — a statement that is particularly true for the large emerging economies of China and India. These economies have been major contributors to world growth in recent years, with China estimated to have contributed over 30 per cent of world growth in 2005 (Chart 2).
Chart 2: Contribution to global GDP growth
Source: IMF.
Over the usual macroeconomic forecasting horizon of a year or so, global growth is expected to become more balanced with the Euro area having gained momentum, Japan having finally convincingly emerged from its post-bubble malaise that had stretched on for a decade and a half, and developing countries continuing to generate impressive growth rates. The US economy, by contrast, is slowing, with the US housing market cooling rapidly.
There are uncertainties surrounding this outlook. After a number of years of strong global growth, I have heard it said that there are now more than the usual uncertainties. And it would be tempting to agree with that assessment were it not for the fact that it is hard to recall a time when there were less than the usual uncertainties.
But there are undoubtedly uncertainties. An obvious one relates to the historically unprecedented current account imbalances in many of the world’s largest economies, particularly the United States, and the question of whether large net foreign asset and liability positions can continue to build up without triggering some disruption in the world’s capital markets at some point. Added to that, one could mention continued volatility in the world oil market, as well as the inflationary pressures that are gradually building as a consequence of the closing of the global output gap.
Having given a brief overview of the state of the global economy, I want to focus in some detail on developments in the two economies that have been contributing the most to global growth in recent years, the United States and China.
United States
The rapid cooling of the US housing market over recent months, while not the only important development in the US economy at present, is clearly of considerable interest. It is this aspect of the US economy on which I will focus my comments today.2
Housing starts (known as commencements in Australia) fell by 19.8 per cent through the year to August and real housing investment fell by 1.5 per cent through the year to the June quarter. This has led a number of commentators to raise the possibility of a US recession. How seriously should we take this possibility?
Weakness in the housing sector has two principal implications for economic growth. The first is the direct effect of a fall in dwelling investment on overall activity. The second is the potential for falls (or at least little or no growth) in house prices to lead to a substantial slowing in consumption growth. The second implication — house prices affecting wealth and borrowing constraints, and in turn consumption — is the aspect of housing market weakness that most often concerns economists.3
To illustrate the potential for both aspects of a weak housing market to affect the US economy, it is instructive to draw comparisons with countries that have recently experienced housing booms and subsequent slowdowns. To do so, I will compare US outcomes with those in Australia, the United Kingdom, and the Netherlands.
All these countries have experienced large housing cycles and have at least some similar housing characteristics. Around 70 per cent of households in the US own a home, which is roughly the same proportion as in Australia and the UK, while for the Netherlands it is around 50 per cent.4 Furthermore, all these countries experienced rapid growth in house prices and an associated rapid rise in housing debt in their housing booms. The ratio of residential mortgage debt to disposable income in the US is currently close to 80 per cent while in Australia and the UK the comparable figure is over 100 per cent, and in the Netherlands over 200 per cent.
It is also relevant to note that variable interest rate mortgages are most common in Australia and the UK, while fixed-rate mortgages dominate the US and Netherlands markets.5
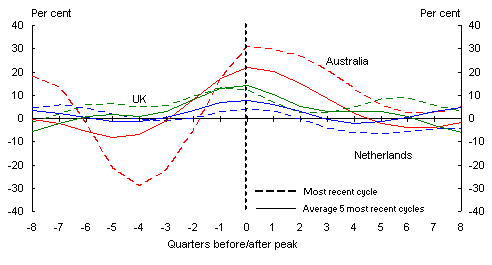
Let me start with an exploration of the implications of a slowdown in dwelling investment before moving to house prices and consumption. Chart 3 shows the most recent Australian, UK and Dutch dwelling investment cycles with the peak of each cycle dated as ‘quarter 0’. Dwelling investment at its peak was growing by around 30per cent through the year in Australia, 13 per cent in the UK, and 4 per cent in the Netherlands.6 Comparing these cycles with typical dwelling investment cycles for each country, we can see that the downturns in the most recent cycles were milder than usual in Australia and the UK, but slightly more severe than usual in the Netherlands.
Chart 3: Dwelling investment: Australia, UK, Netherlands
(through-the-year growth)
Source: OECD Quarterly National Accounts.
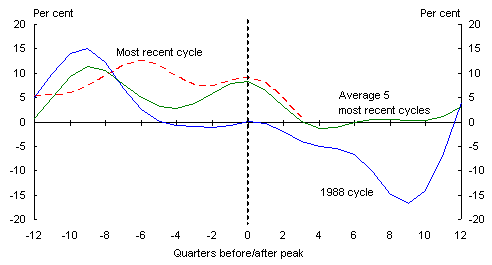
Turning to the US, Chart 4 compares the current US dwelling investment cycle with the average of the most recent five cycles.7 The peak of each cycle is again dated as quarter 0. US dwelling investment has fallen by an average of around 1.3 per cent in the first year of the past four US dwelling downswings.8 With dwelling investment currently making up around 6 per cent of US GDP, a fall of this size would subtract around 0.1 per cent from through-the-year growth in GDP, compared to an average contribution from dwelling investment of 0.2 per cent.9
Chart 4: Dwelling investment: United States
(through-the-year growth)
Source: US Bureau of Economic Analysis.
The largest US dwelling downturn in the last 30 years was in 1988-1991 when dwelling investment fell, at one point, by 17 per cent over a single year (Chart 4). If dwelling investment were to fall by this amount, it would subtract about onepercentage point from growth. Assuming the rest of the economy was growing at its trend rate, this would see US growth at an annual rate of around 2 to 2 per cent.10
In summary, even a significant fall in US dwelling investment is unlikely to lead to substantially slower growth or, in particular, a recession if growth in the rest of the economy is relatively unaffected.
The effects of flat or falling house prices on consumption and, more broadly, overall economic growth are, however, less clear than the direct effects of weak dwelling investment. But they are potentially more important. Chart 5 shows through-the-year growth in house prices for the US and the three comparator countries, with the timing convention the same as in earlier charts.11
Chart 5: House price growth
(through-the-year)
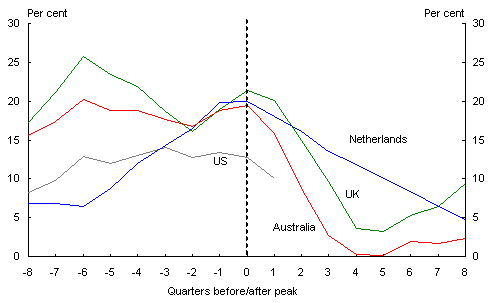
Sources: Australian Bureau of Statistics; Halifax; NVM, US Office of Federal Housing Enterprise Oversight.
House price growth peaked at around 20 per cent in all three comparator countries but, by this measure, the boom in US house prices has been much smaller, suggesting that the correction might also be smaller.12
For insights into how US consumption might respond to slowing house price growth, we can also examine consumption growth during these house price cycles.
Chart 6 shows the contribution to economic growth from deviations in consumption from its longer run (past 30 years) trend growth rate. As can be seen, consumption responded quite differently to the slowdown in house prices in the three comparator countries.
Chart 6: Contribution to GDP growth from consumption deviation from trend
(through-the-year)
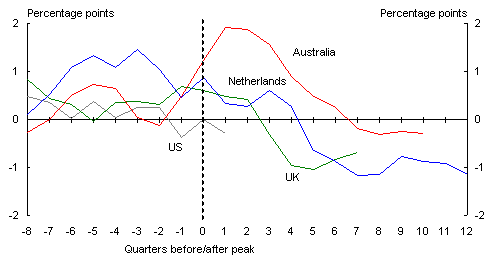
Sources: OECD Quarterly National Accounts; US Bureau of Economic Analysis.
For Australia, after rising sharply, consumption growth fell significantly following the slowdown in house price growth but with a lag. In the Netherlands, consumption growth also fell with a lag following the slowing in house price growth and grew well below its average rate for the subsequent three years. Interestingly, while consumption has remained weak in the Netherlands, house prices have recovered, growing over the past two years at close to their 20-year average rate.
The UK saw a more muted consumption response to the boom in house prices compared with the other countries and, likewise, a more muted consumption response to the slowdown in house price growth.
What has been the situation thus far in the US? Somewhat like the UK, US consumption growth rose only modestly above its longer run average during the housing price upswing. This again suggests that the US consumption slowdown might also be relatively modest.
Of course, there are many other factors at play in this analysis. For example, while housing wealth in Australia has grown roughly in line with growth in the housing stock since the house price boom ended, net nominal financial wealth has grown quickly (15 per cent per year since 2003), reflecting the commodity boom.13
This was not the case in the Netherlands where, as house-price growth was slowing, financial wealth dropped sharply — as a consequence of the collapse in share prices in Europe and the US with the bursting of the dot-com bubble. Furthermore, the external environment facing the Netherlands was also much less favourable. In contrast to Australia, the Netherlands’ external environment, the Euro area, was growing only sluggishly over the years 2001-03, providing a further dampening effect on domestic economic activity and consumption growth. And furthermore, in contrast to the other comparator countries, and to the US, monetary policy could not be used in the Netherlands to respond to the economic weakness arising from its housing slowdown, because the Netherlands belongs to the European Monetary Union.
My summary of this evidence is that it seems reasonable to expect a sharp cooling in the US housing market to generate a noticeable slowing in US economic growth over the next year or so.14 But it is hard to imagine a cooling in the US housing market, on its own, generating a US recession. For such an outcome to eventuate would, it seems to me, require some significant other adverse shocks — of the kind that hit the Netherlands economy at roughly the same time that its housing market was unwinding.
Looking further afield, what are the likely implications of a significant slowing in the US for growth in the rest of the world? While none of us can be sure, the gradual decline in the US economy’s share of global economic activity should lead us to expect a US slowdown to have less serious global implications than it once did.
The IMF (2006) recently undertook an analysis that suggests that a 1percentage point slowdown in the US could lead to a reduction in world GDP growth of around one half of a percentage point (about 0.2 percentage points directly and about percentage point from the impact on other countries). Hence, if the US slowed by around 1percentage point from current forecasts, to something around 2 per cent or less in 2007, the forecast for world GDP growth would drop from close to 5 per cent to around 4 per cent, which would still be a strong outcome.
China
Let me move on now from the likely developments in the US housing market over the next year or so to a topic best approached with a much longer timescale in mind:economic growth in China.
Continuing rapid growth in China, as well as other large developing economies, is arguably the international economic development with the most far-reaching consequences for the global economy. China is currently the world’s second-largest economy after the United States, and on plausible assumptions may become the largest within a decade or so.15
While China’s recent growth rates have been impressive,
they have not been markedly higher than those recorded in earlier decades by Japan, the East Asian newly industrialised economies (NIEs) (Hong Kong, Korea, Singapore and Taiwan), and ASEAN 4 (Indonesia, Malaysia, Philippines and Thailand), as shown in Chart 7.
Chart 7: Growth after takeoff
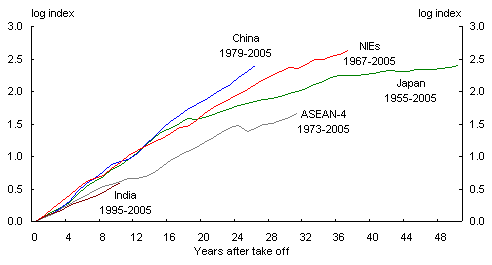
Note: Takeoff is the first year when the country experienced at least 10 per cent annualised growth in the value of exports over the previous three years.
Sources: IMF; WTO; Treasury.
Chart 8: Share of world trade after takeoff
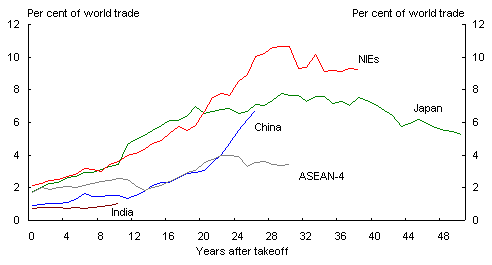
Sources: IMF; WTO; Treasury.
In terms of contributions to global trade, China’s share thus far has been less than Japan’s, at comparable stages after takeoff (Chart 8). China’s share is now almost 7percent, and is rising so rapidly that it is likely to soon surpass Japan’s peak share of world trade during its rapid development.
The process of ‘catch up’ in China is similar to that followed by Japan and the East Asian NIEs in past decades, namely moving towards the technologies, more market-friendly economic structures and, eventually, the standards of living of the developed economies. The catch-up phase in China may continue for longer, however, because the productivity gap between China and the advanced economies is larger than was the case for its East Asian predecessors at comparable stages after takeoff — primarily because the global productivity frontier has moved further out since the time of the rapid development of the other East Asian countries.
This line of argument suggests that China may continue to grow at around its recent average rates for quite some time to come, although it will undoubtedly experience inevitable bumps along the path to modernisation. Of course, such bumps often require adroit policy responses — to ensure that they remain ‘bumps’ and do not evolve into something more serious and long term.
Sustaining strong growth is likely to depend on continuing with internal reforms that may grow more demanding over time. In particular, China will need to press on with financial sector reform, and will also need to adjust to both the inevitable appreciation of its real exchange rate and the rapid ageing of its population. Much will depend on maintaining political and social stability through these processes of transition which will invariably benefit some groups, and some parts of the country, more than others.
China’s investment
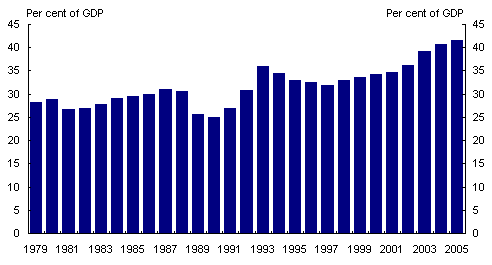
China’s growth in recent years has been supercharged by truly extraordinary rates of investment in physical capital. The rate of gross fixed capital formation has steadily risen over the past decade, and now accounts for over 40 per cent of GDP (Chart 9). The most recent available data suggest a continuation of this trend, with urban fixed asset investment 30 per cent higher (nominal, year-to-date) than a year ago.
Chart 9: China: Gross fixed capital formation
Source: CEIC China database.
While local government-directed investment (which most commentators suspect is relatively inefficient) remains important, high rates of investment are also being driven by broader economic forces. These include:
- extremely high rates of national saving, which are in part a response to the lack of a welfare safety net — something that is unlikely to change much for some time. This implies that China can sustain extremely high investment rates while still running current account surpluses;
- continued access to low-cost labour which, along with stability and good infrastructure, means that China continues to attract global manufacturing. China remains by far the largest emerging-market recipient of foreign direct investment, with net inflows forecast to reach US$86 billion this year (Economist Intelligence Unit); and
- the continuing process of urbanisation across China.
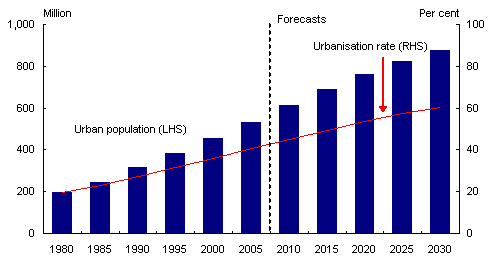
This final factor is particularly striking. China’s urban population has almost tripled over the past quarter-century, from around 200 million to around 530 million (Chart10). And despite the enormity of the numbers, 530 million still represents about 40 per cent of China’s population, so that urbanisation in China still has a long way to go. Indeed, far from being the most urbanised country in the developing world, China has a slightly lower proportion of the population living in urban areas than the average for low-income countries.
The UN estimates that China’s urban population will grow by over 60 per cent in the next quarter-century to around 875 million people or around 60 per cent of the total population. Most of this urbanisation is expected to take place in the less developed central and western regions of China.
Chart 10: China: urban population
Source: United Nations.
China’s demand for construction materials
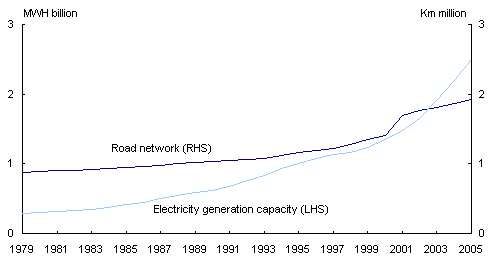
Growing urbanisation and rising incomes are leading to huge rises in demand for new housing and infrastructure, such as roads, electricity, and water and gas connections. For example, over the past quarter-century, China’s electricity-generating capacity has increased almost tenfold while the length of the road network has doubled (Chart 11). All of which is translating into a construction boom and a rapid increase in China’s demand for construction materials.
Chart 11: China: electricity generation capacity and road network
Source: CEIC China database.
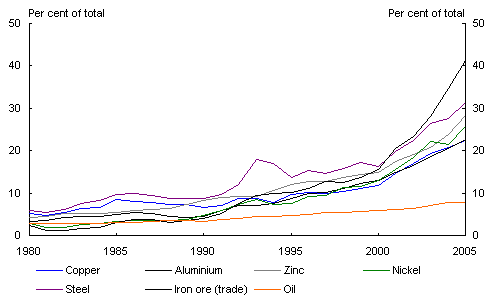
Similarly, Chinese demand is now having a dramatic effect on a range of globally traded commodities. For example, China currently accounts for about 30 per cent of the world’s consumption of zinc and over 40 per cent of the seaborne trade in iron ore (Chart 12).
Chart 12: China: share of world material demand
Source: Macquarie Research.
The implications of these huge increases in demand coupled with a sluggish response in global supply have been predictable — world prices have risen dramatically.
If China continues to grow over the medium term at the sort of rates we have seen over the past few decades, further sizeable increases in Chinese demand for commodities seem the most likely outcome.16 What that implies for world commodity prices will then, of course, depend on how rapidly global supply can rise to meet this rising demand (at prevailing prices).
An intriguing possibility, which presumes no serious derailing of the catch-up process in China and other large developing economies, is that commodity prices may remain relatively high — well above the average cost of production — for an extended period of time, providing a continuous incentive for raised levels of exploration and mining investment (Garnaut 2006).
The Australian mining boom so far
W
hich brings me to the implications for Australia.
If commodity prices do remain high on average for an extended period, this will have significant longer-run implications for the industrial structure of the Australian economy, and for regional patterns of economic activity — implications that have been spelt out in some detail in recent speeches by Ken Henry (2006a, b).
Rather than revisiting all these implications today, I want to spend the rest of my time taking a closer look at just one of them. I want to have a look at how the Australian mining boom has developed thus far, because there are some interesting tales to tell on this score.
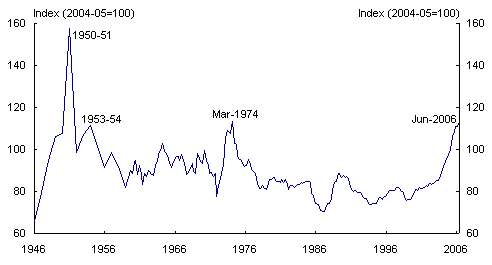
A good place to start this discussion is with the Australian terms-of-trade, the ratio of the prices we receive for our exports to the prices we pay for our imports (Chart 13).
Chart 13: Australia: terms-of-trade
Sources: Source: From September 1959: ABS National Accounts (cat. no. 5206.0), prior to September 1959: MWButlin (1977) ‘A Preliminary Annual Database’, RBA Discussion Paper 7701.
Australia’s terms-of-trade have now risen to the level we saw, briefly, 32 years ago in the March quarter of 1974. Remarkably, however, one has to go all the way back to the wool-price boom of the Korean war in the early 1950s for the last time when the Australian terms-of-trade were higher than they are now.
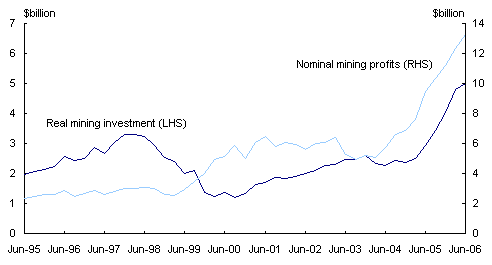
The main reason the terms-of-trade are currently so high is, of course, the sharp rises in non-rural commodity prices in recent years.17 These sharp price rises have generated huge profits in the mining sector, and a huge rise in the quantity of mining investment (Chart 14). Mining profits accounted for 5 per cent of GDP in the most recently available June quarter 2006 national accounts data, which is double their share a mere two years ago.
Chart 14: Australia: mining investment and profits
Source: Australian Bureau of Statistics.
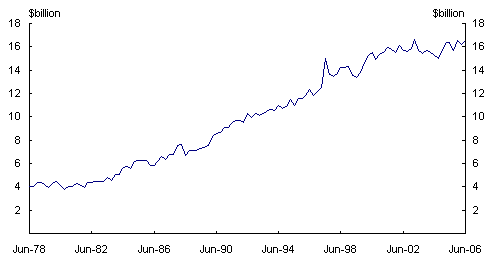
Thus far, however, the huge lift in mining investment has not generated much by way of increased mining production or exports, at least not for the sector as a whole. For example, the volume of exports of non-rural commodities, having risen strongly over the 1980s and 1990s, has shown almost no growth thus far in the 2000s (Chart 15).
Chart 15: Australia: exports of non-rural commodities
(volumes)
Source: Australian Bureau of Statistics.
This aggregate outcome does, however, mask an interesting compositional story. Chart16 shows export volumes for Australia’s main non-rural commodity exports since 2001-02, along with ABARE’s forecasts for the current financial year, 2006-07.
Chart 16: Australia exports of individual commodities
(volumes)
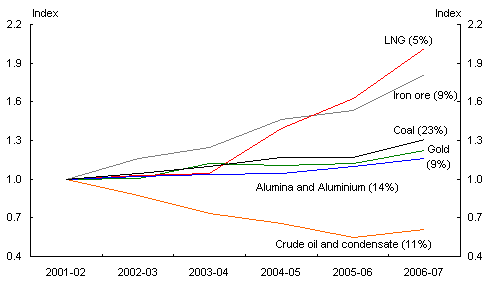
Note: Figures in parentheses show the share of each commodity in Australia’s non-rural commodity exports in 2001-02. Taken together, the commodities shown accounted for around 70per cent of non-rural commodity export values in that year.
Source: Australian Bureau of Agriculture and Resource Economics.
Over the most recent four years, 2001-02 to 2005-06, export volumes for a few non-rural commodities have grown quite strongly. Thus, the volume of liquefied natural gas (LNG) exports has grown at an average annual rate (compounded) of 13per cent over these fouryears, and iron ore export volumes at an annual rate of 11percent. Over the same period, average annual growth rates for export volumes have been slower for coal (4 per cent), gold (3 per cent) and alumina and aluminium (2per cent). By contrast, exports of crude oil and condensate have fallen at an average annual rate of 14 per cent over these fouryears, as production from Australia’s oil fields has fallen sharply.
Notwithstanding this compositional story, however, many commentators have been puzzled by the slow overall growth in non-rural commodity exports. To paraphrase their argument: shouldn’t growth in commodity export volumes have been stronger, given the huge lift we have seen in mining investment?
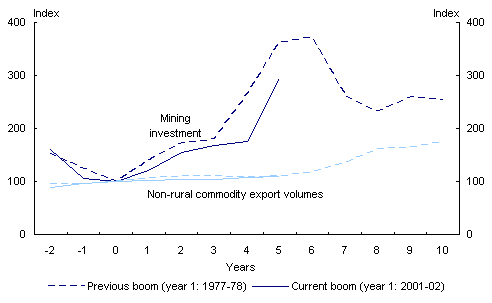
In attempting to answer this question one way or another, it is revealing to compare outcomes for real mining investment and non-rural commodity export volumes thus far in the current mining boom with those during Australia’s previous mining boom, in the late 1970s/early 1980s. For each boom, I define ‘year 1’ as the first year that saw double-digit real growth in mining investment — which was 1977-78 for the previous mining boom, and 2001-02 for the current one.
Chart 17: Two mining booms in Australia
Source: Australian Bureau of Statistics. Mining investment in 2005-06 is a Treasury estimate.
Using this timing convention, Chart 17 then shows the levels of real mining investment and non-rural commodity export volumes from year -2 onward for the two mining booms.18 As the chart shows, a slump in mining investment preceded both booms. Once the boom gets going, however, mining investment rises rapidly and by a huge amount. Mining investment in year 5 of the late 1970s/early 1980s boom was a factor of 3.6 higher than its level in year 0 (implying a compound annual growth rate of 29per cent over the five years), and a factor of 2.9 higher in the current boom (a compound annual growth rate of 24 per cent).
Turning to exports, growth in non-rural commodity export volumes has been remarkably similar in the two booms (at least up to year 5, the latest year for which the comparison can currently be made). Five years into the current mining boom (as defined here), export volume growth has been sluggish, but the same was true five years into the previous boom.19
Strong export growth did eventually occur in the previous mining boom, but in the second half of the decade following the start of the boom rather than in the first half of that decade.
If that experience provides a guide for the current boom, the sluggish growth in non-rural commodity exports we have seen over the past five years should not have come as a surprise. But the experience of the previous boom does suggest that we should anticipate strong growth in non-rural commodity export volumes over the next few years.
References
Butlin, M 1977, ‘A preliminary annual database: 1900/01 to 1973/74’, Reserve Bank of Australia Research Discussion Papers, no. 7701, May.
Garnaut, R 2006, ‘The China resources boom’, paper presented at the Australian Agriculture and Resource Economics Conference, Sydney.
Gruen, D 2001, ‘Some possible long-term trends in the Australian dollar’, Reserve Bank of Australia Bulletin, December, pp 30-41.
Henry, K 2006a, ‘Implications of China’s re-emergence for the fiscal and economic outlook ‘, Economic Roundup, Winter, pp 39-58.
Henry, K 2006b, ‘Economic policies
to address global pressures’, speech to the Australian Industry Group National Forum, Canberra, 14 August.
International Monetary Fund 2006 ‘United States: Staff Report for the 2006 Article IV Consultation’, IMF Country Reports, no. 06/279, July, Box 2, p 15.
Rae, D and van den Noord, P 2006, ‘Ireland’s housing boom: What has driven it and have prices overshot?’ OECD Working Papers, no. 20, June.
1 The views expressed are those of the authors and not necessarily those of the Australian Treasury. We are grateful to Robert Ewing, Angelia Grant, Stephen Joske, James McIntyre, Steve Morling, Hassan Noura, Martin Parkinson, Robert Seaton and David Turvey for help putting this talk together, and for helpful comments.
2 Another important development is the apparent slowing in the trend rate of US labour productivity growth which, if sustained, implies that the US is currently experiencing an adverse shock not only to aggregate demand (from the housing slowdown) but also to aggregate supply.
3 At least it is unless the housing market weakness also leads to serious stress in the financial system.
4 Figures from Rae and van den Noord (2006).
5 This observation is important for the US because a significant portion of the current stock of US housing market debt was locked in at fixed interest rates below their current level from mid-2002 to late 2005. As a consequence, US housing activity is likely to respond less to interest rate changes than activity in Australia or the UK, with their predominance of variable rate mortgages.
6 Quarter 0 in Chart 3 is March 2002 (Australia), June 2001 (Netherlands) and March 2003 (UK). The dynamics of the Australian housing cycle were complicated by the introduction of the GST which led to a sharp rise and subsequent fall in dwelling investment in 2000.
7 Unsurprisingly, the current cycle is included in the average only when the data allow. Quarter 0 for the current US cycle is September 2005.
8 This average is calculated over the year following the peaks in through-the-year growth in December 1988, June 1994, September 1996 and December 1998.
9 The ratio of dwelling investment to GDP in the US is similar to the ratios in Australia (6.3percent, June quarter 2006) and the Netherlands (6.7 per cent, March quarter 2006). The ratio in the UK is much smaller at around 3.5 per cent of GDP (March quarter 2006).
10 Similar calculations have been published recently by UBS in their US Economic Perspectives note, 22 September 2006.
11 The timing of the peaks in growth in dwelling investment and house prices differ somewhat, however. As reported earlier, quarter 0 in Charts 3 and 4 are March 2002 (Australia), June2001 (Netherlands), March 2003 (UK) and September 2005 (US), while for Chart 5 they are December 2003 (Australia), December 1999 (Netherlands), June 2004 (UK) and March2006 (US). Chart 6 uses the same timing as Chart 5.
12 The US house price series used for Chart 5 is a repeat-sales index. An alternative series from the National Association of Realtors shows a fall in median house prices of 1.7 per cent over the year to August 2006, but this series does not adjust for the changing composition of sales.
13 There is also a powerful regional dimension to the commodity boom, with Western Australia and Queensland benefiting at the expense of Victoria and New South Wales. This is being reflected in regional disparities in economic growth and house prices, among other things.
14 See also Box 1.2 in the IMF’s April 2006 World Economic Outlook, where it is suggested that a 10 per cent slowing in the rate of US real house price growth could slow real GDP growth by as much as 2 percentage points over the subsequent year.
15 These estimates are on a purchasing power parity (PPP) basis. This is the preferred basis for comparing the relative size of economies because it uses a conceptually appropriate approach to estimating prices in both the traded and non-traded sectors of the economies, in contrast to comparisons based on market exchange rates.
16 Continued rapid rises in demand for energy by China and other large developing economies will also have serious implications for growth in global greenhouse gas emissions, which highlights the importance of including these countries in global efforts to contain this growth.
17 High commodity prices are not, however, the only reason for the high terms-of-trade. Australia’s imports of information and communications technology (ICT) goods also tend to improve Australia’s terms-of-trade. While ICT goods account for only a small share of imports of goods and services (between about 5 and 8 per cent by value over the past twodecades), their prices have fallen sufficiently rapidly that they have improved Australia’s terms-of-trade by a little more than 1 per cent per annum in recent years (Gruen 2001). Furthermore, the huge rise in supply of low-priced manufactured goods from China and other developing countries has gradually reduced the price of Australian manufactured imports, further improving the terms-of-trade.
18 The ABS mining investment series excludes investment in the sub-sector ‘metals’, so metals are also excluded from non-rural commodity exports in the chart.
19 Although the results are not shown, gross value added by the mining sector evolves over time in much the same way as the volume of exports for both mining booms.