Rob Stewart1
The economic performance of the Pacific island countries has been, at best, mixed and in many cases quite poor for an extended period of time. Real GDP growth has been volatile with low average trend rates of growth. The Polynesian countries have generally performed better than Melanesia or Micronesia in terms of per capita GDP growth. Several of the Melanesian and Micronesian countries have experienced long-term decline, and very robust GDP growth would be required over the next 20 years simply to return their per capita GDP levels to previously achieved peaks.
Considerable challenges to economic growth and development remain. Against a substantial background of risks, some of which are exogenous, governments must prudently and effectively manage the factors which they can control to achieve the best possible economic outcomes.
Introduction
In recent years Australian Government involvement with the developing countries of the Pacific region has increased substantially as development challenges and threats to stability in some countries in the region have intensified. In this regard Treasury is participating in whole-of-government engagement programmes such as the Financial Management Strengthening Program/Economic Reform Unit under the Regional Assistance Mission to the Solomon Islands (RAMSI) and the Economic Advice and Governance Assistance Program (EAGAP) in Nauru. Treasury is also providing assistance to the economic and public sector reform stream of the whole-of-government Enhanced Cooperation Program (ECP) in Papua New Guinea. As part of this increasing involvement, Treasury has expanded its economic monitoring and assessment of Pacific island countries (PICs).
This paper provides a survey of economic growth in developing countries of the Pacific region, with a ‘snapshot’ focus on long-term economic performance using several selected economic indicators. Data paucity and concerns over the quality and consistency of available data prevent a comprehensive and detailed analysis of economic performance and prospects across the PICs.2 Lack of data may also be contributing to some citizens and governments in the Pacific not clearly perceiving the extent of slippage in their relative living standards.
The rest of the paper is structured as follows: the next section provides a brief overview of key characteristics of the PICs, highlighting the region’s great diversity. Following this, economic growth performance in the PICs over the long term is analysed. The mid-1970s has been chosen as a general starting point as most PICs achieved political independence from the early 1970s onwards.3 A few comments on trends in the data at the country and sub-regional levels are provided, and several other issues and indicators of economic performance are also briefly discussed before concluding the paper.
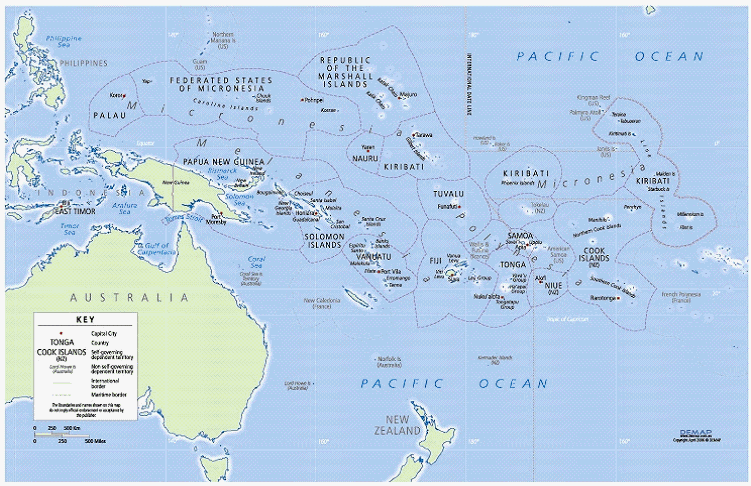
Chart 1: Map of the Pacific
Characteristics of Pacific island countries
The PICs are widely dispersed over a very large geographical area. Out of a total PIC population of almost 8 million people, more than 90 per cent live in the four Melanesian countries of Papua New Guinea, Solomon Islands, Vanuatu and Fiji. As shown in Table 1, in terms of size and population Papua New Guinea, with a population of 5.8 million and a land mass of 463,000 square kilometres, clearly dominates the PICs. At the other end of the scale Nauru with a land mass of just 21square kilometres and Niue with a population of just 2,000 are amongst the smallest countries in the world.
Although the total land mass of the PICs amounts to almost 530,000 square kilometres, the total Exclusive Economic Zone (EEZ) area covered by these ocean-bounded countries is huge — at more than 20 million square kilometres the combined EEZ is almost forty times that of the total land mass.
In addition to large differences in geographic size and population, diversity is a defining characteristic of the Pacific. Ethnic, social, economic, political, cultural, geographic, environmental and natural resource diversity typifies the Pacific region. Ethnic heterogeneity in the Pacific is reflected in the sub-regional classifications of countries into: Melanesia (Papua New Guinea, Solomon Islands, Vanuatu and Fiji); Micronesia (Palau, Federated States of Micronesia, Republic of Marshall Islands, Kiribati and Nauru); and Polynesia (Samoa, Tonga, Cook Islands, Tuvalu and Niue).
The PICs are highly dependent on natural resources with the majority of people predominantly reliant on subsistence agriculture and fishing. Some countries, particularly in Melanesia, have significant mineral resources and exploitable forestry assets. Most of the countries have significant coastal and offshore marine resources. The richest tuna fishing grounds in the world are found in the Pacific region.
The great diversity in the Pacific region creates some difficulties when analysing economic performance. For example, incomes vary greatly from the upper middle income (UMIC) range for countries including Palau and the Cook Islands, lower middle income countries (LMIC) such as Samoa and Tonga down to low-income countries (LIC) such as the Solomon Islands.4
Table 1: Pacific Countries: Land mass and population
|
Landmass (km2) |
Exclusive Economic Zone (‘000 km2) |
Population |
Population density (‘000 people perkm2, 2004) |
Population growth rate (annual average per cent growth, 1990-2004) |
GDP per capita (US$, 2004) |
|
|
Cook Islands |
240 |
1,800 |
18 |
75 |
0.6 |
|
|
Fiji |
18,300 |
1,290 |
840 |
46 |
1.0 |
2,258 |
|
Kiribati |
811 |
3,600 |
98 |
134 |
2.2 |
532 |
|
Marshall Islands |
181 |
2,131 |
61 |
340 |
1.9 |
1,703 |
|
Micronesia, Fed. States |
702 |
2,978 |
110 |
157 |
2.0 |
2,016 |
|
Nauru |
21 |
320 |
13 |
632 |
0.6 |
|
|
Niue |
260 |
2 |
7 |
-2.2 |
||
|
Palau |
458 |
629 |
20 |
44 |
2.0 |
6,360 |
|
Papua New Guinea |
463,000 |
3,120 |
5,772 |
13 |
2.5 |
604 |
|
Samoa |
2944 |
120 |
184 |
65 |
0.8 |
1,379 |
|
Solomon Islands |
28,900 |
1,340 |
466 |
17 |
2.8 |
636 |
|
Tonga |
748 |
700 |
102 |
142 |
0.4 |
1,678 |
|
Tuvalu |
26 |
1,300 |
10 |
371 |
1.6 |
|
|
Vanuatu |
12,200 |
710 |
207 |
17 |
2.7 |
1,151 |
|
TOTAL |
528,791 |
20,037 |
7,903 |
15 |
2.2 |
≈900 |
Sources: World Bank, World Development Indicators (AusAID 2006).
As such, benchmarking economic performance for the Pacific region as a whole by using international comparisons is problematic and risky. In this paper some use is made of comparisons of PIC performance against the aggregated Low and Middle Income (LMI) and Sub-Saharan Africa (SSA) data provided by the World Bank’s World Development Indicators (WDI), (World Bank 2006a), as well as comparisons with Australia. However, comparisons are used purely for the purpose of providing some international context setting. The paper does not use comparisons for benchmarking or critical assessment of PICs.
Despite the diversity of the PICs they have many similar characteristics and face a number of similar constraints and economic issues. Some of the more significant common characteristics and issues include: remoteness and isolation; susceptibility to natural disasters such as cyclones and droughts and vulnerability to commodity price fluctuations; history of colonial experience; narrow economic bases and reliance on natural resources; low economic growth rates; youthful populations; variable but often poor social indicators and poor delivery of public services; high trade shares in GDP, reflecting in particular very high import ratios; fiscal pressures and large public debts; and a dominant role for the public sector in the formal economy.
Economic growth
A key finding in current economic literature on the Pacific is that, while some countries have performed better than others, overall the Pacific region has performed poorly in terms of economic growth and, more importantly, not achieved its growth potential (Chand 2006; AusAID 2006). Economic growth in the Pacific is also highly volatile, reflecting a range of factors such as narrow economic bases, dependence on a few commodity exports (agricultural, forestry, fishing and minerals) being sold into often volatile international markets in which the PICs are price-takers, the impact of natural disasters such as cyclones, and poor governance and political (and policy) instability.
GDP growth
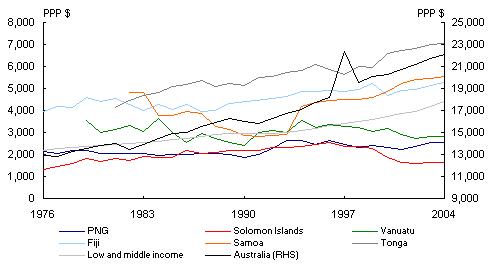
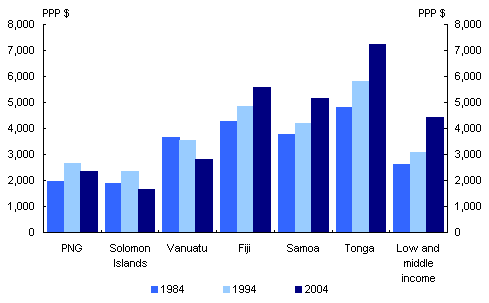
Both Market Exchange Rate (MER) and Purchasing Power Parity (PPP) measures of GDP are used in the GDP growth and per capita GDP growth charts below (Charts 2 to6). PPPs, which adjust for differences in price levels, are the preferable measure for economists and statisticians to use when comparing GDP and standard of living performance across countries. However, due to data constraints (for example percapita GDP in PPP was not available for Micronesian countries) both MER (Charts 2, 3 and 4) and PPP (Charts 5 and 6) analysis of GDP performance is provided.5
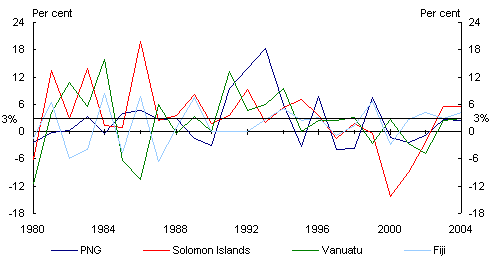
Charts 2 and 3 show economic growth performance in US dollars, at the country level, for Melanesia, Micronesia and Polynesia respectively, over the period 1980-2004. Chart2 shows GDP growth in Melanesia has been highly volatile over the last 25years. Real GDP growth has generally fluctuated in a band of -6 to 6 per cent. Two recent points which stand out in Chart 2 are: 18 per cent GDP growth in Papua New Guinea in 1993, driven by a booming mining and oil sector; and a 14 per cent decline in GDP in the Solomon Islands in 2000, during a period of civil conflict. Over the s
ame period, real GDP growth in Australia varied between -2 and 5 per cent.
Per capita GDP performance
As shown in Table 1 Melanesia’s annual population growth rates are well above 2percent (excluding Fiji). Therefore, as an approximate indicator, when GDP growth is below the 3 per cent horizontal line in Chart 2 per capita GDP is likely to be virtually flat or falling. With the exception of Fiji, stagnant or declining per capita GDP has been the experience for Melanesia over the survey period.
Chart 2: Real GDP growth — Melanesia
Source: World Development Indicators.
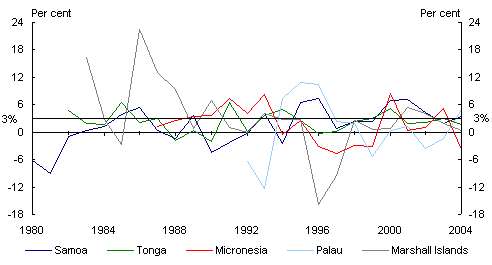
Chart 3 shows that GDP growth in Polynesia and Micronesia has also been volatile, although the most severe volatility has been experienced in Micronesia and in the Marshall Islands in particular. Polynesian growth has been relatively more stable.
Chart 3: Real GDP growth — Micronesia and Polynesia
Source: World Development Indicators.
All of the countries in Charts 2 and 3 have experienced significant periods of GDP growth at rates below 3 per cent. However, Polynesia’s population growth rates (Table1) have been lower than those of Melanesia and Micronesia. Therefore, similar GDP growth rates in Melanesia and Polynesia yield very different per capita GDP outcomes, which is shown below in Charts 4 to 6 and Box 1.
|
Box 1: Population growth and GDP per capita in the PICs: 1970 to 2004 Population growth rates in the Pacific vary considerably, from -2.2 per cent in Niue (due to substantial emigration to New Zealand) to a very high 2.8 per cent in the Solomon Islands (see Table 1). The Melanesian countries of Solomon Islands, Papua New Guinea and Vanuatu have the highest population growth rates while the Polynesian countries have low population growth rates. Lower population growth in Polynesia is partially a result of emigration, whereas very little emigration occurs from Melanesia. However, fertility rates in Polynesia are also lower than those in other PICs. In combination, substantial emigration and lower fertility rates in Polynesia contribute to relatively lower overall population growth in comparison to Melanesia and most of Micronesia. High population growth rates produce population profiles with a large proportion of young people, as seen in Melanesia. However, Polynesian population profiles also contain a large proportion of young people as a large percentage of emigrants are adults. Overall, around 60 per cent of the total current PIC population is under 25years of age, which is very high compared to developed countries. However, a demographic shift in population profiles has been occurring in the Pacific over the past 30 years. Considerable improvement in life expectancy in most PICs has occurred as fertility and mortality rates have declined. As a result, the percentage of children (under 15 years) in population profiles has decreased. Correspondingly, the proportion of people of working age (15-64 years) has increased, and the proportion of youth of working age (15-24 years) is particularly high in some PICs. This ‘youth bulge’ into working age groups has exacerbated unemployment problems (see Box2) and contributed to social tensions. However, if declines in fertility and mortality rates are maintained the high proportion of children and young adults in PIC population profiles should gradually reduce over time. GDP per capita is simply the total value of GDP divided by the number of people in a country. Therefore, the higher the rate of population growth the higher the rate of GDP growth required to achieve a certain level of GDP per capita. As the GDP charts (Charts 2 to 6) show, while the trend in GDP growth performance across the PICs has only been modest at best over the survey period, GDP per capita growth has varied substantially as a result of much higher population growth rates in Melanesia in comparison to Polynesia. |
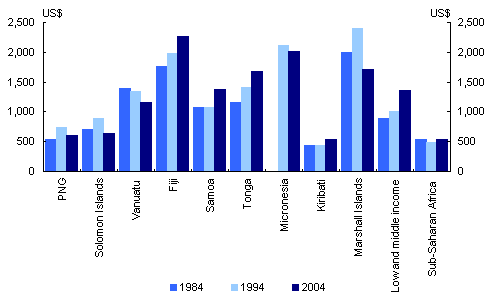
Chart 4 shows per capita GDP in US dollars at several points between 1984 and 2004. This chart should be read with caution given the volatility of Pacific GDP growth. With this caveat in mind, some tentative observations can be made. Firstly, divergence in sub-regional performance is noticeable with real per capita GDP in the Melanesian countries in 2004 being either lower or only slightly higher than in 1984. The exception is Fiji with 2004 per capita GDP about 30 per cent higher than it was in 1984. Of the two Polynesian countries shown, Tonga’s per capita GDP has grown solidly, and Samoa’s per capita GDP has increased significantly over the last decade following the impact of a substantial period of economic reform commencing in the mid-1990s.
Chart 4: Real GDP per capita — market exchange rates
Source: World Development Indicators.
The situation in Micronesia is one of stagnating or declining per capita GDP. The relatively high absolute level of per capita GDP in the Federated States of Micronesia and Marshall Islands is underpinned by very substantial aid flows provided by the United States under a Compact of Free Association.6 Another beneficiary of the Compact with the United States, Palau, has a much higher per capita GDP (US$6,336 in 2004).
In absolute terms Chart 4 shows per capita GDP performance in Kiribati, Papua New Guinea and Solomon Islands is similar to or slightly above that of the SSA average. The better performers, Fiji, Tonga, and more recently, Samoa have per capita GDP levels at around or significantly higher than the LMI average, and have grown at a similar rate to the LMI average over the period in question.
Chart 5 shows GDP growth performance expressed in PPP. Available data allowed for analysis of Melanesian and Polynesian countries only. The chart shows that there has been significant divergence in performance between the Melanesian and Polynesian countries. The early-to-mid 1990s represents a particularly significant turning point. Samoa had been undergoing a substantial and severe economic decline from the 1970s into the 1990s. Government debt had built to more than 90 per cent of GDP by 1994. The sharp turnaround in Samoa’s performance occurs at around the time a major macroeconomic stabilisation and structural reform programme commenced. At around the same time, the Melanesian economies (excluding Fiji) began to decline significantly— creating the divergence along Melanesian and Polynesian lines shown from 1994 onwards. From the mid-1990s onwards the Polynesian countries and Fiji have grown at about the rate of, or better than, the LMI average while the other Melanesian countries have declined.
Chart 5: Real GDP per capita — purchasing power parity
Source: World Development Indicators.
Chart 6 also shows real per capita GDP in PPP terms. A comparison of Chart 4 with Chart 6 shows that all of the countries have PPP per capita GDP levels several times higher than per capita GDP levels at market exchange rates. However, Melanesia (excluding Fiji) is still stagnating or declining on the PPP measure.
Chart 6: Real GDP per capita — purchasing power parity
Source: World Development Indicators.
Overall, long-term GDP growth performance across the PICs has been volatile with generally low average rates of GDP growth, whether measured in PPP or market exchange rate terms, with the Polynesian countries performing better than other PICs. Most Micronesian and Melanesian countries have performed far less strongly, with several of them in long-term decline with current per capita GDP levels well below their historical high points.
In some Melanesian and Micronesian countries many years of sustained growth would be required just to return per capita GDP levels to previous high points. For example, in local currency terms, to re-attain its per capita GDP high point of 804 Kina in 1994 Papua New Guinea will require average annual real GDP growth of around 3.3percent (0.8 per cent per capita GDP growth) until 2025. Similarly, Solomon Islands would require annual average GDP growth of about 4.6 per cent (peak of SBD$6,709 in 1980) and the Marshall Islands would require annual average GDP growth of more than 5 per cent (peak of US$1,557 in 1995). Given the volatility in actual GDP growth and the fact that annual GDP growth rates have generally averaged less than 3 per cent in these countries over the survey period7, sustaining the average GDP growth rates required for the number of years required would be a significant achievement. However, even if this was achieved it would only mean that, by 2025, per capita GDP levels would be back to where they were many years earlier— in the case of Solomon Islands 45 years earlier (1980).
Agriculture, industry and services sectors
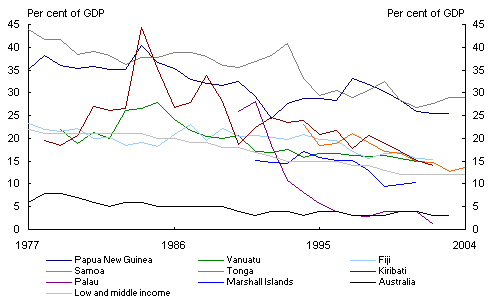
The agriculture sector still dominates private sector economic activity in many PICs, and particularly so when subsistence agriculture is taken into account. However, the share of agriculture in measured GDP has declined. Chart 7 shows a declining trend in the share of agriculture in GDP in all the PICs over the survey period. Agriculture contributed 44 per cent of value added to GDP in Tonga in 1977, compared with the then LMI average of around 22 per cent. By 2004 the agriculture share in Tonga had fallen to 29 per cent of GDP compared with the LMI average of just 12 per cent.
While the share of agriculture in Pacific GDP has declined, it remains above the LMI average in most of the countries shown in Chart 6 as the LMI average has also been declining. Therefore, despite trending downwards over the full survey period, the share of agriculture in GDP in Papua New Guinea and Tonga was still around twice that of the LMI average in 2004. As the share of agriculture in GDP has been declining in the PICs the proportional share of GDP from industry and/or services must have been increasing.
The WDI data show that the contribution to GDP from industry has remained reasonably stable and relatively low at between 12 to 20 per cent over the survey period. Two exceptions have been the more industrialised economies of Fiji and Samoa where the industry share of GDP has been higher, at around 27 per cent for both countries in the early 2000s. Given economic constraints, it is not surprising that industry plays a relatively small role in the production structure in most PICs. Winters and Martin (2004) have found that the cost disadvantages for manufacturing faced by micro and very small economies are very large. They find that cost premiums, due to factors such as high transport and utility costs, mean that manufactured products from micro and very small economies will generally not be internationally price competitive. They also find that even if wages were zero in a micro economy, total manufacturing costs would generally still exceed world prices. And most of the PICs are classified as micro or very small in the Winters and Martin methodology.8
The services sector in most Pacific countries has grown over the survey period. For the countries for which data is available the contribution of the services sector is high in all three Pacific sub-regions. The highest service sector shares in GDP are in the Micronesian countries — reaching almost 90 per cent of GDP in Palau in 1997. However, the service sector also provides a very large share of GDP in Melanesia, reaching around 75 per cent in Vanuatu in the early 2000s. Even in the more industrialised countries of Fiji and Samoa the service sector share of GDP is large at around 60 per cent of GDP in the early 2000s.
Chart 7: Agriculture’s share of GDP
Source: World Development Indicators.
While the size of the services sector in many PICs is large, this does not mean PIC economies are similar to those of more advanced countries which tend to have strong, if not dominating, services sectors. The available data do not fully account for the contribution, and importance, of subsistence agriculture to total economic activity in the PICs. Also, while private sector services such as international tourism are playing an increasingly important role in some PICs, the services sector is generally narrowly based and dominated by government services with the private sector often playing only a relatively minor role.
The dominant role of the public sector can also adversely affect the private sector. State-owned enterprises against which competition is restricted are widespread in some Pacific countries, limiting scope for private sector involvement. In addition, services such as electricity, water supply and telecommunications, provided through government utilities, are often inefficient and expensive. Further, relatively high public sector wages tend to drive up wage rates in the private sector. Government is the dominant formal sector employer, accounting for about one-third to two-thirds of formal employment, across the PICs. In combination these factors contribute to an environment which can crowd out potential private sector activity.
Urbanisation
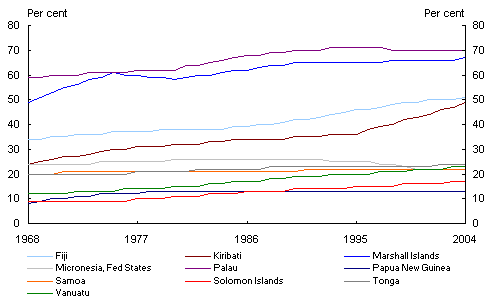
Chart 8 shows a definite urbanisation trend for most PICs over 1968 to 2004. The process of urbanisation has been strongest in Fiji and more recently in Kiribati. Papua New Guinea exhibits a flat urbanisation rate of around 13 per cent from 1978 onwards. However, the population in urban areas in Papua New Guinea, such as Port Moresby, has been growing rapidly on the back of very fast total population growth. The northern Micronesian atoll countries of Palau and the Republic of the Marshall Islands have the highest urbanisation rates due to their small land masses, lack of agricultural land and high relative population densities. The Melanesian countries (excluding Fiji) have the lowest urbanisation rates which is at least partially explained by the still dominant role of agriculture, including subsistence agriculture, in Melanesia. However, rapid urban growth and the problems it can generate are in fact pressing issues in Melanesia (see Box 2).
Chart 8: Urbanisation in the PICs: 1960-2004
Source: World Development Indicators.
The recent rise in urbanisation in Fiji may be at least partially attributable to the fact that many sugar cane leases are not being renewed on expiration. This is likely to be resulting in at least some former sugar cane leaseholders and employees, primarily Indo-Fijians, moving into urban areas in search of work
. Fiji’s relatively high population density and higher level of industrialisation in comparison to the rest of Melanesia may also be playing a role in its higher urbanisation rate.
|
Box 2: Unemployment, urbanisation and agriculture in the PICs Unemployment is a major and growing concern in the PICs, and is a particularly acute problem in Melanesia. Measurement of unemployment in the Pacific is difficult due to the dominance of subsistence agriculture in many countries and the ability of labour to move in and out of the formal economy. Notwithstanding this difficulty there is ample evidence pointing to a serious and growing problem of unemployment, particularly youth unemployment in urban areas. As far back as 1990 the Papua New Guinea census ‘found that 30 per cent of the urban workforce identified itself as unemployed’ (Levantis 1997). Male youth joblessness (a combination of male youth unemployed and male youth outside the workforce altogether and not studying) is estimated to be as high as 42 per cent in the Republic of the Marshall Islands (AusAID 2006). Urban populations in most PICs are growing as the relative contribution of agriculture to total GDP has been declining. While the urbanisation process itself is only moderate in some countries and almost flat in others such as Samoa, urban population growth is a significant issue particularly in some of the Melanesian and Micronesian countries where population growth rates are high. For example, the urbanisation rate in Papua New Guinea grew only modestly from 8 to 13 per cent over the 36-year period 1968 to 2004, and has been stable since around 1978. However, over this period Papua New Guinea’s total population has nearly tripled from 2 million to almost 6 million. This means a total urban population of around 197,000 in 1968 had increased to 771,000 by 2004 — an increase in the actual urban population of almost 400 per cent. Agriculture has limited capacity to absorb efficiently and effectively absorb a rapidly growing labour supply. Unless there is rapid growth in off-farm economic activity and employment, it is likely that total employment opportunities in the rural sector will not be sufficient, particularly as agriculture itself declines in terms of its share of GDP. Employment opportunities in agriculture may be further constrained to the extent future agricultural prospects in the PICs depend on the ability to sell produce into international markets. ‘In terms of employment, internationally competitive crops often are land and capital intensive, not labour intensive’ (Polaski2005). A lack of economic and employment opportunities in rural areas will result in people, particularly young, physically mobile people, moving into urban areas to seek paid work. In some cases decisions to move to urban areas may also be motivated by perceptions that better and more highly paid work will be available, rather than a sense that no opportunities at all exist in rural areas. In fact, ‘Melanesians rightly worry that urban incomes are now 10 to 16 times higher than rural ones and the gap is increasing’ (Duncan and Chand 2002). While incomes may be higher in urban areas, this requires finding gainful employment. In this respect perceptions may be very different to reality, as the increasing number of openly unemployed people in urban areas in many PICs attests. Narrowly based urban centres, often dominated by government sector activity, are not providing sufficient employment opportunities for swelling urban populations. AusAID (2006) estimates that, assuming there is no net employment growth in agriculture, annual growth in employment required from elsewhere in the economy over the period 2004-2020 would need to be 11 per cent in Papua New Guinea just to prevent the level of joblessness from worsening.9 For Solomon Islands and Vanuatu annual non-agricultural employment would need to grow by 4.5 and 7 per cent, respectively. However, the World Bank (2006b) projects total formal sector employment will grow by just 10 per cent, 7.6 per cent and 10 per cent in Papua New Guinea, Solomon Islands and Vanuatu, respectively, between 2004 and 2015, which equates to annual employment growth of less than 1 per cent in all three countries. This strongly suggests that, assuming there is not employment growth in agriculture, employment growth in the formal sector will be insufficient to prevent the level of joblessness from rising. |
Natural resource exploitation
In addition to agriculture, private sector economic activity in the PICs is predominantly based around exploitation of natural resources such as mining, forestry and fisheries. Almost all of the PICs are dependent on primary commodity exports and exploitation of marine resources. Over the past decade, despite volatility, the mining and petroleum sectors have contributed significantly to Papua New Guinea’s total exports, government revenue and GDP. However, there are serious concerns over the sustainability of current levels of natural resource exploitation in the PICs. For example, AusAID (2006) states that ‘in the Solomon Islands and Papua New Guinea logging continues at two to three times the “sustainable yield” and the major natural, accessible forests in both countries are likely to be logged out by 2020 or earlier’.
Tourism is also an increasingly important and growing export in many PICs, and possible tensions between natural resource exploitation and tourism prospects could arise. Tourism marketing in the Pacific is heavily focused on access to pristine environments with clean beaches, natural forests and marine attractions. Over-exploitation of the natural environment, for example through unsustainable logging practices which destroy natural amenity, may negatively impact on long-term tourism potential.
Fiscal pressures
Many PICs face fiscal pressures due to structural rigidities in their budgets. On the revenue side annual collections fluctuate widely, as revenue sources are typically narrowly based and dependent to at least some extent on earnings from commodities for which prices can vary greatly. On the expenditure side, structural rigidities can make it difficult to adjust expenditures, notably public sector wage bills, quickly in accordance with revenue shortfalls. Large government sectors, inflexible budget structures and political pressure not to cut public sector wage bills, can result in fiscal deficits when pressures emerge on the revenue side. Conversely, when revenue exceeds expectations (for example due to favourable commodity price changes) additional expenditure is usually relatively easily achieved. Over the survey period, while there have been some exceptions, fiscal deficits have been common occurrences. During the 1990s, and into the 2000s fiscal deficits have generally been the norm for most of the PICs. The Marshall Islands, running large fiscal surpluses over the second half of the 1990s, is the key exception, and Samoa has managed to run close to fiscal balance, with small surpluses or deficits of up to about 2 per cent of GDP, since commencement of its major economic reforms in the mid-1990s. External debt levels in 2005 varied from around 11 per cent of GDP in Fiji to more than 70 per cent in the Marshall Islands (Browne 2006). However, even in countries with high external debt levels, debt servicing is usually not a significant problem as most external public debt is concessional and held by international financial institutions such as the World Bank and Asian Development Bank.
Government expenditure as a percentage of GDP tends to be much larger in smaller PICs with smaller populations because they are less able to exploit economies of scale in the provision of public goods and services, and as per capita aid flows are higher in the smaller PICs it is relatively easier for them
to fund larger public sectors. Differing community attitudes to the role of government also influence the size of government and public sectors.
Central government revenue and grants as a share of GDP in 2005 were 22 per cent in Vanuatu, 26 per cent in Fiji and 28 per cent in Papua New Guinea, while there were more than 50 per cent in the Marshall Islands, Federated States of Micronesia and Palau. In Kiribati central government revenue and grants in 2005 equated to 123percent of GDP. Central government expenditure and net lending are of a similar magnitude, ranging from 21 per cent of GDP in Vanuatu to between 50 to 60 per cent in the Marshall Islands, Federated States of Micronesia and Palau, while in Kiribati the level of central government expenditure was 146 per cent of GDP (Browne 2006).
External accounts
The PICs are highly open economies, at least partially due to necessity as their domestic production bases are narrow. The import share of trade in goods and services in GDP for PICs fluctuates between around 40 to 90 per cent of GDP over the survey period. This is well above the 15 to 30 per cent LMI average and the average of just over 20 per cent in Australia in 2004. On the export side the PICs also generally have shares of GDP above the LMI average and Australia’s, but well below the import share— at around one-third to one-half the level of the import share, making large deficits in the goods and services trade balance common occurrences across the PICs. In addition, declining trade preferences are placing severe competitive pressures on key export industries in some countries such as sugar and textiles in Fiji, which may add pressure on trade deficits. Large trade deficits can dominate the current account, even when prices for commodity exports are high, and current account deficits can be very large. For example the current account deficit in 2005 was 12.1 per cent and 10.8per cent of GDP in the Federated States of Micronesia and Solomon Islands, respectively (Browne 2006). While PIC economies are already highly open in terms of import penetration and, to a lesser extent, exports, this says nothing about taxation levels on imports and exports or other distortions and restrictions on trade such as quarantine and customs measures.
Notwithstanding that small PIC economies are open and vulnerable to external shocks and irrespective of the various types of currency regimes adopted (see Box 3), balance of payments crises are rare in the Pacific. Exchange rate mechanisms have generally been allowed to adjust in response to macroeconomic imbalances. Gross foreign exchange reserves are generally maintained above commonly cited threshold levels of around three months of import cover without difficulty. Large aid flows and remittances also help to ameliorate the impact of adverse events.
Local Pacific currencies have generally declined (depreciated) against the United States dollar over the survey period. The WDI data also show that real effective exchange rates have declined over most of the survey period with increases (appreciation) occurring only in more recent years — from around 2001. Depreciating real exchange rates should, all things being equal, improve export competitiveness. However, the data generally do not show a strong positive correlation between depreciating PIC exchange rates and increasing exports as a percentage of GDP. This suggests a range of other factors such as inadequate infrastructure, high transport costs, lack of marketing facilities, product quality issues and regulatory and other constraints may be limiting production and export supply responses.
Aid and remittances
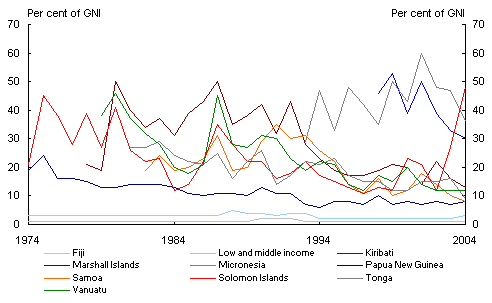
Chart 9 shows the contribution of aid to Gross National Income (GNI) in selected Pacific economies. Several observations can be made. First, in comparison with the LMI average, aid is a much more significant proportion of GNI in the Pacific. Second, the provision of aid to the Pacific is highly volatile as a percentage of GNI, although such volatility may be partially, if not predominantly, attributable to the observed high degree of volatility in economic growth in the PICs, rather than high volatility in actual yearly aid flows.10 Third, excluding the northern Micronesian countries a definite downward trend in aid as a percentage of GNI can be discerned in the PICs over the 30-year survey period, with Kiribati experiencing the most substantial decline. The recent very substantial increase in aid to the Solomon Islands goes against the general trend and reflects substantial increases in aid from 2003 onwards under the Regional Assistance Mission to the Solomon Islands (RAMSI). Finally, the northern Micronesian countries have the highest aid levels as a percentage of GNI, reflecting the very substantial aid payments they have received from the United States under the Compact of Free Association. Some of the PICs also receive very high aid in per capita terms. In 2003 per capita aid to Oceania was US$216 while for Africa it was US$31 (Radalet, Clemens and Bhavnani 2005). However, more than 90 per cent of the PIC population live in Melanesia, 75 per cent of whom live in PNG alone where per capita aid was US$40 in 2003.
Chart 9: Aid as percentage of GNI: 1974-2004
Source: World Development Indicators.
The size of aid flows to the PICs may create macroeconomic management challenges, and large aid flows to the PICs have been criticised as creating ‘Dutch Disease’ impacts, such as overvalued exchange rates which reduce international competitiveness in PIC economies.
Remittances are also a major external source of income for some Pacific countries, particularly the Polynesian countries. For example, in 2004 net official remittances in Tonga contributed almost 24 per cent of GNI. However, in the Melanesian countries of Papua New Guinea, Vanuatu and Solomon Islands net official remittances in 2004 were actually negative at -3.2, -2.7 and -1.5 per cent, respectively.11
Investment
Investment in the PICs is relatively low with total investment ratios generally around 15 to 20 per cent of GDP, which is well below the average of around 30 per cent for all developing countries. The Foreign Direct Investment (FDI) component of investment is also low with FDI/GDP ratios ge
nerally below 10 per cent in most PICs. Complex rules and regulations concerning business operations are major problems throughout the PICs which act as a disincentive to private sector activity and investment. Raising FDI and domestic investment levels is primarily dependent on macroeconomic stability and implementation of reforms to improve the enabling environment and encourage private sector activity. Browne (2006) points out that in most parts of the Pacific region there has been minimal interest in investment from abroad because of highly cumbersome and restrictive administrative regulations.
The World Bank’s Cost of Doing Business indicators for East Asia and the Pacific region (World Bank 2005), show the quality of business regulation in the Pacific is mixed. The regional average time it takes to register property is 60 days. However, in Vanuatu it takes 188 days to register property. The regional average cost to enforce a contract is 55 per cent of the value of the debt, while in Solomon Islands the average cost is 141 per cent of the value of the debt.
Governance performance
Although there is a wealth of current literature on governance issues in the Pacific, quantitative indicators of governance performance are difficult to obtain for the PICs.
On six governance index measures prepared for the World Bank (Government Effectiveness; Rule of Law; Control of Corruption; Regulatory Quality; Voice and Accountability; and Political Stability and Absence of Violence) covering more than 200 countries, Papua New Guinea ranks particularly poorly, placed in the bottom quartile against five of the six measures, and Solomon Islands is ranked in the bottom quartile in four of the six measures12 (Kaufmann, Kraay and Mastruzzi 2005).
Transparency International (2006) ranks only two PICs for their corruption perceptions index — Fiji, ranked equal 55th, and Papua New Guinea, ranked equal 130th out of 206 countries in 2005. Nevertheless there is ample evidence suggesting that governance performance in the PICs has generally been poor. The Asian Development Bank and Commonwealth Secretariat (2005) estimate that in total Fiji, Nauru and Papua New Guinea have lost US$75 billion in income due to poor governance since independence.
As discussed earlier, Winters and Martin (2004) find that smallness and isolation matters in terms of restricting internationally competitive economic options. This reality only heightens the importance of good governance and making the right policy choices. The cost of poor governance, corruption and inefficiency is likely to be severe in environments where economic options and prospects are already constrained to some extent by exogenous factors such as smallness and remoteness from markets. Chand(2006) goes as far as to argue that poor governance and poor policy choices rather than the handicaps of smallness and isolation have been responsible for poor economic performance in the PICs from 1995 to 2005.
Finally, it can also be noted that political instability in the PICs has been much more prevalent in the diverse and politically fragmented states of Melanesia. The RAMSI intervention in the Solomon Islands was a response to ethnic violence and a breakdown in law and order. The current Government of Papua New Guinea may well be the first to serve its full term in office since Papua New Guinea achieved independence more than 30 years ago. Fiji has experienced military coups and other periods of social unrest since the late 1980s.
Concluding comments
This paper has shown that, on the basis of available data, economic performance has been at best mixed and in many cases quite poor for an extended period of time in the PICs.
Considerable risks and opportunities to economic growth and development for the PICs remain for the foreseeable future. For example, HIV/AIDS and the increasing incidence of diseases such as type 2 diabetes risk undermining gains made in health and life expectancy, will add pressure to health systems which in some cases are already inadequately resourced, and will negatively impact economic performance prospects. In Papua New Guinea in particular the emerging HIV/AIDS epidemic could substantially undermine social and economic progress. Declining international trade preferences are placing severe competitive pressures on key industries in some countries such as the sugar and textiles industries in Fiji. Demographic pressures are interacting with weak economic performance to worsen unemployment and associated social unrest and criminal activity in several countries. Environmental stresses are impacting on food production capacity and raise particular concerns for low-lying atoll states such as Tuvalu. A substantial decline in world commodity prices would cause serious income shortfalls in the PICs. However, the telecommunications revolution, and the ongoing process of global economic integration, may provide new prospects for the PICs to expand and diversify their economies and export sectors.
Against a background of substantial risks and challenges, some of which are exogenous, PIC governments must prudently and effectively manage the factors which they can control to achieve best possible economic outcomes.
References
Asian Development Bank and Commonwealth Secretariat 2005, ‘Toward a new Pacific regionalism — joint report to the Pacific Islands Forum Secretariat’.
AusAID 2006, Pacific 2020 Challenges and Opportunities for Growth.
Browne, C 2006, Pacific Island Economies, International Monetary Fund, Washington.
Chand, S 2006, ‘Economic growth in Forum Island Countries: Lessons of the past decade and challenges and opportunities ahead’, Pacific Islands Forum Secretariat.
Duncan, R and Chand, S 2002, ‘The economics of the arc of instability’, Asian-Pacific Economic Literature, vol 16, no. 1, May.
International Monetary Fund 2006, International Financial Statistics on-line,
Kaufmann, D, Kraay, A and Mastruzzi, M 2005, ‘Governance matters IV: governance indicators for 1996-2004’, World Bank Washington DC.
Levantis, T 1997, ‘Urban unemployment in Papua New Guinea — it’s criminal’, Pacific Economic Bulletin, vol 12, no. 2.
Organisation for Economic Co-operation and Development (2006), Development Assistance Committee, http://www.oecd.org.
Polaski, S 2005, ‘In agricultural trade talks, first do no harm’, Issues on Line in Science and Technology, Fall.
Radelet, S, Clemens, M and Bhanvani, R 2005, ‘Aid and growth’, Finance and Development, vol 42, no. 3, September.
Transparency International 2006, ‘Corruption perceptions index’, http://www.transparency.org.
Winters, L and Martin, P 2004, ‘When comparative advantage is not enough: business costs in small remote economies’, World Trade Review, vol 3, no. 3, pp 347-84.
World Bank 2005, ‘Doing business in 2006 — creating jobs: a project benchmarking business regulations in 155 countries’.
World Bank 2006a, World Development Indicators on-line,
World Bank 2006b, ‘At Home and Away — expanding job opportunities for Pacific Islanders through labour mobility’.
1 The author is from Pacific and Assistance Division, the Australian Treasury. Carla Adami, Sarah Gurr, Sugi Indralingam and Kimberley O’Brien contributed to earlier versions of the article, which has also be
nefited from comments and suggestions provided by Christine Barron, John Hawkins, Terry O’Brien and Martin Parkinson. James Gilling, Stephen Howes and Theo Levantis of the Australian Agency for International Development, Satish Chand of the Australian National University and Meg Keen of the Office of National Assessments also provided valuable comments. The views in this article are those of the author and not necessarily those of the Australian Treasury.
2 The paper draws on the World Bank’s World Development Indicators (WDI) as a key data source. The WDI provide the best available consistent source for long-term time series data for Pacific countries. The WDI cover ten of the fourteen developing country members of the Pacific Islands Forum. The countries covered (Papua New Guinea, Solomon Islands, Vanuatu, Fiji, Marshall Islands, Federated States of Micronesia, Palau, Kiribati, Samoa, and Tonga) take in more than 99 per cent of the total PIC population of around 8million. As the other four developing country members of the Forum (Nauru, Tuvalu, Niue and the Cook Islands) are not members of the World Bank they are not included in the WDI.
3 For example Papua New Guinea achieved independence in 1975 and the Solomon Islands in 1978. However, the first PIC to achieve independence was Samoa, which achieved independence from New Zealand in 1962.
4 Categories defined by the OECD Development Assistance Committee’s list of Official Development Assistance (ODA) recipients. As at 2006, their categories are: LIC: per capita Gross National Income (GNI) less than US$825; LMIC: between US$826 and US$3,255; and UMIC: between US$3,256 and US$10,065.
5 The PPP measure in Charts 5 and 6 uses an international dollar exchange rate index — each country’s index is determined by how many US$ it would take in the domestic economy to purchase US$1 worth of the same commodity in the United States.
PPP and market exchange rates often result in markedly different GDP estimates, especially for developing countries. These differences stem from the fact that PPP estimates of GDP take into account different price levels for identical goods and services across economies. For example, developing economies with relatively low non-traded good prices tend to have PPP-derived exchange rates that are higher than their market exchange rates because a unit of local currency has greater purchasing power in these economies. When expressed in PPP— as opposed to market exchange rate (MER) — terms, their GDP levels will also be higher.
6 The current Compact of Free Association (Compact II) expires in 2023.
7 Papua New Guinea averaged 3.2 per cent annual GDP growth over 1965–2004, only slightly lower than the 3.3 per cent rate of GDP growth required to return per capita GDP back to its peak level by 2025.
8 Winters and Martin use the following population-based definitions for country size: micro economies (<12,000 people); very small economies (12,001-200,000); threshold economies (200,001-1,600,000); and small economies (1,600,001-4,000,000).
9 The level of joblessness in AusAID (2006) is expressed as the ratio of employed persons to the total working age population.
10 Aid volatility as a percentage of GNI could arise due to: volatility in GNI outcomes, with relatively stable aid flows; large fluctuations in aid flows, with stable GNI; or fluctuations in both aid flows and GNI outcomes.
11 Net official remittances = official remittances received minus official remittances paid. WDI uses data flowing through official balance of payments systems and it is recognised that this is likely to underestimate the total value of remittances as informal, non-cash, and non-household (for example transfers to sporting bodies, youth groups or churches) remittances are not picked up in the official balance of payments. Negative net official remittances mean that a greater amount of income was transferred overseas from people working within a country (remittances paid) than was received into the country from people working overseas and transferring income back into the country concerned (remittances received).
12 The governance indicators reflect statistical compilations of responses on the quality of governance from a large range of enterprise, citizen and expert survey respondents in industrial and developing countries, as reported by a number of survey institutes, think tanks, NGOs, and international organisations.