Australian household wealth has increased in recent years, despite higher debt levels. In other words, the value of household assets has risen substantially more than household debt. The higher debt levels partly reflect the benefits of low inflation in contributing to improved housing affordability and access to finance. Household debt increases do not appear to have resulted in enhanced financial difficulties at an aggregate level.
Introduction
This article outlines some key developments in household wealth in recent years and examines whether the household sector is having financial difficulty as a result of increased debt levels.1
Household wealth
Over the past decade, increases in the aggregate value of household financial and non-financial assets have coincided with rises in household debt (see Chart 1). Some commentators have suggested that the rising debt levels of households are a concern. However, considering household debt in isolation is misleading: the higher debt levels are more than offset by the growth on the asset side of the household balance sheet - a phenomenon seen in a number of other developed countries. Over the past five years, the net wealth of households has grown by an average of 10 per cent annually in nominal terms.
Chart 1: Household sector balance sheet(a)
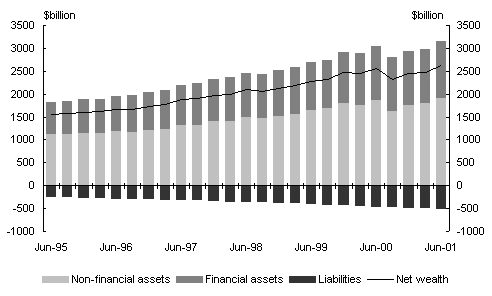
(a) Consistent data are not available prior to the June quarter 1995.
Source: ABS Cat. No. 5232.0 and RBA Statement on Monetary Policy.
Household assets
Chart 2 shows an alternative break-down of the value of assets held by the household sector. Dwellings comprise over half the value of household assets, while superannuation and life policies account for a further 20 per cent. The nominal value of both dwellings and superannuation has grown by around 10 per cent per annum, on average, over the past five years.2
Directly-held equities and unit trusts comprise a smaller proportion of assets, accounting for around 9 per cent of household assets. A combination of greater share ownership and rising share prices has led to an average 24 per cent annual increase in the value of direct equities and unit trusts held by households over the past five years.
Putting these asset classes together, the nominal value of household assets has grown by 10 per cent per year, on average, for the past five years.
Chart 2: Household assets
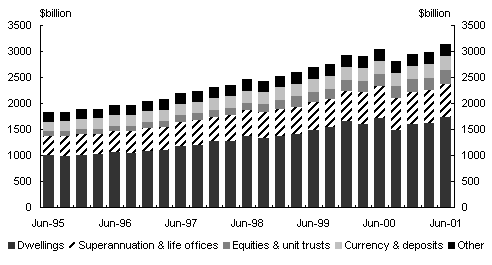
Source: ABS Cat. No. 5232.0 and RBA Statement on Monetary Policy.
These household assets provide a support base for the debt held by households. Total household liabilities, mostly debt, are around 40 per cent of the value of household financial assets, or around 15 per cent of total assets. That is, for every dollar in debt, households have, on average, about $2.50 in financial assets and between $6 and $7 in total assets.3
Household liabilities
The increases in both household assets and liabilities have their origins in the financial deregulation and new lending practices that commenced in the early to mid 1980s. In particular, quantitative controls on interest rates and portfolios were largely removed in 1982, although a cap on pre-existing housing loans continued until 1986.
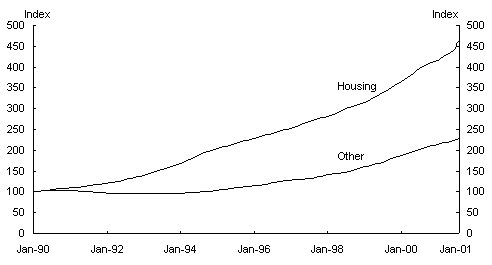
Together, these changes enabled many credit-worthy households to access finance for the first time. Chart 3 shows the contribution of housing to total personal credit growth over the past decade.
Chart 3: Growth in personal credit
Break adjusted index, Jan 1990=100
Source: RBA Bulletin Statistical Database.
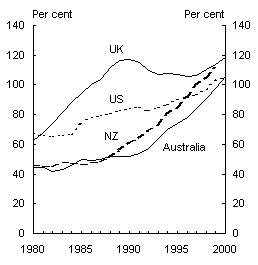
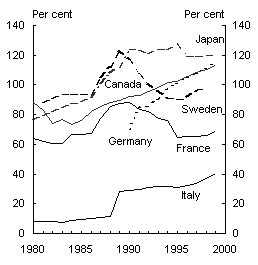
As shown in Chart 4, Australian households had a relatively low debt to disposable income ratio in the early 1990s compared with some other OECD countries. However, this ratio has increased since then and is now broadly comparable to other OECD countries.
Chart 4: International comparisons
Household debt to disposable income(a)
|
|
|
(a) Data for Australia, UK, Germany and New Zealand exclude unincorporated enterprises.
Source: Reserve Bank of Australia.
The benefits of low inflation
While access to finance has been an important factor behind the growth in household debt, other factors have also made a significant contribution. In particular, the effectiveness of monetary policy in achieving low and stable inflation has benefited both lenders and borrowers.
Some households, such as self-funded retirees, are net lenders relying on income flows from investments. Although higher interest rates increase nominal returns, if these higher interest rates are associated with higher inflation, then there is more rapid erosion of an investor's capital base. For example, at an inflation rate of 5 per cent, it takes 4½ years for investors to lose 20 per cent of their capital base in real terms. By contrast, it takes 9 years for the same amount of capital to be eroded at an inflation rate of 2½ per cent.4
Borrowers can also benefit from a low interest rate, low inflation environment. In a high interest rate, high inflation environment, home loans have very high repayment burdens early in the term of the loan.5 This can exclude many low-income households from accessing finance. In contrast, low inflation and low interest rates result in lower repayments thus enabling a wider range of households to access finance.
This argument is, perhaps, best illustrated by highlighting some changes in the affordability of housing over the past five years:
- The standard variable mortgage rate fell from 10.5 per cent in late 1995 and early 1996 to 6.3 per cent in October 2001 (and has subsequently fallen to around 6.05 per cent). The annual rate of inflation has fallen from around 5 per cent in the December quarter 1995 to around 2½ per cent currently.6
- House prices and average loans have increased over this time. The average loan taken out by first homebuyers has increased from around $91,000 in December 1995 to around $144,000 in October 2001. Despite this increase, the interest bill for first home buyers has actually fallen over this period - total interest in the first year of these loans has fallen from $9,526 to $8,986.7
- Taking rising disposable income into account, the repayment burden is considerably lower. For example, a first home owner taking out an average loan and earning the average household disposable income would have faced a total repayment burden (principal and interest) of 17.3 per cent of disposable income in October 2001 compared with 19.4 per
cent in December 1995.8
The distribution of assets and liabilities
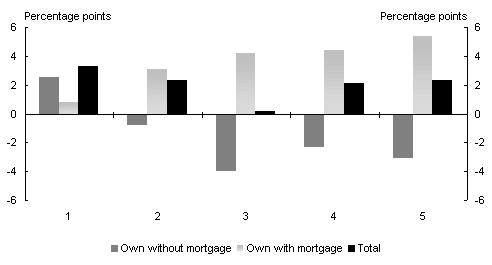
The increased housing affordability and access to finance - along with reduced interest margins due to increased lending competition - have resulted in a wider range of households purchasing their home. Changes in the pattern of home ownership and financing are apparent over the three years to 1999-2000, as shown in Chart 5 where the numbers 1 to 5 on the x-axis denote the respective quintile. A feature is that all income quintiles had higher rates of home ownership over this period.
Chart 5: Change in home ownership between 1996-97 and 1999-2000
Distribution by gross income quintile
Source: ABS Cat. No. 6523.0.
Despite the increasing penetration of home ownership, households in the upper income quintiles remain the most likely to own their own home. In 1999-2000, the three lowest quintiles had home ownership rates between around 40 and 50 per cent9. In contrast, the fourth and fifth quintiles had ownership rates of 60 and 80 per cent respectively. That said, the prevalence of mortgages also increases across the income distribution; that is, higher income households are more likely to have a mortgage than low-income households.
The Australian Stock Exchange Shareownership Survey paints a similar picture. Share ownership has increased across all income groups in recent years - at least 14 per cent more households in each income group had direct shareholdings in 2000 compared with 1997 - largely reflecting several high profile privatisations and demutualisations. However, households with incomes above $70,000 had share ownership rates above 60 per cent, compared with 45 per cent or below for households with lower incomes.
Financial returns and debt servicing
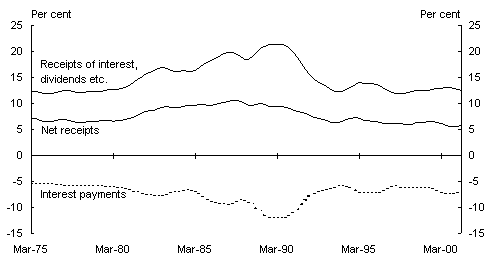
Some households are net recipients of income from financial assets (including interest10 and dividends), while others are net interest payers. In aggregate, the household sector is a net recipient of income from these sources, as shown in Chart 6.
Chart 6: Returns on financial assets and interest payments
(proportion of household disposable income)
Source: ABS Cat. No. 5206.0.
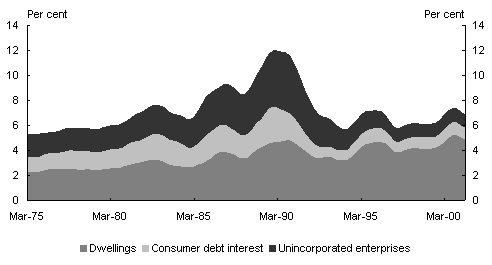
A common measure of the interest burden on the household sector is the debt servicing ratio. As shown in Chart 7, this debt servicing ratio is significantly below its peaks - interest payments for the household sector as a whole are around 6½ per cent of disposable income, well below the ratio of 10½ per cent reached in 1989-90.11
Chart 7: Household debt servicing ratio
(proportion of household disposable income)
Source: ABS Cat. No. 5206.0.
Economic impact of interest payments
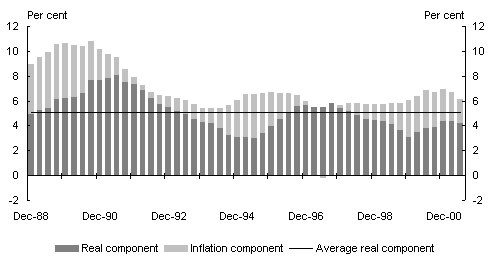
In the short term, households are generally concerned with the total interest payments they make. However, the longer-term economic consequences for households depend on the extent to which these payments reflect inflation, as the inflation premium built into nominal interest rates reflects the declining real value of outstanding debt.12 This can be taken into account by separating the debt servicing ratio into its inflation and real components13.
Higher nominal interest rates do not result in higher real debt servicing costs for households if real interest rates are unchanged. As a result, any increases in nominal interest rates that are not associated with higher real interest rates do not adversely affect the real net wealth of households. Further, without any impact on net wealth, such interest rate changes should not have a sustained impact on household expenditure for any given real income.
As shown in Chart 8, the real component of the debt servicing ratio in the June quarter 2001 was below the long run average, and below the peaks in 1990-91 and 1996-97.14
Chart 8: Decomposition of total debt servicing ratio
(proportion of household disposable income)
Source: ABS Cat. Nos. 6401.0, 5206.0 and 5232.0
This is not to say that nominal rates are irrelevant or have no impact on household expenditure. High nominal rates may prevent some households from borrowing to finance a home. This is a result of the fact that most loans require constant nominal repayments over the life of the loan. The first loan repayment must cover the interest cost of the loan plus some amount to cover repayment of the principal. With higher nominal interest rates the initial interest payment is higher. This higher interest payment must be paid out of current nominal income. However, provided the household is able to take out the loan in the first place, the household is no worse off in the long run (for a constant real interest rate) as the real value of the fixed repayments fall over time and the nominal value of the house typically rises over time.
Conclusion
While household debt is increasing, it is misleading to consider it in isolation from the complete household balance sheet. It is important to consider the debt position in the context of sustained growth in assets and resulting improvements in the financial position of households. Moreover, the increases in debt are partly a reflection of improvements in housing affordability and access to finance flowing from low inflation and the restructuring of financial markets.
Low inflation provides benefits to a wide range of households. These include potential first home owners whose repayments are lower in the early stages of new loans and self funded retirees whose capital base is eroded rapidly with high inflation. These conditions contribute to improvements in the ability of the household sector, as a whole, to service the higher debt levels.
These structural changes have given many more households the opportunity to purchase housing compared with a decade ago. Many low-income households have taken advantage of this opportunity, as part of a broader trend to increased home ownership in recent years. The penetration of mortgage finance is greater amongst higher income households, which broadly coincides with the distribution of assets.
1 In this article, data from ABS Cat. Nos. 5206.0 and 5232.0 are taken from the June quarter 2001 releases of those publications. The household sector includes both individuals and unincorporated enterprises (such as sole traders and partnerships) consistent with Australian Bureau of Statistics treatment.
2 Over the past year, estimates of the value of dwellings have been affected by compositional changes in the housing market associated with the introduction of The New Tax System, particularly the introduction of the First Home Owners Scheme. Refer to the Reserve Bank of Australia's Statement on Monetary Policy February 2001 for more information.
3 There may, of course, be wide variations in the relative positions of individual households within this average.
4 It should also be noted that this example does not take account of the effect of the tax system. Income tax applies to the full value of the nominal interest payment.
5 This issue is discussed in more detail later in this article.
6 The implementation of The New Tax System had a one-off impact on the price level in 2000-01. Abstracting from these effects, `ongoing' inflation remained at moderate levels.
7 However, given the higher borrowings, the annual repayments of principal are larger.
8 Household disposable income is defined as gross income less secondary income payable (including income tax payable and net non-life insurance premiums). Source: ABS Cat. No. 5206.0.
9 It is worth noting that analysis of trends in the first income quintile should generally be treated with caution, as it contains many self-funded retirees with low incomes but significant accumulated assets.
10 Interest receipts include some items that may not be received immediately, such as investment income from insurance policies and superannuation funds.
11 This does not take into account changes in interest rates, incomes or debt levels in the second half of 2001.
12 For households who are not liquidity constrained and are forward looking, it is more difficult to separate the short and longer term consequences of interest payments as they will primarily be concerned with real changes in their net wealth.
13 The real component of the debt servicing ratio was derived from the equation R=D(r+_+r_), where R is total interest payments, D is household debt, r is the implied real interest rate and _ is the trend historical quarterly rate of inflation.
