Address to the Committee for the Economic Development of Australia (CEDA)
40th anniversary annual general meeting dinner
Sydney - 19 November, 2001
By Dr Ken Henry
Secretary to the Treasury
This year, CEDA celebrates 40 years of very significant contribution to the economic policy debate in Australia. A lot has happened to the Australian economy in the past 40 years. Some of what has happened has been influenced heavily by international events and other forces entirely out of our control. Other events, with `home grown' origins, involving all sorts of people with all sorts of ideas, have acted also to shape the economy we now have.
Tonight, I am going to offer a brief review of our economic development over the last 40 years, focussing on the contribution of economic policy to development, and on the evolution of policy thinking over that period. I am then going to speculate, briefly, on prospects and challenges over the next 40 years. Clearly, this is an ambitious topic - indeed it is a topic that would challenge several books. Accordingly, my remarks will be abbreviated and my focus necessarily narrow. But hopefully not too abbreviated, and not too narrow, to support some propositions concerning our economic development.
Economic performance
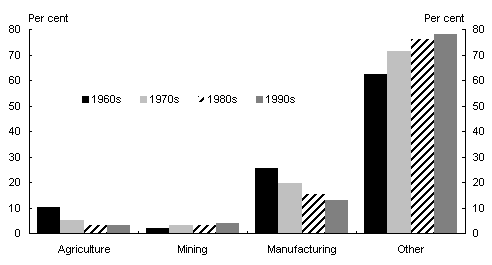
Chart 1: Industry sector shares
Source: ABS Cat. No. 5206.0.
It is often assumed that the Australian economy of the 1960s1 was dominated by agriculture, mining and manufacturing. In fact, even in the 1960s more than 60 per cent of gross domestic product (GDP) was produced in other sectors - mainly services2. Nevertheless, there has been notable change in the industry composition of the economy over the last four decades. Agriculture has declined from about 10 per cent of the economy to about 3 per cent. And manufacturing has declined from more than a quarter of the economy to a little more than an eighth. Interestingly, mining has doubled its share of GDP - but remains at less than 5 per cent. The big growth has, obviously, been in other areas. These developments - excluding the growth in mining - are common to most industrialised economies.
It is worth observing that most of the structural change evidenced by industry shares occurred in the 1970s and, to a lesser extent, the 1980s. The 1990s were the years of least change in this crude indicator of economic structure.
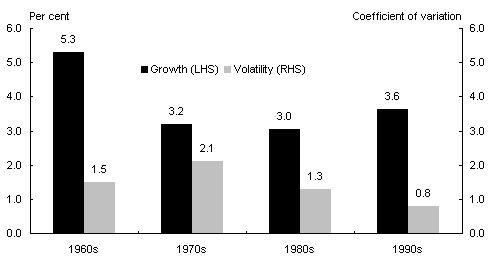
Chart 2: Decade average GDP growth and volatility
Source: ABS Cat. No. 5206.0 and Treasury estimates.
Clearly, different sectors of the economy have experienced rather different rates of growth over the last 40 years. On average, across all sectors of the economy, the 1960s were years of high gross domestic product (GDP) growth - 5.3 per cent a year in real terms. The three decades following showed significantly lower rates of GDP growth. But of these three, the 1990s, stand out also as years of relatively strong growth and, significantly, of considerably less variability in growth performance (volatility) than any of the three earlier decades.
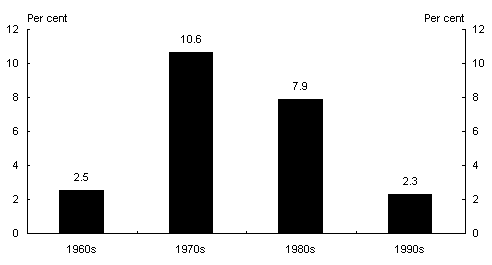
Chart 3: Decade average inflation rate
Source: ABS Cat. No. 6401.0.
The 1960s and 1990s were also years of relatively low inflation, separated by two decades of very high rates.
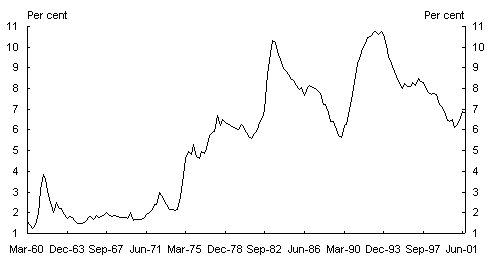
Chart 4: Unemployment rate
Source: ABS Cat. No. 6202.0.
Perhaps the most dramatic macroeconomic story of the last 40 years involves unemployment. In the 1960s the unemployment rate averaged less than 2 per cent. But in the 1970s the unemployment rate increased sharply, barely pausing before the onslaught of the early 1980s recession took it above 10 per cent. With very strong employment growth through the second half of the 1980s the rate of unemployment fell back below 6 per cent, but then increased sharply once more to again peak in excess of 10 per cent in the recession of the early 1990s. The story is one of high cyclical volatility, but with a clear structural break - a structural deterioration - in the 1970s.
The 1970s were difficult years for the Australian economy. The high growth, low inflation and low unemployment of the 1960s encouraged policy complacency. In the benign international environment of the 1960s the costs of an insular, highly regulated policy framework were not apparent. But they became very apparent when the first of two oil price shocks hit in the early 1970s. This was the accident waiting to happen. Inflation and unemployment soared, and - certainly by the time the 1970s had come to an end - the policy orthodoxy was in tatters.
I will return to the evolution of policy in a moment.
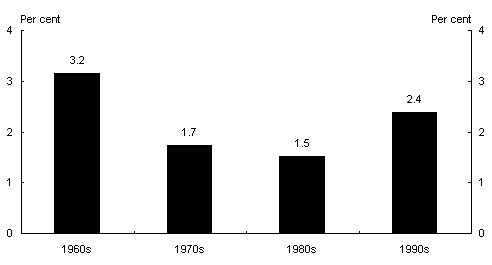
Chart 5: Decade average GDP per capita growth
Source: ABS Cat. No. 5204.0.
In the 1960s GDP per capita increased by 3.2 per cent a year on average. In the 1970s and 1980s GDP per capita growth was much lower than in the 1960s. The 1990s, however, were also years of relatively high growth, though not as high as the 1960s.
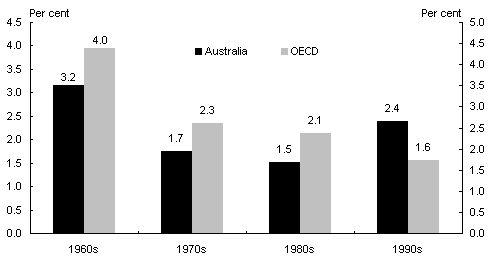
But this picture of strength in the 1960s is rather misleading. It turns out that the 1960s were years of exceptionally buoyant growth in most of the industrialised world.
Chart 6: Decade average GDP per capita growth -
Australia and the OECD
Source: Treasury, OECD.
When we compare ourselves with the average of the OECD we find that, in terms of relative performance, the 1960s were our worst years.
In fact, the last decade was the only one in which our rate of growth of GDP per capita exceeded the OECD average. Against this benchmark, the 1990s were years of substantially better performance than the 1960s.
Before going on, I should note that GDP per capita - though widely used - is not a universally accepted summary indicator of economic performance - far less of living standards. In the Treasury, where (according to our mission statement) we have a focus on `improving the well being of the Australian people', we recognise the importance of a range of factors: the level and distribution of real income and wealth; the extent of economic and social participation; uncertainty and risk; complexity; and liberty, opportunity and freedom. We rate all of these things as being constituent components of the well being of the Australian people.
Volumes could be written on the evolution of each of these components of well being. But tonight, I am going to concentrate on the evolution of GDP per capita - just one, imperfect but nevertheless revealing, indicator of the factors that contribute to well being.
Policy and its evolution
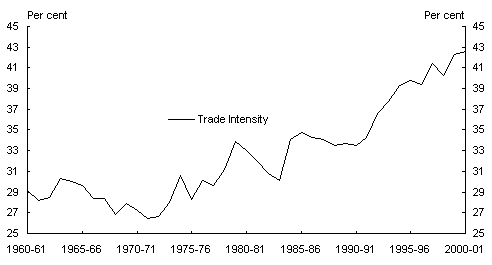
Chart 7: Trade as a share of GDP since 1960
Source: ABS Cat. No. 5302.0.
At the end of the 1960s, exports and imports, together, made up about 28 per cent of GDP, as against 42 per cent at the end of the 1990s. For more than half of the last 40 years, the explosion in world trade - one of the most dynamic forces for development - largely passed us by.
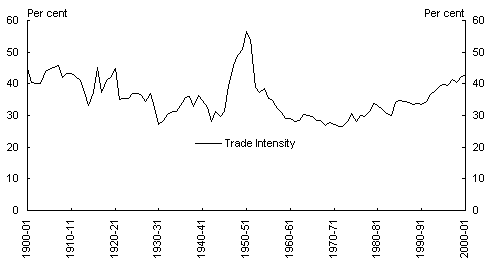
Chart 8: Trade as a share of GDP since 1900
Source: RBA Preliminary Annual Database and ABS Cat. No. 5206.0.
The trade exposure of the Australian economy in the 1960s was low not just by the standards of the succeeding decades. It turns out that, in trade exposure terms, the 1960s marked the low point of the entire century - a century that, in those terms, concluded with a strong trend back to where it had started.3
Chart 9: Effective rate of tariff assistance*
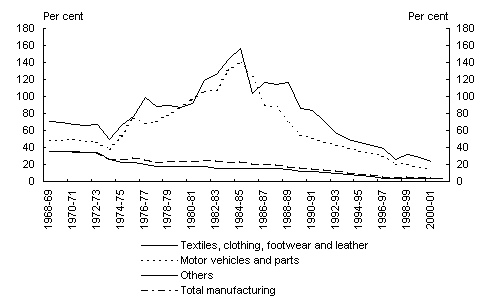
* Includes tariff equivalent of quotas.
Source: Productivity Commission.
Trade exposure is heavily influenced by policy - principally by tariffs and quotas. The effective rate of tariff assistance for all products other than motor vehicles, motor vehicle parts, textiles, clothing and footwear fell over the 1970s, 1980s and 1990s. For those specific products, protection peaked in the early 1980s, but has since fallen quite sharply. This latter period exhibits sustained growth in the share of exports in GDP.
Chart 10: Structural reform timeline
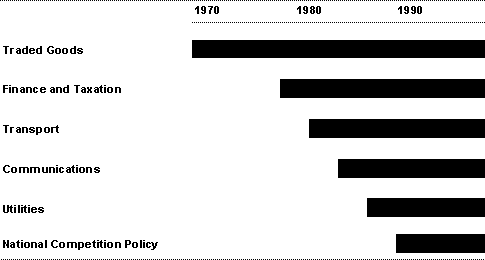
The 25 per cent across-the-board tariff cut of the Whitlam Government marked the beginning of microeconomic reform, impacting most immediately on the agricultural, mining and manufacturing sectors of the economy. Of course, it wasn't conceived as a microeconomic reform at the time; rather, it was designed to cool a rapidly overheating economy. Significantly, the tariff cut was not accompanied by reforms to enhance the competitiveness of product markets and the flexibility of factor markets. It wasn't until the early 1980s that progress began to be made in these areas. As that decade began, few could have anticipated the scale of economic policy reform that would occur over the next 20 years.
The exchange rate was floated at the end of 1983, and capital controls were relaxed. Financial markets were liberalised and taxation arrangements began to be addressed. Both of these areas have been subject to more or less continual reform since the early to mid 1980s - including very substantial reforms in both areas in the last few years. Tariffs on all products have fallen continually since the mid-1980s. In the late 1980s, and continuing in the 1990s, non-traded goods sectors of the economy were targeted for reform, notably in the areas of transport, communication and utilities.
From the late 1980s, labour markets and industrial relations, and education and training were subject to considerable reform also - the former particularly so in the second half of the 1990s.
Significantly, there has been little backsliding on reform, even in difficult macroeconomic circumstances. The fact that, for example, tariffs were allowed to continue to fall during the recession of the early 1990s is remarkable; it is also extraordinarily important. Nor did we re-regulate the financial sector following the stresses of the late 1980s and early 1990s. Indeed, even as we were in recession, new microeconomic reform initiatives, in transport and communications in particular, were being conceived.
In 1995 the sectoral approach to microeconomic reform was complemented by National Competition Policy - a comprehensive framework for reform in all areas of the economy. National Competition Policy obliges Commonwealth and State governments to review existing legislation, and to assess proposed legislation, against a broad public interest test4 and to ensure competitive neutrality as between public and private sector providers. It also introduced a national access regime for essential infrastructure services.
The second half of the 1990s was a period of wide-ranging microeconomic reform - embracing:
- the waterfront;
- financial sector reforms, creating a system of prudential regulation that establishes world's best practice;
- a comprehensive program of corporate law reform, implementing a corporate governance framework, and financial reporting and disclosure regimes which are also at world's best practice;
- substantial reform of the industrial relations system; and
- a very major program of tax reform that, in addition to its complete overhaul of the indirect tax system, targeted revenue security and incentives to work and save.
In its most recent survey of Australia, the OECD reports four `synthetic indicators of strictness of legislation' for the 21 OECD economies in 1997-98. It reports that in respect of `state control' of product markets, only Ireland, the United States and Great Britain were less interventionist. In respect of `barriers to entrepreneurship', only Canada and Great Britain were less restrictive. And Australia had the lowest barriers to trade and investment of all OECD countries.5
The macroeconomic benefits of Australia's structural reform program took some time in coming. Certainly, the benefits were not much evident in the second half of the 1980s, far less in the recession of the early 1990s. There were many, during those years, who strongly contested the direction of policy change. Significantly, unlike the second half of the 1990s, this contest was not, in general, played out on the field of `mainstream' politics. The 1980s were years of major structural reform in many countries, with vigorous reform programs being pursued by conservative and labour governments alike.
But even in the 1980s the reform consensus did not extend much beyond the policy and political mainstream. In the early 1990s, coincident with the recession, Australian critics of the reform orthodoxy identified the new enemy in the mainstream in an extraordinary attack on what they chose to label `economic rationalism'. Advocates of economic nationalist, and resurgent mercantilist, policies continue to attract support - representing a considerable contemporary challenge for those who propose, and seek to implement, economic reform.
The second half of the 1980s was a challenging period for macroeconomic policy advisers. Having made some progress in reducing product market protection in the 1970s, we chose in the early 1980s - albeit in circumstances that made an alternative decision problematic - to embark on substantial capital market liberalisation. Labour markets and the non-traded goods sectors of the economy remained heavily regulated. And, as we were to learn to our cost, corporate governance and the governance of a number of our newly liberated financial institutions would also be found wanting.
Policy advisers were far from convinced that all of the capital flowing into the economy - measured by the capital account surplus, which was averaging some 4 per cent of GDP - would likely produce the sorts of returns anticipated by international investors. There was little confidence that imported capital was being allocated efficiently. Advisers were concerned, that is, that the capital account was vulnerable to adverse shifts in market sentiment that could produce extreme volatility. This volatility might be recorded in capital flows, including the possibility of `capital flight'; but if
not in flows, then in capital market prices - sharp increases in interest rates or sharp currency depreciation, or both. Moreover, there was a concern that capital account volatility would not be easily accommodated in product and labour markets, given the limited impact of reforms to that point.
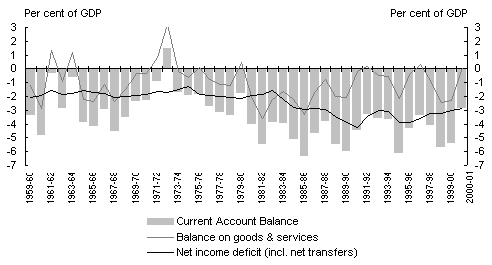
Chart 11: Current account balance
Source: ABS Cat. No. 5302.0.
Concern about the capital account surplus amounts to a concern with the current account deficit. And it was the latter that occupied the attention of macroeconomic policy advisers throughout the second half of the 1980s.
These days, in analysing the vulnerability of other economies to adverse capital market shocks, we would usually ask whether their degree of capital account liberalisation is well matched with their regulatory and institutional infrastructure - to their economic governance framework - and to the degree of flexibility in their product and factor markets. An analysis of that sort, conducted on Australia in 1986, might have led some to conclude that we should re-impose capital controls - that we had liberalised too early. But the dominant view was, rather, that concerns of this sort could be addressed by fiscal policy.
Policy advisers started with the national accounting identity that the current account deficit represents the excess of domestic investment (by governments, businesses and households) over domestic saving (by governments, businesses and households).6 A large current account deficit might be evidence of a chronic national saving problem. More particularly, it might be evidence of a fiscal policy problem - the so-called `twin deficits' proposition. Thus, a large capital account exposure, reflected in a large current account deficit, meant that we were at risk of a change in international investor sentiment. The way to purchase insurance against this risk was to reduce our call on foreign saving, by enhancing domestic saving. And the place to start was the public sector borrowing requirement. Reduce the public sector deficit and the current account deficit, and the capital account surplus will fall.
A large current account deficit may, indeed, be evidence of a national saving problem. But, then again, it might not. It may, alternatively, be evidence of a robust, rapidly growing economy, with a plenitude of attractive investment opportunities - more opportunities than should be, on any analysis, financed by domestic residents.
Today, the consensus position is that while both national saving and national investment continue to be of policy interest, the size of the gap between them is of essentially residual interest.
To understand why, consider the course of a rather curious debate that took place in Australia in the late 1980s. The question was whether microeconomic reform would add to, or reduce, the size of the current account deficit. Given the focus, at the time, on the current account deficit, and the growing controversy surrounding the microeconomic reform program, this is, perhaps, understandable - perhaps. But looking back from late 2001, the question appears decidedly odd.
The proposition implicit in the question was the following: (1) the current account deficit is `bad'; and (2) if it can be shown that microeconomic reform makes the current account larger, then microeconomic reform must also be `bad'. The current account deficit had been so thoroughly demonised - including by policy advisers - as to be beyond salvation. No one, therefore, was buying the argument that microeconomic reform could turn a `bad' current account deficit into a `good' one.
Yet that is now the dominant view. At least, there is an acceptance, now, that a highly competitive economy with sound regulatory structures, credible medium-term macroeconomic policy frameworks, and flexible product and labour markets will have less probability of generating the sorts of nasty surprises that produce extreme capital account volatility and will be better able to accommodate any capital market volatility that does occur. Microeconomic reform cannot prevent macroeconomic shocks from occurring, but it can help to contain the economic costs of such shocks.
And, without diminishing the importance of credible macroeconomic policy, this perspective on the current account goes a long way to explaining why policy advisers were much less concerned with its size in the mid-to-late-1990s. In policy circles a view developed that, in part because of the microeconomic reforms of the 1980s and 1990s, the current account should no longer be seen as imposing restrictive `speed limits' on growth - a view that simply could not have been held in the second half of the 1980s.
The other `speed limit' on growth in the 1980s - and, indeed, in the second half of the 1970s - was inflation. Again, microeconomic reform had a critical role to play. More competitive, more flexible, product and factor markets, supported by strong productivity growth, were responsible for a substantially reduced risk of exceeding the inflation speed limit to growth. Put another way, for any given rate of inflation the economy could now grow faster.
Macroeconomic policy also influences economic outcomes, and its development is, in turn, influenced by economic outcomes. Thus, fiscal policy, which had been seen predominantly as a tool of counter-cyclical demand management for most of the post-war period, was subject to a so-called `trilogy' commitment in 1985. From 1987 it was given a twin deficits target, but that was put aside as a consequence of the early 1990s recession. In 1996, with a clear emphasis on fiscal consolidation, the Government successfully adopted a credible medium-term fiscal strategy - of achieving balance, on average over the cycle.
The evolution of monetary policy in Australia has some parallels. Through the 1980s and early 1990s, the Australian monetary authorities searched, without much success, for an enduring operational anchor. Then, in 1993, with inflation low, and with reasonable prospects of its being kept low, the Reserve Bank of Australia began to put emphasis on targeting inflation in a medium-term framework. The Bank's independence, and the medium-term framework, were formalised by an agreement between the Government and the Bank in the Statement on the Conduct of Monetary Policy released in 1996.
So we now have medium-term strategies for both monetary and fiscal policy - strategies which command considerable credibility. And the relatively low volatility of both inflation and growth in the 1990s suggests that this medium-term framework has done its job. But I have to say that I doubt that we would have adopted this framework for macroeconomic policy without having had the benefit of many years of microeconomic reform. Moreover, had we done so, I doubt the results would have been nearly so impressive. Microeconomic reform has produced an economy in which a medium-term macroeconomic policy framework can have credibility.
Prospects and challenges
My proposition is that Australia's much-improved economic performance in the 1990s owes much to microeconomic reform, including labour market reform, enhanced considerably by the adoption of a credible medium-term framework for macroeconomic policy. Central to the lift in performance has been a pronounced pick-up in productivity growth, particularly notable in the second half of the 1990s.
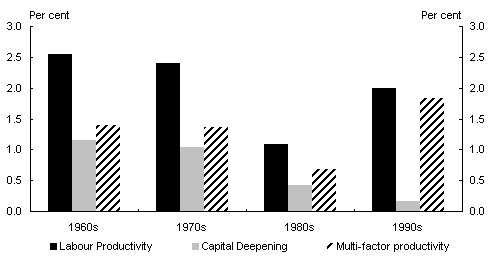
Chart 12: Decade average productivity growth
Source: ABS Cat. No. 5206.0 and Treasury estimates.
On that measure, of the four decades, the 1990s stand out as the most impressive by far. Labour productivity has two components7. One is due to capital deepening. This is the effect of giving workers more machines to operate. The other component is referred to as multi-factor (or total factor) productivity. This component captures everything else that allows a given number of hours worked to generate higher output. At the level of the firm, multi-factor productivity captures efficiencies in production, including those made possible by enhanced labour market flexibility and industrial relations reforms, and the effect of technological innovation - finding smarter, quicker ways of doing things. At the level of the aggregate economy, multi-factor productivity captures all of these firm-specific effects, but also captures the effect of resources being allocated more efficiently among firms and industries. Among the many things it captures, therefore, are the benefits of microeconomic reform - reform which the OECD, in its most recent survey of Australia, describes as having been `crucial'. 8
While labour productivity growth was higher in the 1960s than the 1990s, nearly half of the 1960s growth came from capital deepening. In the 1990s, however, strong labour productivity growth was due almost wholly to historically high multi-factor productivity growth.
Labour productivity growth is one component of growth in GDP per capita, to which I will now return.
Chart 13: Components of GDP per capita growth
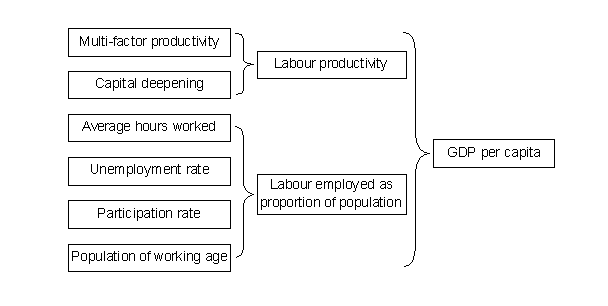
GDP per capita can be built up from a number of components, each of considerable interest: the proportion of the population of working age; the participation rate; the employment (or unemployment) rate; hours worked per employee; capital deepening; and multi-factor productivity. The last two components, together, make up labour productivity.
The following charts show the contribution of each of these components to total GDP per capita growth over the 40 years between 1960-61 and 2000-01. First, a word of caution. This snapshot analysis - involving a comparison of GDP per capita in 1960-61 with its level 40 years later - ignores the time path of change. Yet what is important to living standards over a 40 year period is the level of GDP per capita in each one of those years. Clearly, therefore, the earlier the growth in GDP per capita is achieved, the better.
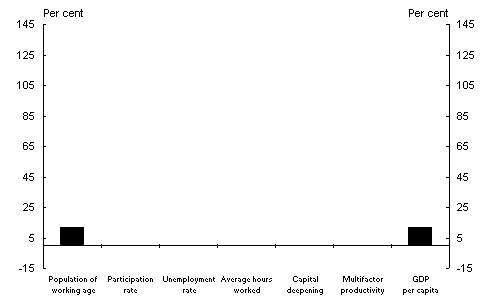
Chart 14a: Components of GDP per capita growth -
working age population
Source: ABS Cat. No. 5206.0 and TRYM database.
Over the last 40 years, the proportion of the population of working age - in this analysis, people aged 15 to 64 - has increased by 11.7 per cent. If all other factors - participation rates, unemployment rates and so on - had not changed, this development - an early expression of the ageing of the population - would have lifted GDP per capita by 11.7 per cent.
Demography - and, in particular, the impact of the post-war baby boom - has been an important positive driver of our economic development.
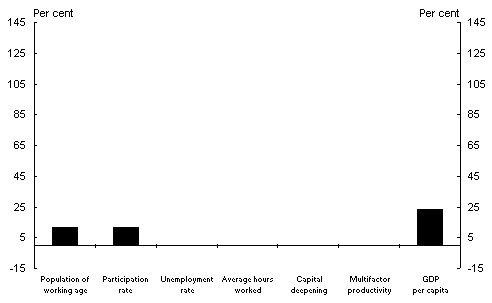
Chart 14b: Components of GDP per capita growth -
participation rate
Source: ABS Cat. No. 5206.0 and TRYM database.
But other factors did change. First, the participation rate - the proportion of people of workforce age who are actually seeking work - increased.9 This factor alone added a further 11.4 percentage points to GDP per capita growth - a cumulative total of 23.1 per cent.
Workforce participation is a complex issue. But over the last 40 years, its evolution has been dominated by three factors: First, the participation rate of males has fallen from 94 per cent to a little over 85 per cent. Second, the participation rate of females has increased from about 43 per cent to 67 per cent. And third, the participation rate of male workers aged 55 to 64 has fallen considerably - from 86 per cent to 61 per cent.
Chart 14c: Components of GDP per capita growth -
unemployment rate
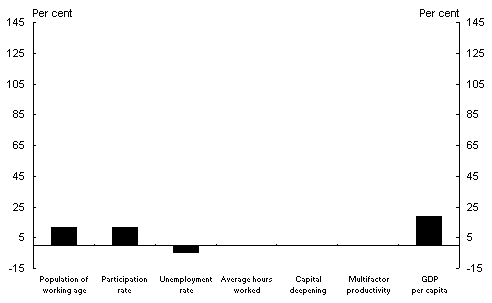
Between 1960-61 and 2000-01, the unemployment rate increased from 1.9 per cent to 6.5 per cent. This effect subtracts 4.6 percentage points from GDP per capita growth, leaving a cumulative total of 18.5 per cent. This, then, is the contribution to GDP per capita growth of the increase in the proportion of the population actually in work. More people of working age and a higher participation rate have acted to increase the proportion of the population in work, while a higher unemployment rate has acted to reduce the proportion. Significantly, however, labour market participation factors dominate, by a very considerable margin, the structural increase in unemployment over the last 40 years.
Chart 14d: Components of GDP per capita growth -
average hours worked
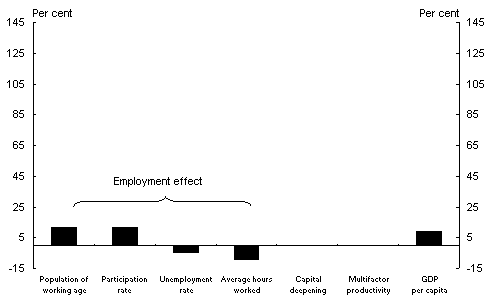
While a larger share of the population found themselves in work in 2000-01, they were working fewer hours on average. The effect of declining hours of work has been to detract 9.2 percentage points from GDP per capita growth over the last 40 years, leaving a cumulative total of 9.3 per cent.10 This represents the net contribution to GDP per capita growth of all of the employment effects.
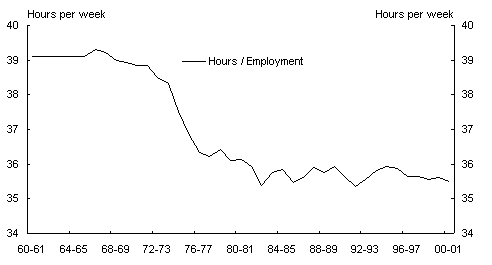
Chart 15: Average weekly hours worked
Source: TRYM database.
The big reduction in average hours worked occurred in the 1970s - coincident with the increasing workforce participation of females, many of them undertaking part-time employment, and the 35 hour week campaign. While the series is volatile, there has been no clear trend, in aggregate, in average hours worked since the mid-1980s.
So the total impact, over the last 40 years, of higher labour input on GDP per capita was 9.3 per cent - about one-fifth of one per cent a year. And that is all we would have achieved had we not also benefited from an improvement in labour productivity.
Chart 14e: Components of GDP per capita growth -
capital deepening
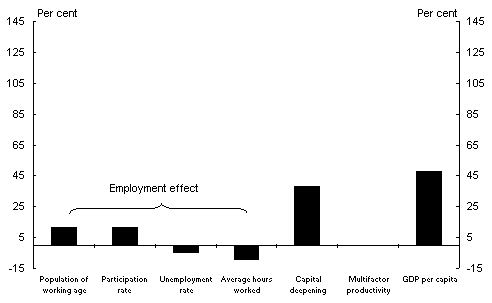
But labour productivity did improve. Capital deepening - the increasing capital intensity of production - added 38.3 percentage points to GDP per capita growth, producing a cumulative total of 47.6 per cent.
Capital deepening has been influenced heavily by capital inflow. In this respect, and in many others, international integration has been a key driver of our economic development.
Chart 14f: Components of GDP per capita growth -
multifactor productivity growth
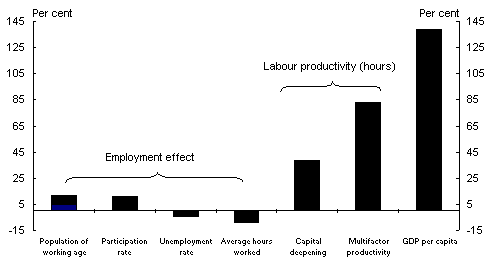
Finally, multi-factor productivity growth added a further 83.2 per cent, giving a grand total of a 138.611 per cent increase in GDP per capita over the 40 year period.
Sixty per cent of the increase in GDP per capita over the last 40 years is due to multi-factor productivity - to which new technologies have made a significant contribution. Along with demography and international integration, technological change has been a key driver of economic development.
But it is in the area of multi-factor productivity growth that the substantial contribution of microeconomic reform may also be found.
So what can we look forward to in the next 40 years?
The three key drivers of the last 40 years - demography, international integration and technology - will continue to be important. But each will present new opportunities and new challenges.
First, population ageing will continue. But whereas in the last 40 years population ageing increased the proportion of the population aged 15 to 64, the reverse will now be true - as the proportion of the population of retirement age increases. In the last 40 years, the positive contribution of population dynamics might have been responsible for some complacency, in some quarters, in attitudes to labour market reform and policies affecting workforce participation. Over the next 40 years, with population dynamics detracting from growth, these policy areas will, necessarily, be centre-stage.
We can anticipate that the participation rate - that is, of those of working age - will continue to increase, but modestly. On current policy settings it is projected that the total participation rate will increase by only about one-quarter that of the last 40 years.12
We can expect a lowering of the unemployment rate. This is an important policy objective. But it will not make a large contribution to the change in GDP per capita over the next 40 years.
On current policy, and assuming no further change in average working hours, the various employment effects, taken together, could be expected to reduce GDP per capita by a small amount over the next 40 years.
As in the last 40 years, labour productivity growth holds the key to improvements in GDP per capita. Over the last 40 years, labour productivity growth averaged 2 per cent a year, and GDP per capita growth averaged 2.2 per cent. In order to repeat that GDP per capita performance, we would need to average labour productivity growth of 2.3 per cent a year. While this is in excess of our long-run average, it is a rate of growth that we have been able to sustain for lengthy periods in the last 40 years.
Repeating the performance of the last 40 years is therefore possible. But it will not be easy. And it will not be achieved without continued adherence to sound policy - both microeconomic and macroeconomic.
Key to policy considerations over the next 40 years will be the factors affecting participation, as already noted, and labour productivity. Population ageing, and changing attitudes to early retirement, will drive employment outcomes. The baby boomers are spilling into the post-55 year age group. But, at the same time, people aged 55 to 64 are less motivated to participate in the workforce, and people are living longer.
_ In earlier generations a typical life experience might have included 50 years work, from age 15 to 65, followed by 7 years in retirement.
_ Today, many people are planning life experiences that include only 30 years work, from, say, age 25 to 55, followed by 25 or 30 years of retirement.
Quite clearly, the economic framework that can support the latter sort of life experience must be very different from the economic framework that supported the life experience of earlier generations. Put simply, if people are going to spend a smaller proportion of their lives in work, then they are going to have to expect their retirement incomes to decline relative to their pre-retirement incomes; that is, unless they reduce, quite dramatically, the proportion of their income that they consume during their working lives.
Part of the transformation in life experience can be explained by a longer period being spent in pre-work education and training - for which there is, presumably, a pay-off in the form of higher remuneration in the years of work - permitting higher saving for retirement. But it is the other end of the life experience that poses the more difficult questions - questions about the factors affecting the labour market participation of older workers.
By the year 2040, the proportion of the population aged 55 or more will have nearly doubled. And, on the basis of the participation rates of people presently aged 55-plus, 76 per cent of these will not be in the workforce. Thus, by 2040, we can expect 28 per cent of the population to be aged 55 or more and not in the workforce. Around one third of these will be in the 55-64 age group, presumably planning to spend the next 20 to 30 years not working.
This is what current projections suggest. But I have to say that I find this scenario implausible. Even if people have the financial means to retire at age 55, I find it difficult to believe that many of them will want to spend the remaining 25 to 30 (or more) years of their lives unemployed. But I also accept that at least some of them would likely be interested in jobs that may not currently exist, and with employment terms not presently on offer.
The participation of older workers raises issues relating to the flexibility of labour markets; job design and flexibility in workplace relations; the attitudes of employers to older workers and to part-time jobs; and issues in the welfare system. Some of these issues - notably the latter - are being tackled. Others have barely rated a mention in public debate. The Prime Minister's address to the National Press Club on 1 August 2001 provides a notable exception.
If, over the next 40 years we could return the labour participation rates of males aged 25 to 64 back to their level of the 1960s, the negative impact on GDP per capita of the ageing of the population would largely be offset.
Capital deepening will be affected by a number of factors, including, at some point, the opposing forces of a declining workforce and a drawdown of retirement savings (dis-saving). But it will also be affected by our ability to continue to attract and retain mobile capital - something that will become increasingly dependent upon the maintenance of sound regulatory and institutional arrangements, competitive product and factor markets and credible macroeconomic policies. The Government's recently announced review of international taxation arrangements goes to one of the difficult policy issues to be resolved in this area.
Multi-factor productivity poses challenges for skills development and retention, including the taxation of human capital; for innovation and technology policy; and for labour market and industrial relations arrangements.
There is much to celebrate in the economic transformation of Australia, and in the transformation of economic policy in Australia, over the last 40 years. The prospects for the next 40 years are promising. But the substantial challenges and opportunities posed by demographic and technological developments, and by increasing international integration, serve to underline the importance of preserving, indeed building on, those achievements.
As in the past four decades, CEDA has much to contribute to the policy debates of the next 40 years.
1 For the purposes of this analysis, decades averages are calculated using all financial years that start with the same digit (eg, the 1960s are 1960-61 to 1969-70) and decade average growth is calculated up to the start of the next decade (eg, the 1960s are from 1960-61 to 1970-71).
2 Measuring the precise contribution of the service sector in the 1960s is difficult, but a strong proxy is readily formed from the residual of farming, mining and manufacturing contributions. Although this simple proxy tends to overstate the exact percentage contribution of services to GDP, the overall trends are similar to most research material for this area. See `Australia's century since Federation at a glance', Economic Roundup, Centenary edition, 2001.
3 Of course, the other fact that stands out in a consideration of our trade performance over the last century is the extraordinary commodities boom associated with the Korean War.
4 Specifically, the guiding principle in legislative review is that legislation should not restrict competition unless the public benefits of so doing clearly outweigh the costs and there is no other way of achieving the objectives of the legislation.
5 OECD Economic Surveys: Australia, August 2001, Figure 30, p118.
6 The relationship between the current account deficit and net lending is also affected by net capital transfers and net errors and omissions. See ABS (1998) Balance of Payments and International Investment Position, Australia: Concepts, Sources & Methods, Cat. No. 5331.0.
7 ABS estimates of multi-factor productivity are not available for the economy as a whole (and market sector estimates are only available in the post 1964-65 period). The figures used in this speech are based on an update of Productivity Commission estimates. (See Industry Commission, 1997, Assessing Australia's Productivity Performance, Research Paper, AGPS, Canberra, September.)
8 OECD Economic Surveys: Australia, August 2001, p119.
9 For consistency, the denominator of these participation rates is those aged between 15 and 64.
10 Average hours worked per employed person is assumed to remain constant during the first half of the 1960s, as data for hours worked is not available for the period prior to September 1965.
11 Note that this figure is 7.8 per cent more than the sum of the estimates of the direct contributions. This unallocated growth gap of 7.8 per cent essentially picks up interaction terms between each of the drivers.
12 See `Demographic influences on long-term economic growth in Australia', Economic Roundup, Spring 2000.