Wilson Au-Yeung, Alison Keys and Paul Fischer1
This article looks back at the relationship between Australia and China, particularly following the normalisation of relations in 1972.
Introduction
On the eve of the 40th anniversary of the establishment of diplomatic relations between Australia and the People's Republic of China (PRC), this article looks back at the evolution of the relationship between our two countries, particularly following the normalisation of relations in 1972.
Diplomatic Relations
Chinese links with Australia extend well beyond the last 40 years at an official and non-official level. Examples of early official contact include the Chinese Consul-General arriving in Melbourne in 1909. Dr Lin Sen visited Australia in 1930, shortly before becoming President of the then National Government of China. Australia (briefly) had a trade commissioner in China from 1921-22. This was followed in 1934 by a 'Mission to the Far East', led by then Deputy Prime Minister JG Latham — a trade mission, which was also Australia's first attempt at direct political engagement with China. In 1941, Australia appointed its first diplomatic official to China, based in the then-capital of Chungking (now Chongqing).
When the PRC was founded in 1949, rather than recognise the PRC, Australia retained diplomatic relations with the previous regime which had established itself on Taiwan. However, as early as 1954, Gough Whitlam advocated recognition — the first Australian Member of Parliament to do so (Whitlam, 2010). The Australian Labor Party adopted the policy of recognising the PRC in 1955, but it was another 17 years before the ALP was elected into government, led by Whitlam himself, on 2 December 1972. Less than three weeks later, on 21 December, Australia and China signed the joint communiqué establishing diplomatic relations.
Under the Communiqué, the two Governments agreed to:
…develop their diplomatic relations, friendship and co-operation between the two countries on the basis of the principles of mutual respect for sovereignty and territorial integrity, mutual non-aggression, non-interference in each other's internal affairs, equality and mutual benefit, and peaceful coexistence.
From China's perspective, the critical issue was Australia's recognition that the Government of the PRC was the sole government of China:
The Australian Government recognizes the Government of the People's Republic of China as the sole legal Government of China, acknowledges the position of the Chinese Government that Taiwan is a province of the People's Republic of China, and has decided to remove its official representation from Taiwan before January 25, 1973.
With this done, Australia and the PRC (henceforth referred to as 'China') could embark on the 'normalisation' of their relationship. The Australian Embassy, in 'Peking' (now Beijing), was opened on 12 January 1973. Later that year, Gough Whitlam became the first Australian Prime Minister to visit China, establishing the foundations of our present-day bilateral relationship, supported by all subsequent governments. Also in that year, we signed the Trade Agreement between the Government of Australia and the Government of the People's Republic of China, which served as the basis for our bilateral trade and economic relationship, supplemented over time by extensive additional agreements, memoranda of understanding, and dialogues.
While trade and investment form the bedrock of our official bilateral relationship, it is of course much broader than that, with agreements, dialogues and links that cover most, if not all, aspects of the relationship — agriculture, resources, tourism, culture, climate change, human rights, customs, to name just a few.
An extensive program of high-level visits ensures regular exchanges at ministerial level and above. In 2003, President Hu Jintao became the first Chinese leader to address a joint sitting of the Australian Parliament (before him, only US presidents George HW Bush, Bill Clinton and George W Bush — the day before Hu — had been extended that honour). In 2012 alone, the Deputy Prime Minister and Treasurer, Minister for Foreign Affairs, Minister for Trade and Competitiveness, Minister for the Arts and Minister for Regional Development, Minister for Resources, Energy and Tourism, Minister for Defence, Minister for Science, Minister for Climate Change, and Minister for Environment and Water all visited China. The Prime Minister visited in 2011, while the Governor-General visited in 2010. State and Territory premiers and ministers are also regular visitors to China — and we have 82 'sister' relationships with Chinese provinces and cities.
But it is a two-way exchange. General Secretary of the Chinese Communist Party and President-to-be Xi Jinping visited Australia in 2010 (as Vice President), and remarked that he has visited all mainland Australian states and territories. Vice Premier and expected next Premier Li Keqiang visited Australia in 2009. The remaining five Politburo Standing Committee members — making up China's seven most senior leaders — have also all visited Australia at various points in their careers.
Cultural relations and people-to-people links
Australia-China links at the grassroots level are also important. These cultural and people-to-people links serve as the day-to-day ties between the two countries. Tourism and education are a significant part of this, but the contribution made by Chinese migrants to Australian life and culture over many years should not be understated.
There were reports of Chinese traders reaching the north coast of Australia as early as the 1750s — and possibly earlier — while the first large-scale contact took place in the 19th century, when large numbers of Chinese miners came to Australia during the gold rushes of the 1850s (Victoria) and 1860s (New South Wales). By 1861, around 40,000 Chinese were living in Australia, representing 3.3 per cent of our population.
Regrettably, in a shameful episode of Australian history, the Immigration Restriction Act 1901 and related 'white Australia' policies subsequently saw Chinese and other ethnic groups denied entry to Australia, persecuted, and/or removed from Australia from the time of Federation. The final vestiges of these policies were removed in 1973.
Nevertheless, despite persecution, many Chinese remained in Australia and when the policies were lifted, more arrived. Australia is all the richer for their contributions in all fields of life, including politics (former Melbourne Lord Mayor John So, for example); medical science (Dr Victor Chang); and real estate (LJ Hooker was the descendent of an early Chinese migrant, and his real name was Leslie Joseph Tingyou), to name just a few. China's contribution to Australia's culinary traditions should also not be forgotten — there are few towns in Australia without a Chinese restaurant.
Australians too have been in China since the 19th century. William Mayers, from Tasmania, went to study in China in 1859 and was involved in negotiations to bring the first railway and steam engine to China; Australian journalist George Ernest Morrison was a correspondent for The Times in China from 1897-1912, became an adviser to the then Chinese Government, and represented China at the WWI peace talks in Versailles in 1919; and from the 1920s through to 1949, other Australians lived and worked in China, including journalists, missionaries, and business people.
Our cultural links are being developed both organically, through direct contact between our citizens as a result of migration, tourism, business and education links, as well as through official efforts. The Australian and
Chinese governments are working to promote cultural awareness and mutual understanding, including through the reciprocal Year of Australian Culture in China and Year of Chinese Culture in Australia, in 2010-11 and 2011-12 respectively. Over the course of these two years, each country was able to showcase a range of cultural events, from the traditional to the contemporary, from music to sport — an AFL exhibition match was played in Shanghai in 2010 between the Melbourne Demons and the Brisbane Lions, with Mandarin commentary provided for the 7,000 or so spectators by a young Melbourne-based Chinese Australian.
Australia's 2011 census highlighted just how important the Chinese community is in Australia, with around 4 per cent or 865,000 Australian residents identifying themselves as having Chinese ancestry, and Mandarin the second most common language spoken at home (with Cantonese ranked fifth).
The growing level of understanding and trust that has developed through the personal links between Australia and China has the potential to help keep our overall relationship on track when — as is inevitable — we have our occasional ups and downs.
Economic Relations
Australia and China's economic relationship has grown rapidly in recent times, especially the trade relationship. From small beginnings, the trade relationship is now one of the key strands linking the two countries. China is Australia's largest trading partner, in terms of both exports and imports, while Australia is China's sixth-largest merchandise trading partner, ranking just outside the top ten in terms of exports and fifth in imports (DFAT, 2012).
While Chinese investment into Australia remains low compared with investment from other countries, it has grown fast in recent years and there is scope for it to continue to increase to the benefit of both countries.
Australian businesses have also invested in China, with a number of notable successes. As China continues its economic liberalisation, and capital flows become easier, there will be further opportunities for Australian businesses to invest and expand operations in China.
Australia's early trade relationship with China
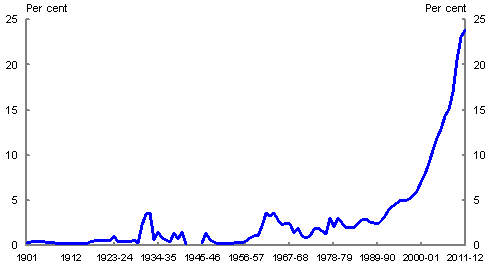
Trade with China dates back a long way. However, in the early days of Federation it was relatively small, with China accounting for only around 0.3 per cent of Australia's total merchandise trade flows in 1901.
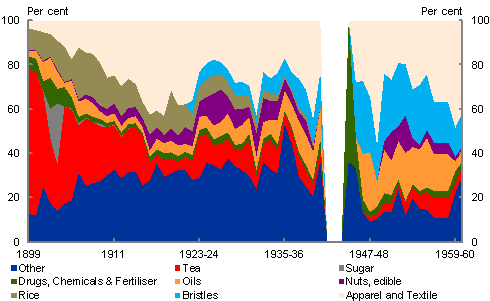
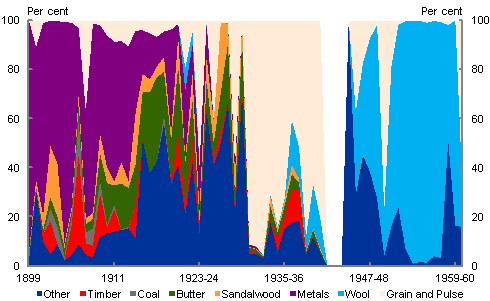
During the first decade of Federation, tea and rice were the main Australian imports from China, accounting for almost half of our imports from China (Chart 1). Silk was another significant import, with a share of just under 10 per cent. These imported goods were largely paid for through the export to China of precious metals such as silver and gold bullion, copper ingot and pig lead, and to a lesser degree, the export of grains (Chart 2).
In the second decade of the 20th century, apparel and textiles (largely silk at this stage) overtook tea and rice as Australia's primary imports from China. Their share, peaking at 43 per cent of imports in 1918-19, averaged around 35 per cent between 1910 and 1920.
Chart 1: Composition of Australian imports from China
Source: Australian Bureau of Statistics (ABS) Cat. No. 5409.0 and Treasury.
During this period, beyond the export of metals (pig lead, silver and gold); agricultural goods were also becoming an increasingly important Australian export to China. Butter, which made up less than 2 per cent of our merchandise exports to China at Federation, rose and peaked at around 34 per cent in 1917-18, with an average share of around 20 per cent during this decade. In 1901, around 35,000 pounds of butter was exported to China, increasing to 950,825 pounds by 1917-18, a 27-fold increase in volumes from Federation.
Wheat also became an increasingly important part of the trade relationship from 1920, accounting for almost a third of Australian exports to China by value between 1920 and 1930, increasing to over 90 per cent in the early 1930s, and accounting for an average of around 70 per cent throughout the 1930s. During this period, apparel and textiles continued to be our main import from China; however, the importance of silk declined markedly.
Bilateral trade fell during the Second World War and did not pick up significantly until 1946-47. The post-war resurgence of trade saw the emergence of wool as a key export to China. Wool accounted for over a third of Australian exports to China, rising to around 99 per cent of our exports to China in 1953-54, before settling to around 83.5 per cent by the end of the 1950s. Meanwhile, wheat and flour exports became relatively less important until the start of the 1960s.2
On the import side, the post-war decades saw apparel and textiles regain the position of our largest import from China, representing almost half of all Chinese imports in 1959-60. Another significant import at this time were bristles, with its share of total merchandise imports from China rising from around 14.5 per cent in 1940-41, peaking at around 33 per cent in 1946-47 before settling back to around 13 per cent in 1959-60.
Chart 2: Composition of Early Australian exports to China
Source: ABS Cat. No. 5409.0 and Treasury.
By the beginning of the 1960s, due to poor grains harvests, China began to heavily import Australian wheat, with imports increasing from around 16,000 tons in the 1950s to almost two million tons in 1961-62. By the late 1960s, wheat made up over 90 per cent of our total exports to China. Wool was the other main agricultural export, with hides and skins adding a small percentage. Non-ferrous ores, iron and steel made up the main non-agricultural component.
In the 1960s, Australia still largely imported textiles, clothing and footwear (in that order) from China, which accounted for almost half of total merchandise imports from China, growing to around 62 per cent in 1969-70. Other notable imports were crude animal and vegetable material, non-metallic mineral manufactures and textile fibres and their waste (largely bristles).
Notwithstanding these shifts in composition, by the start of the 1970s, the significant of trade between Australia and China had barely grown since Federation. At this stage, China only accounted for 1 per cent of Australia's total merchandise trade (Chart 3).
However, the normalisation of diplomatic relations in December 1972 paved the way for greater economic relations between Australia and China, and put Australia in a position to benefit from the opportunities arising from the significant transition that would begin in China a few years later.
Chart 3: China's share of Australia's total merchandise trade
Source: ABS Cat No. 5409.0; DFAT (2012) STARS Database.
Reform and opening drives China's economic and trade growth
The economic reforms and opening-up that China embarked on from 1978, led by Deng Xiaoping, were the major turning point for China in its economic development and relationship with the rest of the world (including Australia). This process gathered pace with China's accession to the World Trade Organisation (WTO) in December 2001 (Keller, Li & Shiue, 2011).
At the start of reforms in the 1980s, China was primarily an agrarian economy. In 1980, around 81 per cent of China's po
pulation lived in rural areas and primary products were around a third of China's gross domestic product. China's share of world trade at this time was also relatively small, at less than 1 per cent of total merchandise trade.
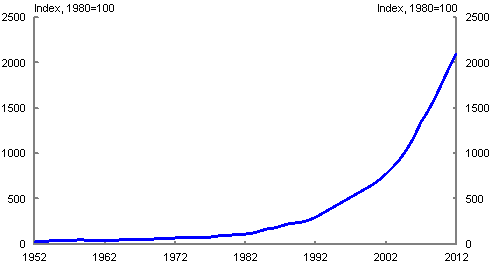
China's economic reforms and opening-up led to a strong and sustained increase in productivity growth (the benefits of convergence from relative 'backwardness') and greater capital accumulation. This was supported by favourable demographic factors and a stable and conducive external environment. As a result, since 1978, China's economy experienced rapid economic progress, growing by an annual average rate of 10 per cent and doubling in size around every eight years to be 22 times larger than it was in 1978 (Kong, McKissack & Zhang, 2012) (Chart 4). The primary sector's share of GDP also fell to around a tenth of GDP by 2011.
Chart 4: China's rapid economic development (Real GDP)
Source: Maddison (2010), International Monetary Fund (2012).
The rapid expansion in the export sector has been part of China's economic success. China's integration into the global economy meant it could capitalise on its surplus rural labour force and exploit its comparative advantage in the production of labour-intensive manufactured goods. Exposure to trade also served to improve China's institutions, business management and processes — central to being successful in competitive markets.
China's international trade grew at an annual average rate of 9 per cent between 1950 and 1978 — from a modest base. Following the 1978 reforms, and later aided by China's accession to the WTO, the pace of China's trade growth accelerated to an average rate of 17 per cent per annum between 1978 and 2011.
While access to the global market has been very beneficial to the Chinese economy, the rest of the world has also benefited from China's integration into the global trading system. Abundant supplies of low-cost labour and artificially cheap inputs to production, as well as an undervalued currency, have formed much of the basis for China's comparative advantage in low-skilled manufactured exports in recent decades. Internationally, this has significantly boosted the purchasing power of consumers, and, through price falls for intermediate and capital goods, has reduced input costs for many businesses (Coates et al, 2012).
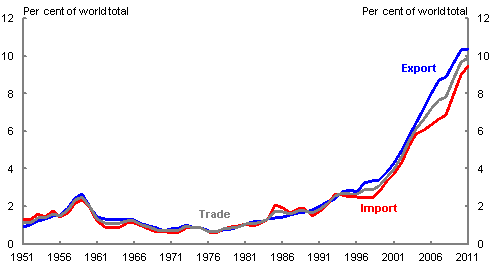
China's rapid growth in merchandise exports and imports has seen its share of world trade rise substantially. According to the WTO, China is now ranked first in global merchandise exports, accounting for 10.4 per cent of world exports, and is ranked second in merchandise imports with a 9.5 per cent share of world imports (Chart 5).
Chart 5: China's Share of World Merchandise Trade
Source: World Trade Organisation, statistical database.
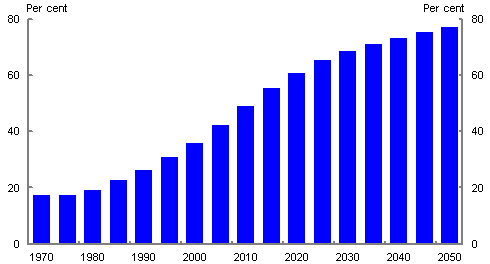
Accompanying the rapid growth in China's manufacturing industry has been the significant migration of labour from rural to urban areas, with people following employment opportunities. The proportion of China's total population living in urban areas rose from around 19 per cent in 1980, to more than 50 per cent today (Chart 6). This urbanisation process has had significant implications for Australia's resource sector, which are discussed later on.
Chart 6: China's Urbanisation Rate
Source: United Nations (2012).
Australia's rapidly growing trade relationship with China
The complementarity of Australia's and China's economies has resulted in extraordinary growth in bilateral trade over the past forty years. Merchandise trade has grown from around $100 million in 1972 to $114 billion in 2011, while services trade — negligible in 1972 — is now worth over $7 billion. China's share of Australia's total merchandise trade rose from 1 per cent in 1972 to almost 25 per cent in 2011-12.
With this strong and growing trade and economic relationship, Australia and China agreed on 18 April 2005 to commence negotiations into a Free Trade Agreement. Eighteen rounds of negotiations have taken place, but the negotiations are complex, covering an array of sensitive issues including agricultural tariffs and quotas, manufactured goods, services, temporary entry for skilled workers and foreign investment.
Our trade and economic relationship has nevertheless continued to develop apace. Indeed, the value of one day's trade in 2011-12 was worth more than one year's trade in the early 1970s.
Importing manufactures
China's main exports to Australia since Federation have been manufactured goods. From 1980 to the present, manufactured goods have made up over 90 per cent of our imports from China on average. Of this, over 90 per cent has been 'elaborately transformed manufactures' (ETMs).
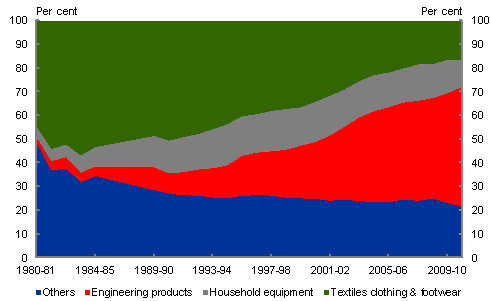
The initial phase of ETM imports from China was dominated by textiles, clothing and footwear. In 1984-85, it made up more than 53 per cent of total merchandise imports from China and the majority of ETM imports. By 1989-90, textiles, clothing and footwear accounted for 42 per cent of total merchandise imports, and 49 per cent of ETM imports (Chart 7).
Chart 7: Share of Imported Chinese Elaborately Transformed Manufactures
Source: ABS Cat. No. 5409.0 and DFAT (2011). Note: Authors' calculation prior to 1989-90 due to break in data series.
Over time, China has gradually shifted up the production value chain towards more sophisticated products (Coates, Horton & McNamee, 2012). Consistent with this, the composition of ETMs that Australia imports from China has also changed with household appliances making up a greater share since the early 1980s.
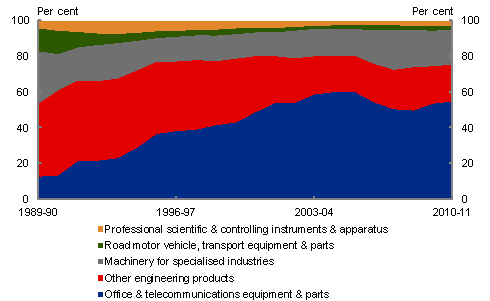
But China's manufacturing is moving beyond household appliances to more high-tech products and machinery — and we are increasingly importing these items as well. By the mid-1990s, engineering products from China began to become relatively more important, surpassing the more traditional sources of manufactured imports from China. This saw the share of engineering products to total ETM imports rise from 9.6 per cent in 1989-90 to around 50 per cent in 2010-11. Office and telecommunications equipment made up the largest share, accounting for over 50 per cent of imported engineering products from China since 2001-02 (Chart 8).
Chart 8: Component Share of Imported Engineering Products from China
Source: DFAT (2011).
In 2011, Australia imported over $42 billion worth of goods from China, of which the largest were telecommunications equipment and parts, computers and clothing, each valued at over $4 billion. Other major imports include furniture and furnishings ($1.8 billion). These imports include international brand name products manufactured in China (such as Apple computers and iPhones) as well as Chinese brands such as Haier (a Chinese multinational electronics and home appliances producer with the largest share of the world's white goods market). Earlier this year, Rio Tinto and China's Xiangtan Electric Manufacturing Corporation celebrated the completion of four custom 230-tonne trucks for
use in the Pilbara (Foley, 2012).
The expansion of global supply capacity from China's integration into the world economy exerted downward pressure on prices across a range of manufactured tradable goods.
Goods that are made outside of China have also generally become cheaper. Other export-focused countries, many in Southern or East Asia, have become part of a regionally integrated supply chain with China, allowing greater specialisation and scale in production of manufactures, and promoting increased competition for these products globally.
The 'made in China' tag has been common for some time now on manufactured products found in Australian homes. Australia imports around 25 per cent of its manufactured imports from China, and the fall in manufacturing prices has made many of these imports cheaper. The price of imported household electrical items has fallen by around 60 per cent in nominal terms since the end of 2001, while the price of imported toys, books and leisure goods has dropped by more than 35 per cent over the same period. Even the price of cars, measured by the price of non-industrial transport equipment, has fallen by 18 per cent since the end of 2001. Prices have fallen further in real terms given the rise in Australian wages over this period.
Australian businesses that rely on imports of capital goods have also benefited from lower import prices. The average price of capital goods has fallen almost continuously for around twenty years. On the same comparison used for consumption goods, capital goods are 49 per cent cheaper than they were at the end of 2001.
While other factors have contributed to falling import prices over the past decade, China's integration into the global economy has been the dominant driver. In Australia, this has seen the share of Australian manufacturing imports from China rise from 10 per cent to 25 per cent.
Exporting resources
China's rapid economic development over the past decade has generated large increases in demand for resources such as iron ore and coal, which has been partly met by Australian exporters. In fact, the surge in Australian resources exports to China has been so large that it has outweighed the rapid rise in Australia's imports of Chinese goods, with Australia one of the only developed countries to routinely run a trade surplus with China.
China's primary resource needs are for energy for electricity and transportation, building materials for urban areas and infrastructure, raw material inputs to make manufactured items and food.
The demand for building material and inputs to manufacturing generate demand for iron ore. Although China is one of the world's largest producers of iron ore, its own sources are not sufficient to economically supply its huge iron smelting industry, so it must supplement its domestic supplies with imports. As it accounts for around half of the world's pig iron production3, China needs around 60 per cent of the global seaborne supply of iron ore. Australia is the largest exporter of iron ore to China, providing over 45 per cent of Chinese imports.
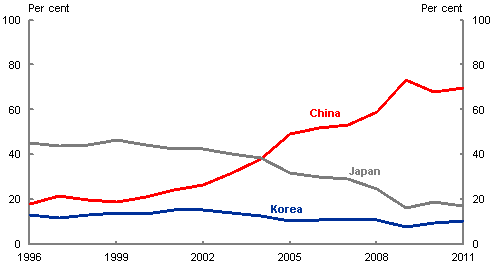
The steady rise of the Chinese iron smelting industry attracted an increasing share of Australia's iron ore exports from 1999 onwards (Chart 9). Between 1999 and 2011, annual iron ore exports to China grew at an average rate of 23 per cent each year, growing from 26 million tonnes to 305 million tonnes. Prior to this period, Japan had been the primary customer for Australia's iron ore, and although exports to Japan also increased over the same period, Japan's share of exports fell from 47 per cent to 17 per cent.
Chart 9: Share of Australian Iron Ore Exports by Destination
Source: ABS data
China's rapid economic emergence over the past decade was reflected in significantly higher prices for a range of non-rural commodities, as growth in demand for resources easily outstripped growth in supply.
Iron ore prices are set on the world market and while the global iron ore industry could satisfy the growth in China's demand for ore before 2005 at a price of around $US 20 per tonne (excluding freight), prices began to rise dramatically thereafter, peaking at around $US 190 per tonne in 2011.
Elevated iron ore prices have led to an expansion of new mining projects, both around the world and in Australia, that are expected to reduce upward pressures on prices. New capacity and a recent moderation in the output of China's steel industry have seen iron ore prices fall back below $US 130 per tonne.
The other key input in the production of pig iron is metallurgical grade coal (coking coal). China relies on fewer imports to satisfy its requirement for metallurgical coal. However, Australia is the largest global exporter of metallurgical coal, supplying just under half of the world seaborne trade, around 10 per cent of which went to China in 2011.
China has also started to import significant amounts of Australian thermal coal for electricity generation in the past four years, accounting for 13 per cent of exports in 2011.
Like iron ore, Chinese demand has had a considerable effect in the global metallurgical and thermal coal markets. However, because China has been able to expand its domestic production of coal to better match its own demand, a smaller share of Australia's exports have been diverted away from more traditional destinations.
Strong demand for coal started to drive prices up around 2004. The typical thermal coal contract price rose from around $US 27 per tonne (excluding freight) to $US 125 per tonne by 2008, while metallurgical coal contract prices increased from around $US 46 per tonne in 2004 to a peak of $US 330 per tonne in mid-2011. Over 2012, spot prices for both metallurgical and thermal coal have moderated, although prices remain high by historical standards. Lower prices reflect the slower growth in Chinese steel production, weaker growth in Chinese electricity consumption and supply expansions from coal producers around the world responding to the increase in prices.
Rising export prices and falling import prices both contribute to increasing purchasing power in Australia. The ratio of the two prices is referred to as the terms of trade and measures what volume of imports Australia can afford by selling a given volume of exports. The terms of trade is the most cited summary measure of the benefits Australia has enjoyed as a result of the resources boom.
The recent moderation in commodity prices has lowered Australia's terms of trade. Nevertheless, they remain around 90 per cent higher than their average level from the 1990s, prior to the resources boom.
Australia's position as a resource supplier to China is due to a number of factors including geology, location and political stability.
Australia's geology contributes to our relative advantage not just because of the quantity of minerals that are found locally, but also their proximity to the ocean where they can be cheaply loaded onto ships that transport material at very low cost. Although these deposits are located in remote parts of the country, like the Pilbara for iron ore and the Bowen Basin for coal, in most cases they are still close to the coast.
While marine transport is cheaper than overland transport, our proximity to China is enough to give Australia a competitive advantage over the next largest iron ore exporting nation, Brazil. The difference in freight costs between the two routes is around 10 per cent of the cost of the ore.
Australia's sta
ble political environment also reduces sovereign risk, encouraging long-term investments. For commodities that are globally traded, investors also require confidence that access to world markets is not at risk from changes in trade policy. Australian trade policy includes a strong commitment to open trade. The relaxation of iron ore trade restrictions in 1960 provided the impetus for the development of the iron ore industry in the Pilbara region. Although originally exploited to provide ore to the Japanese market, the development of the Pilbara to become the world's largest provider of seaborne ore has paralleled the liberalisation of Australia's trade policies.
Recent moves by India to restrict iron ore exports in response to domestic concerns about their own iron smelting industry highlight the alternative approaches that can be adopted in other countries with significant iron ore reserves. These changes will potentially limit returns to Indian miners and put upward pressure on world iron ore prices, even if they have benefits for Indian iron smelters.
The close links between Australia and China are also increasingly important for the rest of the world. Because iron is overwhelmingly the most commonly used metal in the world, the transport of iron ore from the Pilbara to Chinese ports like Qinhuangdao is one of the key trade relationships in the global economy today. Much of the metal that is found in Chinese manufactured goods started its journey in Western Australia, ending up in almost any conceivable destination.
Trade in Services with China
China's rapid industrialisation and urbanisation has led to strong growth in resources trade over the past decade. However, growing incomes in China have also resulted in a sizable middle class — 150 million by one estimate (Kharas and Gertz, 2010) — and a strengthening relationship in services trade.
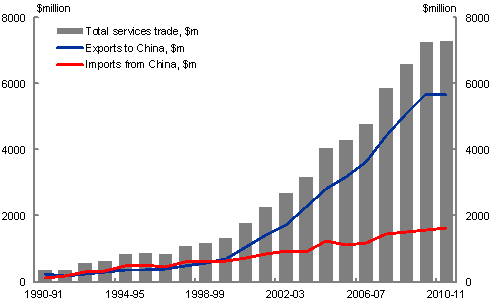
In 1972, when we established diplomatic relations, our services trade was negligible. At that time, there were fewer than 500 arrivals from China, and there were no Chinese students in Australia. Only a few Australians either visited or studied in China. Today, tourism and education are significant Australian services exports to China and a central part of our people-to-people links, and China is our largest services export market overall (Chart 10).
Chart 10: Trade in Services with China
Source: ABS Cat No. 5368.0 and 5368.0.55.003 and Year Book Australia (various editions).
Inbound travellers
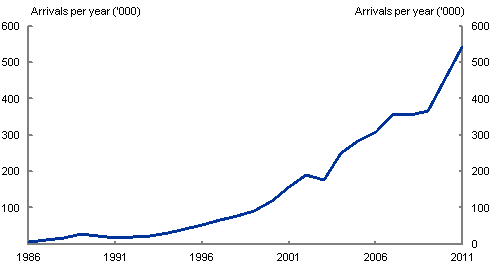
China is one of Australia's most important inbound traveller markets. It was our highest source of tourism income in 2011, with total inbound economic value (TIEV) of $3.5 billion, and our third largest market in terms of visitor arrivals, at 542,000 (overtaking the US) (Chart 11). It is currently on track to overtake the UK this year, with 515,000 arrivals from China in January-October this year compared with 440,200 from the UK. This would place China second behind New Zealand.
The number of Chinese visitors to Australia has grown strongly since 1972, supported in 1999 by Australia (along with New Zealand) becoming the first western country to be granted Approved Destination Status (ADS). (The ADS is a bilateral tourism arrangement between the Chinese Government and a destination whereby Chinese tourists are permitted to undertake leisure travel in groups to that destination.) Australia's management of ADS is considered 'best practice' by the China National Tourism Administration, and we have received nearly 830,000 tourists under the ADS scheme as at June 2012.
Chart 11: Arrivals from China into Australia
Source: ABS Cat. No. 3401.0.
Australia and China are now seeking to build further on the tourism relationship, with a Memorandum of Understanding (MOU) on Strengthening Tourism Cooperation signed in 2011 between the Australian Department of Resources, Energy and Tourism and the China National Tourism Administration. The MOU continues the ADS scheme, but seeks to build broader cooperation on tourism issues, including in emerging travel segments such as individual, education and company paid incentive travel, as well as acknowledging other areas of cooperation including industry development and the safety of tourists.
While ADS group travel will remain important, particularly for first-time travellers to Australia, independent travel is growing strongly, with over 177,000 non-ADS tourist visas issued to Chinese citizens in 2011-12. This represents growth of almost 120 per cent compared with five years ago, while ADS visitor numbers have grown around 40 per cent over the same period.
The increasing number of airlines and routes between Australia and China are also expanding our tourism and people-to-people links. No longer are travellers limited to flights between Beijing, Shanghai, Sydney and Melbourne — direct flights now include Guangzhou, Brisbane and Perth, with further direct flights covering Cairns and Chengdu to commence soon. These links open up regional development opportunities for both our countries.
The Tourism Forecasting Committee estimates that arrivals from China will continue to grow, to reach over 1 million arrivals by 2020.
Education
Students also make up a significant proportion of visitors to Australia.
The first five Chinese students to study in Australia after the establishment of diplomatic relations arrived in 1975 (Rudd, 2011). The number of Chinese students studying in Australia increased rapidly from the late 1980s, following the introduction of policies in Australia that allowed universities and other educational institutions to offer places to full fee-paying overseas students and the lifting of limits on the number of international students (Hall and Hooper, 2008).
There has been a further significant increase in the number of Chinese students coming to Australia over the past decade. In 2011-12, Australia granted just under 50,000 student visas to Chinese citizens — a fifth of all student visa grants and well above the next largest nationality (around 34,000 student visas granted to Indian citizens) (Department of Immigration and Citizenship, 2012). This is more than double the number of student visas granted to Chinese citizens in 2002-03 (around 22,600).
The high number of Chinese students in Australia has led to strong links between Australian and Chinese institutions. A study by Universities Australia has recently found that with 885 formal agreements between Australian and Chinese institutions, Australia now has more links with Chinese institutions than with any other nationality. There are also 146 offshore programs offered in China by Australian institutions and their Chinese partners (Evans, 2012). The Southeast University-Monash University Joint Graduate School established earlier this year in Suzhou, for example, will graduate students with degrees from both Southeast University and Monash. These links between our universities and our students are likely to continue to develop over time and contribute towards the building of relationships between future leaders of our two countries.
China's expanding middle class will continue to seek greater access to educational opportunities as a driver for more highly skilled and better paid jobs. Enrolments in higher education in China grew from an estimated 2.18 million to 9 million between 1992 and 2002 (DFAT, 2005) and to 34 million by 2010 (National Bureau of Statistics of China, 2011). This ongoing rapid growth presents a challenge for domestic Chinese educational institutions to meet the growing demand. A growing number of Chinese are also showi
ng a preference towards studying abroad, with one survey finding that 85 per cent of Chinese high net worth individuals intended to send their children overseas to study (Industrial Bank and Hurun Report, 2012). However, in 2010 just 2 per cent of Chinese tertiary students were enrolled abroad, suggesting that there is significant room for growth (Organisation for Economic Co-operation and Development, 2012).
Australia's international education sector has been undergoing a period of change, driven by adjustments to our migration policy, changing perceptions of the education market, the increased value of the dollar and the growth of overseas competitors (ABS, 2011). Together, these have contributed to a 10 per cent decrease in the number of student visas granted to Chinese citizens when compared with the high point of 2008-09 — although this compares well with the overall decrease of around 20 per cent, and almost 50 per cent decrease in Indian student visa grants) (Department of Immigration and Citizenship, 2012). However, student visa applications have now stabilised. Going forward, Chinese (and indeed world) demand for education services is likely to continue to grow, but in an increasingly competitive market, Australia will need to work to ensure it remains an attractive destination for Chinese students.
These tourism and education links are not just one-way. Whilst only a handful of Australians visited or studied in China in 1972, Australians made over 369,000 visits to China in 2011. Absolute Australian student numbers in China appear small at only 3,300, but this is roughly twice as many on a per capita basis than Chinese students in Australia. Numbers are likely to increase further with the focus on Asian languages as set out in the Australia in the Asian Century White Paper.
Financial services
In addition to education and tourism, Australia is also building a strong presence in China's financial services sector. All of the 'big four' banks have a branch presence in China, and we also have a long-standing interest in insurance and a growing interest in funds management and securities, with the Macquarie Group, AMP, Insurance Australia Group and Australian Super all active in China.
The Westpac Banking Corporation (Westpac) was the first Australian bank to establish a presence in China with the opening of a representative office in Beijing in 1982. The Australia and New Zealand Banking Group (ANZ) now has the largest presence, with four branches, three sub-branches, stakes in two Chinese banks, and a fully-owned rural bank. Australian financial institutions in China have welcomed China's efforts to increase efficiency, transparency and accountability in the financial services sector.
The Australian financial sector has built a strong reputation in China, supported by its resilience through the Global Financial Crisis (GFC), with the 'big four' banks all retaining AA credit ratings by Standard & Poor's through the GFC. As China opens its financial services sector further, Australian institutions should be well placed to build on their businesses in China. Financial integration between Australia and China is also increasing, with the March 2012 signing of a $30 billion (RMB 200 billion) currency swap agreement between the Reserve Bank of Australia and the People's Bank of China.
Given Australia's strength in financial services, and the potential for substantial growth in the Australia-China trade and investment relationship, there is significant scope to develop RMB-related business opportunities in Australia. The Australian Government's most recent moves in support of this include the establishment of an annual RMB trade and investment dialogue between private-sector representatives and government officials from Australia and Hong Kong, commencing in Sydney in 2013; and preliminary discussions with the Chinese Government to establish direct trading between the AUD and RMB.
Chinese banks and financial institutions are also increasingly active in Australia, with policy and commercial banks (including the People's Bank of China, Bank of China, and Industrial and Commercial Bank of China) active in loans, trade finance and transactional services, and securities and investment banking services.
Other services
Australian architects are also making a significant impact on the Chinese landscape, designing seven of China's Olympic venues, including the landmark 'Water Cube' in Beijing. Australia's GHD Architects has offices in Beijing, Changsha and Wuhan, and has provided design and consulting services on a number of water, resources, energy and urban planning projects. Australian companies have recently won a number of significant projects, including for development of a 40 square kilometre heritage area in Nanjing and a 3,800 square kilometre 'airport city' in Guangzhou.
Other Australian professional services — accounting firms and law firms, for example — are also represented in China, as are environmental services, the food and beverage industry, and others.
Investment
A thriving bilateral investment relationship is emblematic of deeper economic integration between two countries. Investment flows enable both countries to expand on established trade ties, with the recipient country gaining access to (among other things) additional capital, expertise and overseas markets, and the investor country benefiting from (among other things) local experience, expanded global networks and greater integration with its trade partner.
Australia's investment relationship with China began a lot earlier than is commonly appreciated. Some of the earliest examples date back to the large influx of Chinese migrants during the gold rushes of the 1850s and 1860s, when many Chinese set up businesses providing accommodation, food, equipment, medicine and tailoring services to name a few. The development of Melbourne's Chinatown for example, which is the longest continuous Chinese settlement in the western world, serves as an early example of Chinese investment that continues to thrive today, having evolved into a primary destination for top class restaurants from China and countries the world over.
A number of Chinese Australians also used their experience in Australia to establish businesses back in China — Ma Ying Piu, for example, worked under retailer David Jones before establishing the renowned Sincere Department Stores in Hong Kong and mainland China.
In terms of more traditionally recognisable investments, one of the first Chinese investments in Australia occurred some 25 years ago, when the China Metallurgical Import and Export Corporation (now known as Sinosteel) acquired a 40 per cent interest in a joint venture with Hamersley Iron (now part of Rio Tinto) to develop the Channar iron ore mine in the Pilbara. The mine, which produced its first 20 thousand tonne shipment to China in early 1990, has since produced around 200 million tonnes.
The investment agreement took many years to negotiate and required its own state government legislation. The initial agreement, which was championed by the highest levels of government at the time, resulted in production of only 10 million tonnes per annum. By contrast, the extension of the joint venture in December 2010 to raise production by a further 50 million tonnes per annum received considerably less attention.
Although Chinese investment in Australia grew quite slowly for some time after the Channar project, it has surged in recent years as Chinese investment worldwide has taken off, supported by China's 'go global' policy, first outlined in the late 1990s. The stock of Chinese investment in Australia on 31 December 2011 was $19.0 billion, more than three times the level in 2007 (ABS catalogue 5352.0). The Government has approved around 380 business proposals over the last five years and over $80&n
bsp;billion of total Chinese investment (including investment in Australian businesses as well as real estate investment). Australia has been China's top overseas foreign direct investment destination (excluding Hong Kong and selected tax havens) since the start of the 'go global' policy (Larum and Qian, 2012). China has been ranked in the top three sources of proposed investment for the last four years, which demonstrates the significant shift that has occurred in Australia's sources of foreign investment.
The rapid increase in Chinese investment in a short span of time has generated much attention in the Australian public, with concerns in some parts of the community (Henry, 2012; Hurst, Cai and Findlay, 2012; and Cai, 2012). This is in spite of the positive impact that foreign investment has had on the Australian economy, leading Ken Henry (2012) to comment that it is a little ironic that these concerns should be expressed so loudly in Australia. But caution amongst some sectors of the public towards foreign investment is nothing new. Back in the 1970s, there were concerns over American investment, which eventually led to the establishment of the Foreign Investment Review Board. In the 1980s, Japanese investment was also under the spotlight.
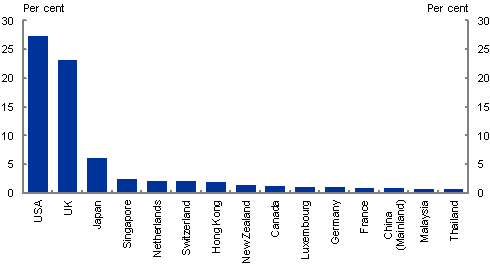
However, despite the recent growth, China is still only our 13th largest investor, with less than 1 per cent of the total stock of inward investment. This pales in comparison to traditional investors including the United States (27 per cent) and the United Kingdom (23 per cent) which combine to make up half of the total stock of foreign investment in Australia (Chart 12). Of the Asian economies, Japan (6 per cent) remains the largest foreign investor in Australia. Looking at direct investment into Australia, China is ranked 9th ($13.3 billion and 2.6 per cent of the total stock), but is still well behind the $122.4 billion from United States investors. In terms of China's own investment portfolio, although Australia has been one of its top overseas foreign investment destinations, the quantum remains limited in nature, accounting for only 2.5 per cent of China's overseas direct investment in 2010 (Yu, 2012).
Chart 12: Share of stock of investment in Australia by source country (2011)
Source: ABS Cat. No. 5352.0.
Box 1: Chinese investment successes
Following are two examples which highlight the benefits that Chinese investment brings to both our countries
Karara iron ore project — magnetite mining
Traditionally, the iron ore industry in Australia has exploited a high-grade iron ore called hematite, which accounts for roughly 96 per cent of Australia's iron ore production. Australia also has an abundance of a lower grade iron ore called magnetite but, because of the abundance of hematite, Australia has not exploited magnetite.
Chinese investors, however, have shown the necessary skill and willingness to mine and process magnetite in Australia. Effectively, a new iron ore industry is being established because of Chinese investment. The overall result is that iron ore production in Australia increases. This increases the potential supply of iron ore to China while benefiting the Australian economy.
An example of this is the Karara iron ore project in Western Australia, which is being developed through a partnership between Gindalbie Metals Ltd and Chinese enterprise AnSteel. The project is aiming for initial production of 8 million tonnes a year of magnetite concentrate (2 million tonnes a year of hematite) and eventually around 30 million tonnes a year for 30 years. The initial estimated construction cost of the project was $2.57 billion, which includes additional capacity for key infrastructure to allow for mine production to be increased in the future. Gindalbie states that the project's economic impact is as follows:
Total construction workforce: over 1,500 people.
Permanent workforce: approximately 500 people.
Indirect jobs: additional 300 jobs in the Mid West region of Western Australia, with significant business opportunities.
Export revenue: approximately $1 billion a year, rising to around $3 billion a year.
Royalties: approximately $50 million a year, rising to around $150 million a year for 30 years.
In August 2011, China's Bright Food Group reached agreement to acquire a 75 per cent equity stake in Food Holdings Pty Ltd (commonly known as Manassen Foods) for an implied value of over $500 million. Under the agreement, the remaining 25 per cent equity will be retained by current shareholders, including Roy Manassen.
The Bright Food Group is a
multinational food and beverages manufacturing company headquartered in
Shanghai, and was the second-largest China-based food manufacturing company measured by 2011 revenues. It has an extensive network of production, distribution and retail stores, as well as large farms, dairy farms and tea plantations across China. It has an established nationwide network for food production, distribution logistics and retailing businesses and trading arrangements with many multinational companies.
Manassen has the Margaret River label and acts as a distributor for a range of brands that includes Carr's, Ryvita, Laughing Cow, Jelly Belly, Sharwood's and Castello Cheese.
The companies claim Bright Food's investment and strategic partnership with Manassen will bring significant strategic benefits and opportunities for Manassen to access China and broader Asian markets. It will provide significant export benefits for Manassen through a more sophisticated understanding of Chinese consumers and Bright Food's promotion of Australian produce in the Chinese market.
Bright Food has signalled its commitment to building its presence in Australia by working in partnership with Australian growers, suppliers, customers and the shareholders and management team of Manassen Foods. The partnership provides growth opportunities for both companies and the opening of a permanent Bright Food office in Sydney signals its commitment to long-term investment in Australia.
In the other direction, Australia started to invest in China in 1979 — one of the earlier countries to do so (Yu, 2012). But our investment in China remains low compared to our trade relationship. China was Australia's 12th largest destination for investment abroad at the end of 2011, with a total stock of $17 billion invested there. Of this, $6.4 billion was foreign direct investment, making China Australia's 10th largest destination. While Australian investment in China has increased in recent years, at 1.4 per cent of total stock, it remains a very small fraction of the investment directed to developed economies.
China's foreign investment policy is managed jointly by the National Development and Reform Commission and the Ministry of Commerce, and includes a catalogue that identifies 'encouraged', and 'restricted' sectors for investment, reflecting China's economic priorities as outlined in China's 12th Five Year Programme (sectors not listed in either category are by default 'permitted'). For example, investment in high-end manufacturing, new technologies, modern services industries, clean energy and environmentally sustainable industries is 'encouraged'; investment in other services areas including telecommunications, banking and insurance, are generally restricted, as is investment in many areas of the agriculture, mining and energy resources sectors. Nevertheless, Australian companies have made some inroads, even in these
areas — Rio Tinto holds a 49 per cent stake in a joint venture with Chinalco for mineral exploration in China. Mining services companies such as Worley Parson also have a significant presence.
Box 2: Australian investment successes
Following are two examples of Australian investment successes in China, which exemplify the diversity of our investment and expertise.
Rubicon Water
Rubicon Water improves the productivity of the world's farmers in an environmentally sustainable way. They do this by delivering advanced technology to managers of open channel irrigation networks that enables them to operate and manage their water resources at high levels of efficiency and control.
Rubicon Water is the only company in the world designing and manufacturing technology specifically for gravity-fed irrigation management, and conducts ongoing research with the University of Melbourne. The technology, called Total Channel Control® (TCC) automates and optimises existing irrigation channel infrastructure using solar-powered water control gates, ultrasonic flow meters and radio communications networks and sophisticated control software.
It entered China in 2009, seeing market potential given the Chinese Government's ambitious targets to improve irrigation productivity and water efficiency (currently it is about 50 per cent) and strengthen agricultural water management.
After three years, TCC technology is now installed in six irrigation districts in four provinces. The China Irrigation and Drainage Development Center has been impressed with the results of these projects and has recommended that Rubicon Water be used by large irrigation districts to modernize their infrastructure and achieve the government's information transformation and water savings goals.
Cochlear
The Cochlear bionic ear implant is the invention of Professor Graeme Clark, Laureate Professor of Otolaryngology and Director of the Bionic Ear Institute at the University of Melbourne. The implant can enable a profoundly deaf person to achieve almost normal hearing.
Cochlear entered the Chinese market in 1995 and has established itself in Beijing and Shanghai. There are currently more than 11,500 Cochlear implant recipients in China, and around 70 medical centres capable of undertaking Cochlear implant surgery.
Cochlear has been delivering 'Auditory-Verbal Therapy' to Chinese trainers together with the China Rehabilitation Research Centre for Deaf Children and sponsored some young trainers from all over China to attend the course in Beijing. They set up two Cochlear Education and Training Centres to train the teachers from specialised schools for the deaf and the parents of the young recipients.
In April 2012, Cochlear won a national welfare project tender which ordered 2,823 cochlear implants worth $28 million in total, marking a milestone for their business development in China.
CSL
CSL Behring is a global leader biopharmaceutical company that researches, develops and manufactures speciality life-saving and life-enhancing therapies for people with primary immune deficiencies, bleeding disorders, hereditary angioedema and inherited respiratory disease. CSL products are also used to prevent haemolytic disease in newborns, speed recovery from heart surgery, prevent infection in people undergoing solid organ transplant and help victims of shock and burns.
CSL's China operation is headquartered in Shanghai with regional offices in Beijing, Guangzhou, Chengdu and Wuhan that employ over 120 staff. The China operations team includes sales and marketing, finance, human resources, regulatory, quality, medical and supply chain professionals and is supported by Cardinal Healthcare China — also based in Shanghai — a major third party Healthcare logistics company that manage CSL's specialist national product distribution.
CSL Behring has been supplying the China healthcare sector with speciality products for over 25 years and is the leading supplier of serum albumin to clinicians and patients within the National China Hospital network (albumin is the main protein of human blood plasma and medically prescribed in the critical care setting).
CSL Behring's continuing priority is to develop innovative therapies and patient programs that make a real and lasting difference to the lives of people in China and around the world.
Australian — and other foreign — investment in China will likely increase as China continues to open up its economy to foreign investment.
Looking ahead
The economic relationship between our two countries is expected to continue to grow. Most forecasters, including Treasury, expect continuing strong economic growth in China in the years to come. However, a number of commentators have raised doubts regarding the sustainability of the Chinese economic growth 'miracle' going forward, pointing to the slowdown in Chinese economic growth since the beginning of the year as evidence that the 'miracle' is coming to an end. Whilst the pace of economic growth has moderated, this is only partly due to structural factors. The weak external environment has been a more important factor, amid the ongoing fallout from the global financial crisis and the European sovereign debt crisis.
The consensus view is that China still has significant potential to grow, particularly through the ongoing process of 'catch-up', as China's overall urbanisation and productivity levels still lag significantly behind those of advanced economies. It must be remembered though that China remains an emerging economy and fluctuations around this underlying potential are to be expected, due to the emergence of imbalances and policy missteps. However, these fluctuations are likely to be around a solid trend growth line.
Within this decade, the International Monetary Fund (2012) projects China to overtake the United States to become the largest economy in the world on a real purchasing power parity basis (although on a market exchange basis, this will occur much later). The Australia in the Asian Century White Paper projects the Chinese economy to grow at an annual average growth rate of 7 per cent from 2012 to 2025, a pace that is consistent with projections made by a number of other institutions and private sector forecasters.4
Although this represents a slowdown from the stellar 'double-digit' growth that China has experienced over the past 30 years, given China's stage of development and the size of its economy, an annual average growth rate of 7 per cent is still very impressive. Moreover, this robust pace of growth appears to be much more sustainable than the continuation of the double-digit pace of past decades. Even at this more moderate rate of growth, China continues to be one of the fastest growing economies in the world and remains a key contributor to global economic growth.
Despite such rapid economic growth, by 2025, China's GDP per capita is still expected to be significantly below US levels (40 per cent) and advanced Asian economies such as Japan and Korea, strengthening the argument that there is still some way to go in China's catch-up process (Chart 12).
Chart 13: China's GPP per capita relative to the US
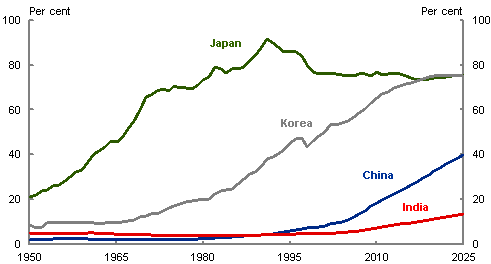
Source: Conference Board (2012), International Monetary Fund (2012), Maddison (2010) and Treasury5.
Amongst Chinese authorities, there is a growing awareness that such economic growth projections cannot be realised under the current economic growth model (which was appropriate in the initial stages of development), acknowledging that th
e economy is unbalanced and unsustainable.6
The structural transformation that is underway in China will change the nature of Australian opportunities in China (Garnaut, 2011). A transition to a less investment-reliant and more environmentally sustainable growth model will reduce the growth of China's resource demand over coming decades. Australia is expected to remain a significant supplier of resources to China, particularly of iron ore, because of our position as a low-cost source. However, unless China's resource demand climbs unexpectedly, as it did in the previous decade (or we see the rapid emergence of India (Garnaut, 2012)), the global expansion in low-cost supply that is currently underway and more moderate demand growth in China is expected to reduce the likelihood of commodity prices returning to the record levels experienced in recent years.
Beyond resources, there is also likely to be increasing demand for Australian exports in the services sector and in high-end food, beverages and leisure from the increasing size of the middle class in China, as incomes rise — Kharas and Gertz (2010) estimate that by 2021 there could be over 670 million middle class consumers, compared to 150 million today.
China is already Australia's largest services market, with tourism and education dominating our exports to date. With further economic liberalisation in China, financial and other professional services such as legal and accounting services can also look forward to expanding their presence and operations in China. Many other opportunities lie ahead in areas such as clean energy and environmental services, with China's 12th Five Year Programme emphasising sustainability and a reduction in energy intensity per unit of GDP. Health services are another potential growth area.
However, as pointed out by Parkinson (2012), although there are significant opportunities arising from the rising middle class in China and from the transformation the economy is undertaking, there are also significant challenges. While Australia had an obvious comparative advantage in the natural resources sector, allowing Australia to readily benefit from the rise of China, our services sector holds no such obvious advantage for China's middle classes. In an increasingly competitive and globalised world, Australia will be competing with the rest of the world to continue the deepening of our economic relationship with China. But with the right policy settings, we have every reason to be confident that Australia will meet the challenges.
References
Au-Yeung, W, Kouparitsas, M, Luu, N, and Sharma, D, 2013 (forthcoming), Long-term international GDP projections, Treasury Working Paper, Canberra.
Australia Bureau of Statistics (ABS), 2012, Overseas Arrivals and Departures, cat. no. 3401.0, October 2012, Canberra.
ABS, 2011, Australian Social Trends, December 2011, cat. no. 4102.0, Canberra.
ABS, Annual Statement of the Trade of the Commonwealth of Australia with the United Kingdom, British Possessions, and Foreign Countries and of the Customs and Exercise Revenue, cat. no.5409.0, various years accessed, Sydney.
ABS, Australian Statistics of Overseas Imports and Exports and Customs and Excise Revenue, cat. no.5409.0, various years accessed, Melbourne.
ABS, Overseas Trade — Australian Statistics of Overseas Imports and Exports and Customs and Excise Revenue, cat. no. 5409.0, various years accessed, Canberra.
ABS, Overseas Trade and Customs and Excise Revenue, cat. no. 5409.0, various years accessed, Canberra.
ABS, Overseas Trade, cat. no. 5409.0, various years accessed, Canberra.
Australian Chamber of Commerce, 2012, Australian Financial Services Business in China, Australian Chambers of Commerce (China).
Australian Education International, 2012, Monthly Summary of International Student Enrolments Data, October, Australian Education International.
Australian Government, 2012, Australia in the Asian Century White Paper, Canberra.
Australian National University and China Institute of Contemporary International Relations (ANU-CICIR), 2012, Australia and China — A Joint Report on the Bilateral Relationship, Canberra.
Cai, P Yuan, 2012, The media and narrative and public debate, East Asia Forum Quarterly, vol. 4, no.2, April-June 2012.
Caulfield, R, 2011, How Australian architects can succeed in China, 8 August 2011, viewed at 20 November 2012 (see the ArchitectureAU website).
Coates, B, Horton, D and McNamee, L, 2012, China: prospects for 'export-driven' growth, Economic roundup, issue 4, The Treasury, Canberra.
Conference Board, 2012, The Conference Board total economy database™, January 2012, The Conference Board, Inc.
Department of Foreign Affairs and Trade (DFAT), 2005, Education without Borders — International Trade in Education, Department of Foreign Affairs and Trade, Canberra.
DFAT, 2011, DFAT Trade in Primary and Manufactured Products, Canberra.
DFAT, 2012, China Fact Sheet, as at June 2012, Canberra (see the DFAT website).
DFAT, 2012, DFAT STARS database, based on UN Comtrade data and ABS Cat No 5368.0, August 2012 data.
Department of Immigration and Citizenship, Student Visa Grants for 2002-03 Program Year, Department of Immigration and Citizenship, Canberra, (see
Department of Immigration and Citizenship website).
Department of Immigration and Citizenship, 2012, Student visa program trends: 2005-06 to 2011-12, Department of Immigration and Citizenship, Canberra (see
Department of Immigration and Citizenship website).
Department of Resources, Energy and Tourism, 2012, Tourism Research Australia, Forecast 2012 Issue 1, Department of Resources, Energy and Tourism, Canberra (see
the Department of Resources, Energy and Tourism website).
Evans, C, 2012, Speech to Group of Eight — China Nine University Presidents' Forum, 2 August 2012, Sydney.
Foley, M, 2012, Rio partners Chinese truck supplier, threatens OEM stranglehold, Australian Journal of Mining (see
the Australian Journal of Mining website).
Garnaut, R, 2011, Australian opportunities through the Chinese structural transformation, Australian Economic Review, vol. 44, issue 4, pp 437-45.
Garnaut, R, 2012, The contemporary China resources boom, The Australian Journal of Agricultural and Resource Economics, vol. 26, issue 2, pp 2
22-43.
Hall, G and Hooper, K, 2008, Australia's exports of education services, Reserve Bank of Australia Bulletin, June 2008, Reserve Bank of Australia, Sydney.
Henry, K, 2012, Comments on foreign investment in Australia, Remarks at ANU Global Investment Conference, 5 September 2012.
Hurst, L, Yuan, P and Findlay, C, 2012, Chinese direct investment in Australia: public reaction, policy response, investor adaption, EABER Working Paper Series, No 81, October 2012.
Industrial Bank and Hurun Report, 2012, The Chinese luxury consumer white paper, Industrial Bank Co Ltd and Hurun Report, Beijing.
International Monetary Fund, 2012, World Economic Outlook Database, October 2012, Washington.
Keller, W, Li, B and C H Shiue, 2011, China's foreign trade: Perspectives from the past 150 years, The World Economy, vol. 34, pp 853-92.
Kharas, H and Gertz, G, 2010, The new global middle class: A cross-over from West to East, in C Li (ed.), China's emerging middle class: beyond economic transformation, Brookings Institution Press, Washington, DC.
Kong, V, McKissack, A and Zhang, D, 2012, China in a new period of transition, Treasury Economic Roundup, Issue 4, Canberra.
Larum, J and Qian, J, 2012, A long march: the Australia-China investment relationship, Australia China Business Council, October 2012.
Maddison, A, 2010, Statistics on world population, GDP and per capita GDP, 1-2008 AD, Historical statistics, Groningen Growth and Development Centre.
Ministry of Education, People's Republic of China (information provided November 2012).
National Bureau of Statistics of China, 2011, China Statistical Yearbook 2011, China Statistics Press (see
the National Bureau of Statistics of China website).
Organisation for Economic Co-operation and Development, 2012, Education at a Glance 2012: OECD Indicators, OECD Publishing, September 2012.
Parkinson, M, 2012, Challenges and opportunities for the Australian economy, Speech to the John Curtin Institute of Public Policy Breakfast Forum, 5 October 2012.
Rudd, K, 2011, 40 Years: The Australia-China Relationship, Speech to the Australia-China Forum, Canberra, 2 November 2011.
Spearrit, P, 1996, Hooker, Leslie Joseph (1903-1976) in The Australian Dictionary of Biography.
Tourism Australia, 2012, China Market Profile 2012 (see
the Tourism Australia website).
United Nations, 2012, World Urbanization Prospects, 2011 Revisions, August 2012, New York.
Whitlam, GE, 2010, The Road to China, Cosmos Books, Hong Kong.
World Bank and Development Research Centre of the State Council, the People's Republic of China, 2012, China 2030: Building a modern, harmonious and creative high-income society, World Bank, Washington, DC.
World Trade Organisation, statistical database, viewed 22 November 2012 (see
the World Trade Organisation website).
Xinhua, 2012, Chinese premier says China committed to sustainable growth, 25 April 2012 (see the Xinhua website).
Yu, C Sen, 2012, Sino-Australian economic relations: a general review, in Reilly, J and Jingdong, Y (eds), Australia and China at 40, UNSW Press, Sydney.
1 The authors are from Macroeconomic Group, the Australian Treasury. This article has benefited from comments and suggestions provided by Jared Bullen, Owen Freestone, Samuel Hurley, Jason McDonald, Adam McKissack, Stewart Nixon and Barry Sterland. We would also like to thank Rebecca Bowden for her research assistance and acknowledge input provided by Sally Deane and Taliessin Reaburn from Austrade. The views in this article are those of the authors and not necessarily those of the Australian Treasury.
2 The only exception is in 1949-50, where the combined share of wheat and flour would be around three quarters of total merchandise exports to China.
3 Pig iron is produced by smelting iron ore with coke, the primary method by which iron is extracted from natural sources.
4 For example, the joint report China 2030 by the World Bank and China's State Council Development Research Centre (2012) projects annual average growth of 8.6 per cent over 2011-2015, slowing to 5.9 per cent over 2021-2025, which implies an annual average growth rate of around 7 per cent over 2012-2025.
5 Projections are based on the methodology of Au-Yeung, Kouparitsas, Luu and Sharma, 2013 (forthcoming)
6 Chinese Premier Wen Jiaobao said China was still in the process of industrialisation and urbanisation, and faced serious problems from unbalanced, uncoordinated and unsustainable development (Xinhua, 2012).